

- HOME
- SCIENCE
- HIGHLIGHTS
- DATA & MAPS
- DATA FOR YOU
- MEETINGS
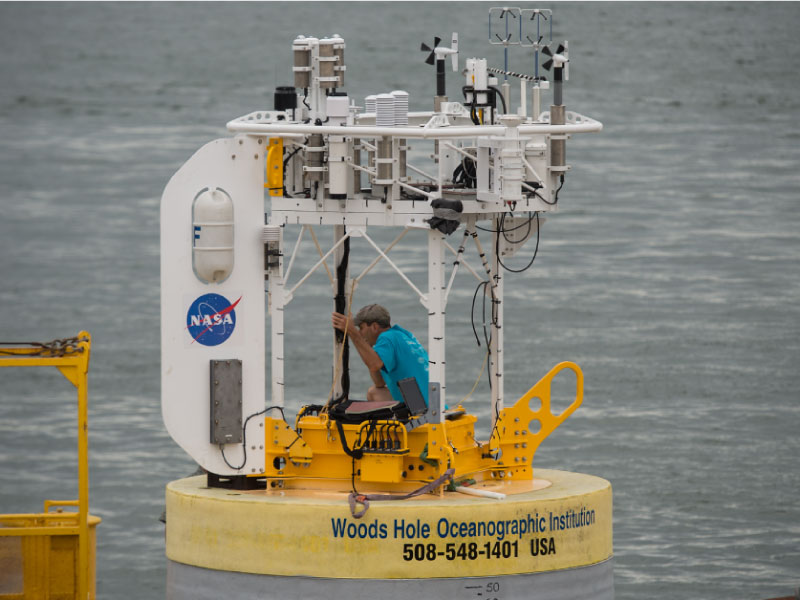
Determining ocean salinity trends is not a simple task. With differences in the amount of water, heat, and salt constantly coming and going, as well as gradients across depth and latitude, it's a challenging task to undertake. Dr. Farrar shares what data from a fixed mooring within the SPURS area can tell us about the overall "salt budget" for one of the saltiest parts of the world's ocean. His story includes describing the nerve-wracking process of deployment and recovery of the mooring, as well as how data from the buoy can work in conjunction with satellite data to produce a more complete picture of the ocean's "salt budget".


Dr. Farrar's concept map illustrates the diversity of measurements that can be gathered from one platform and how those measurements can inform the greater salt budget. The different instruments measuring heat, freshwater and current movement are showcased.
 |

👋 Hello, Explorer!
I'm the NASA Salinity Assistant. Ask me anything about ocean salinity, missions, and data!
👋 Welcome to NASA Salinity AI Assistant!
I know everything about this website — missions, data, science, publications and more. What would you like to know?
Powered by · NASA Salinity