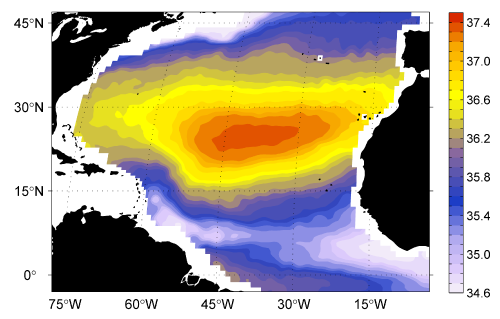
These weekly gridded maps are based on the optimum interpolation (OI) analysis of Aquarius Version 4 sea surface salinity data for the North Atlantic Ocean. This analysis is intended to reduce the long-wavelength, inter-beam and ascending-descending biases which have been present in Aquarius data, as well as improve the accuracy of surface salinity maps in the SPURS region.
Weekly OI sea surface data (netCDF files) can be downloaded from the International Pacific Research Center here.
Images are provided by Oleg Melnichenko, Assistant Researcher at the International Pacific Research Center, located within the School of Ocean and Earth Science and Technology at the University of Hawai'i at Manoa.