- HOME
- SCIENCE
- HIGHLIGHTS
- DATA & MAPS
- DATA FOR YOU
- MEETINGS
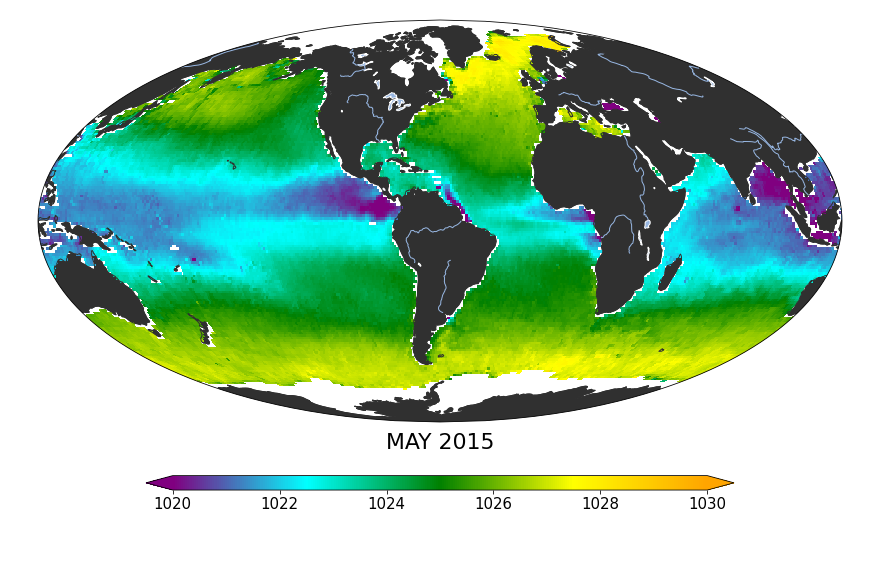
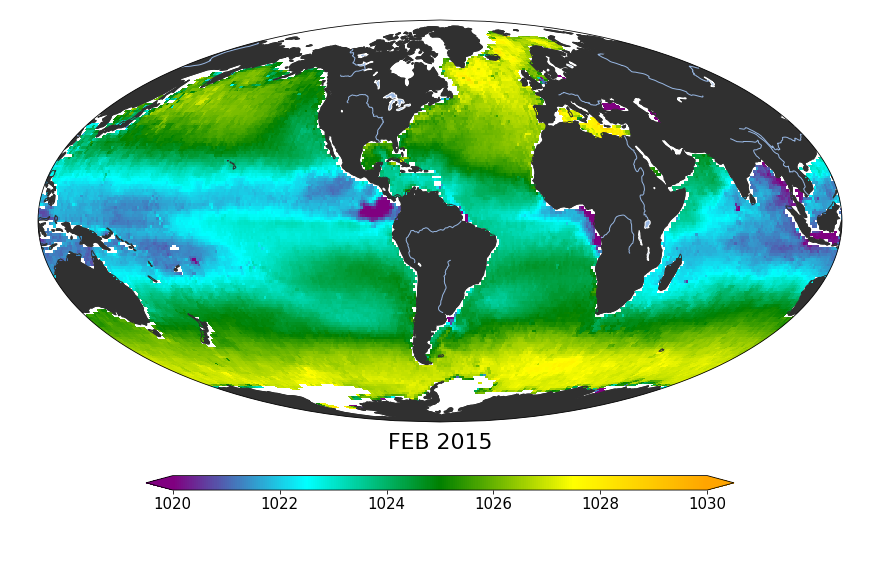
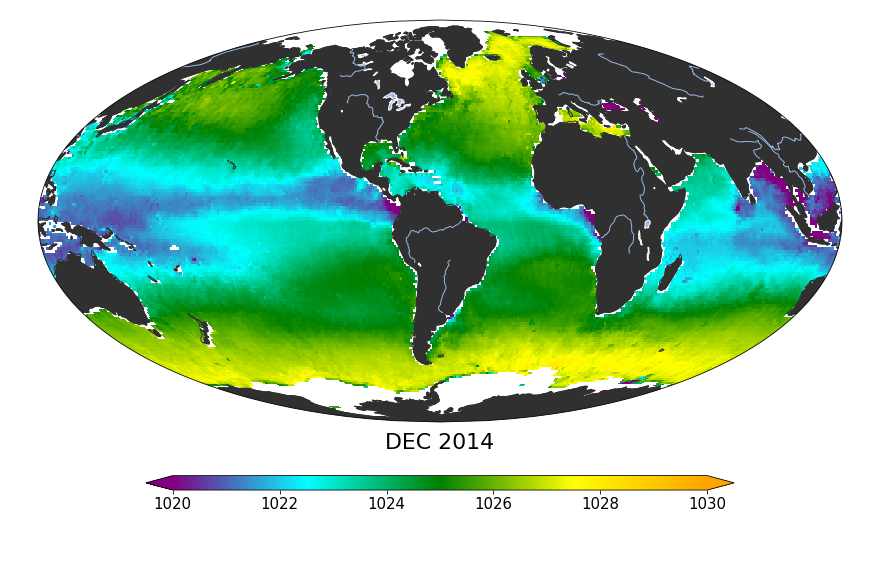
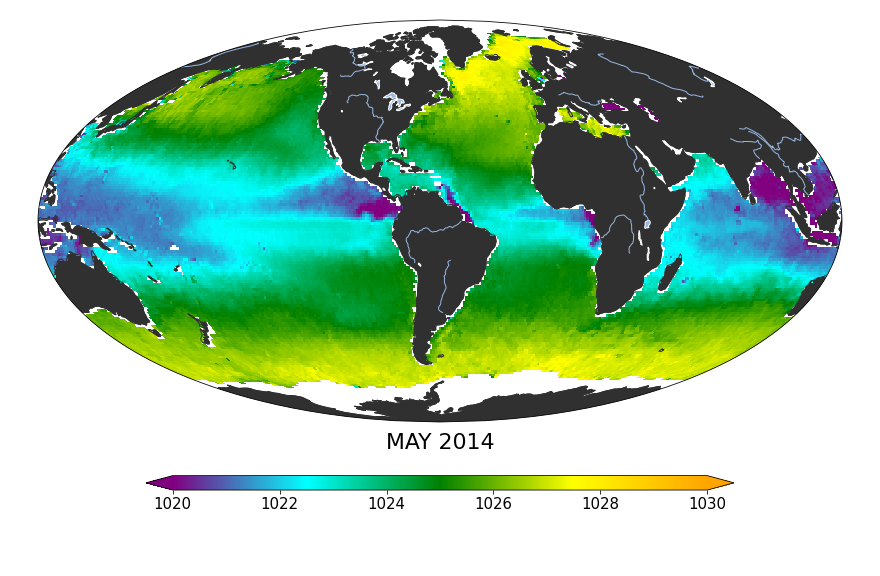
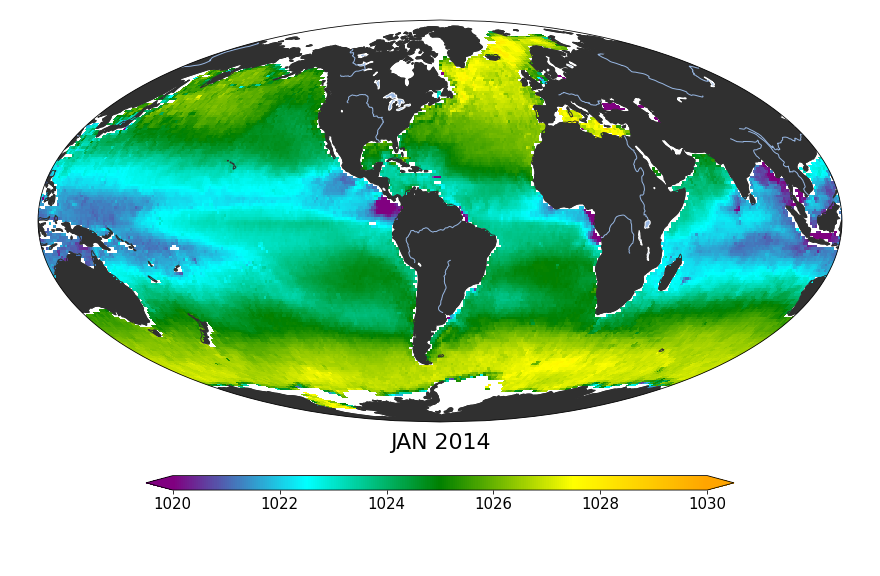
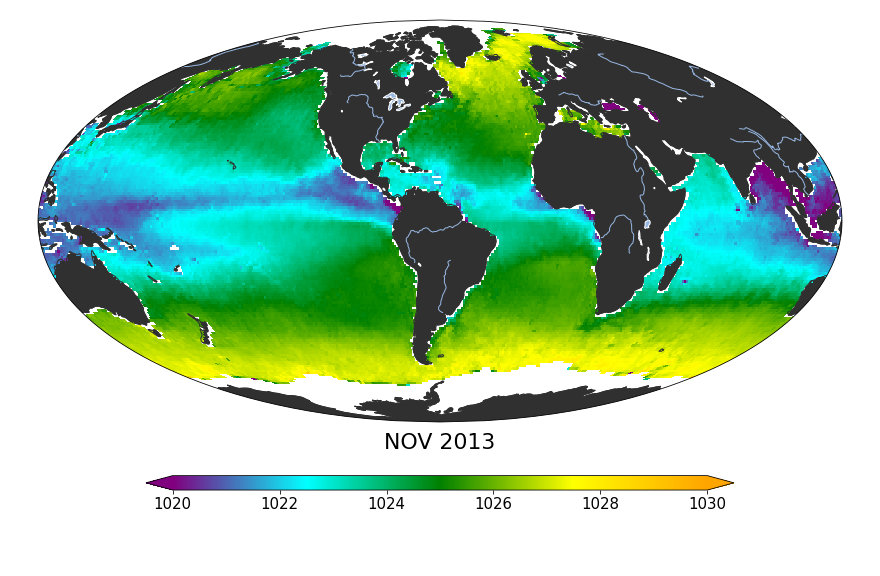
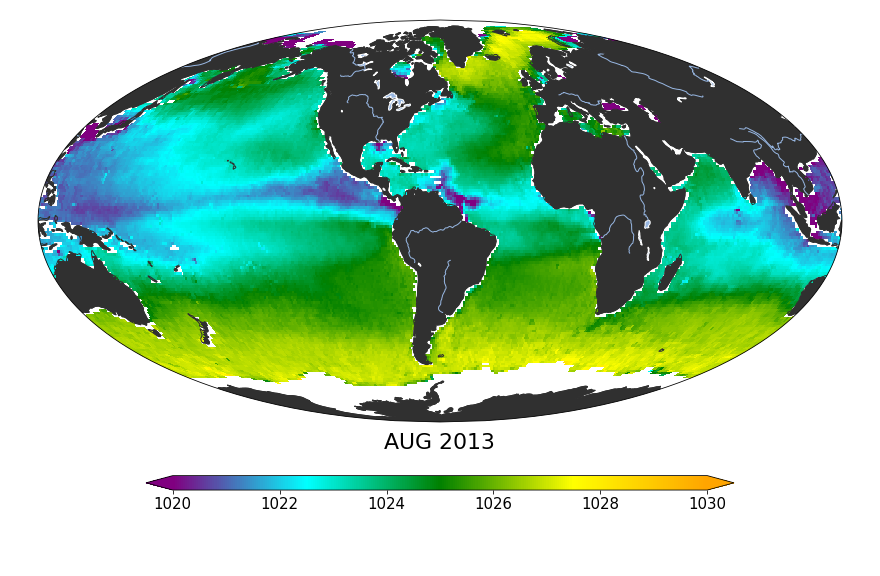
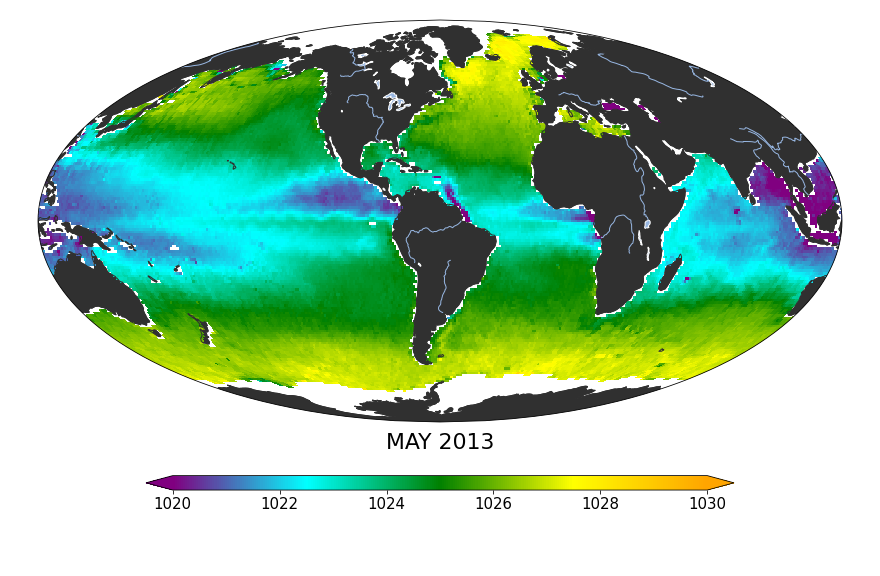
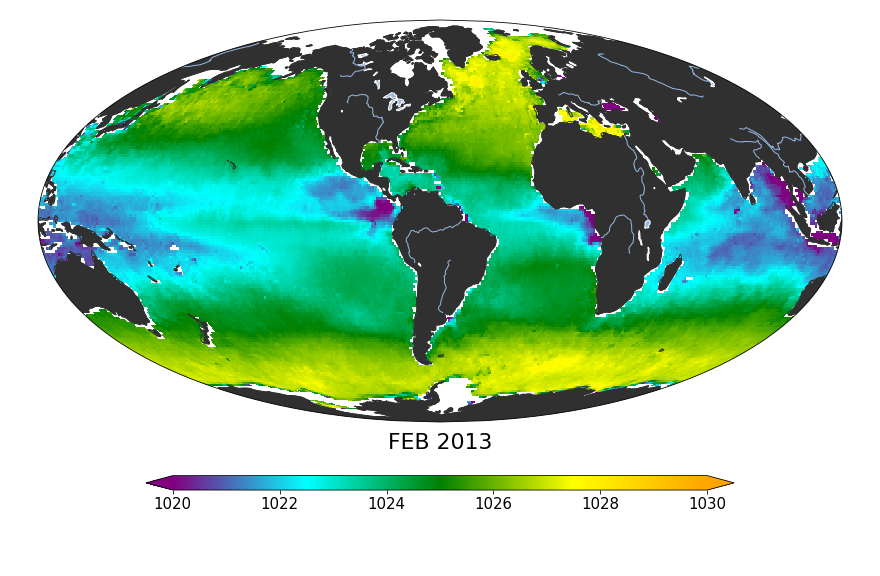
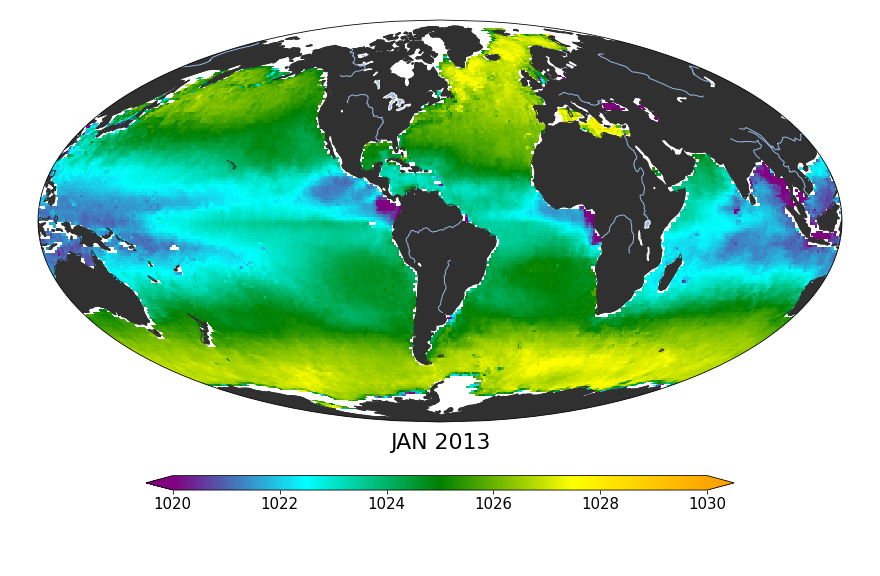
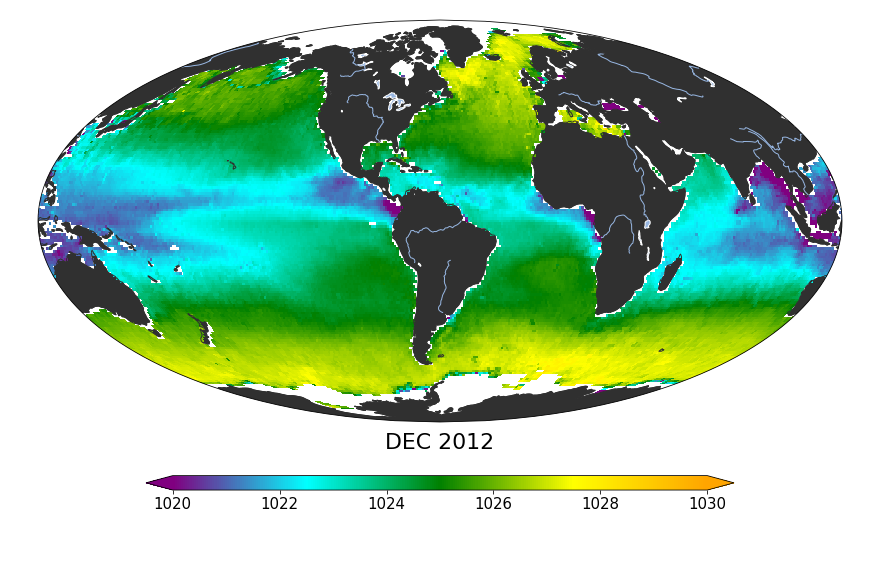
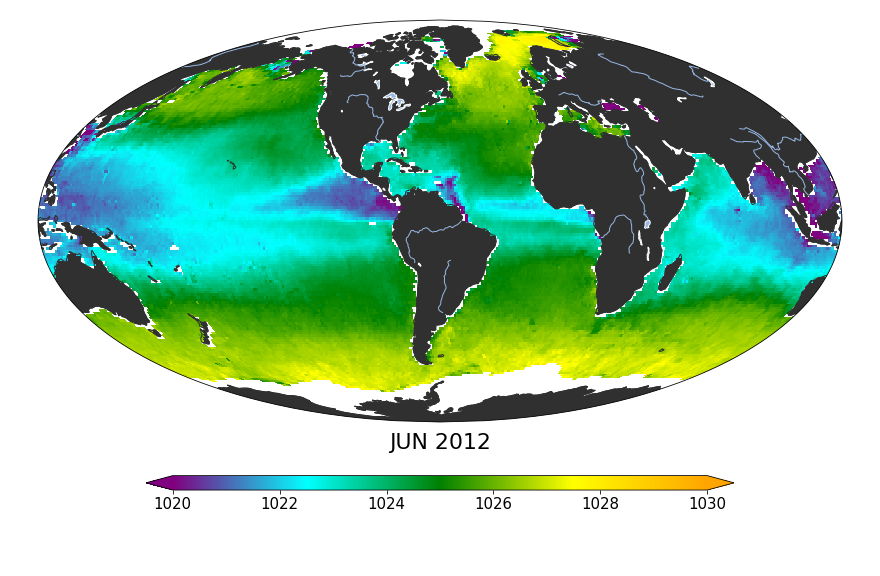
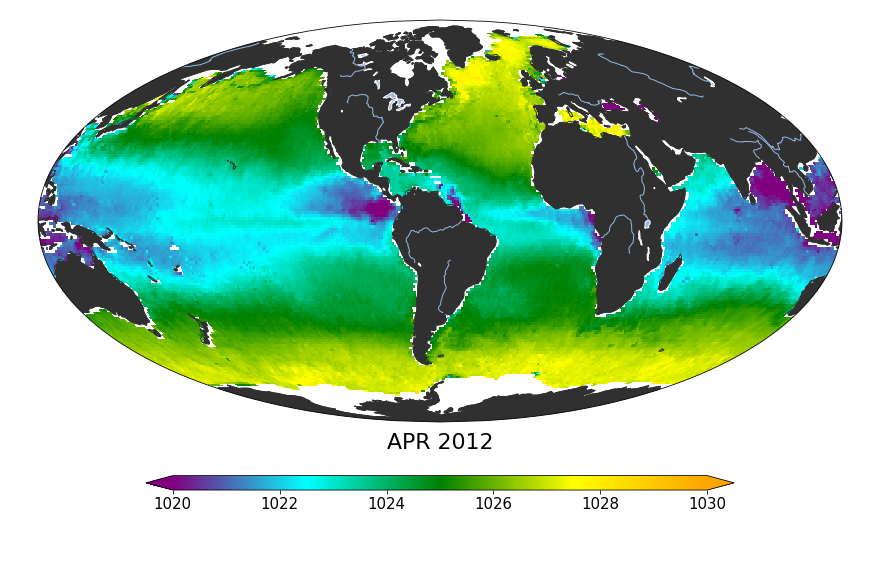
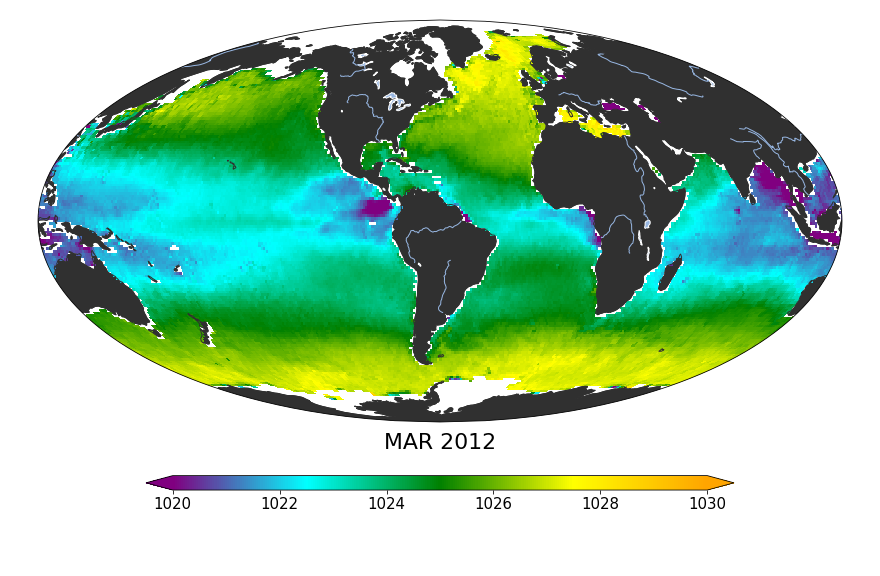
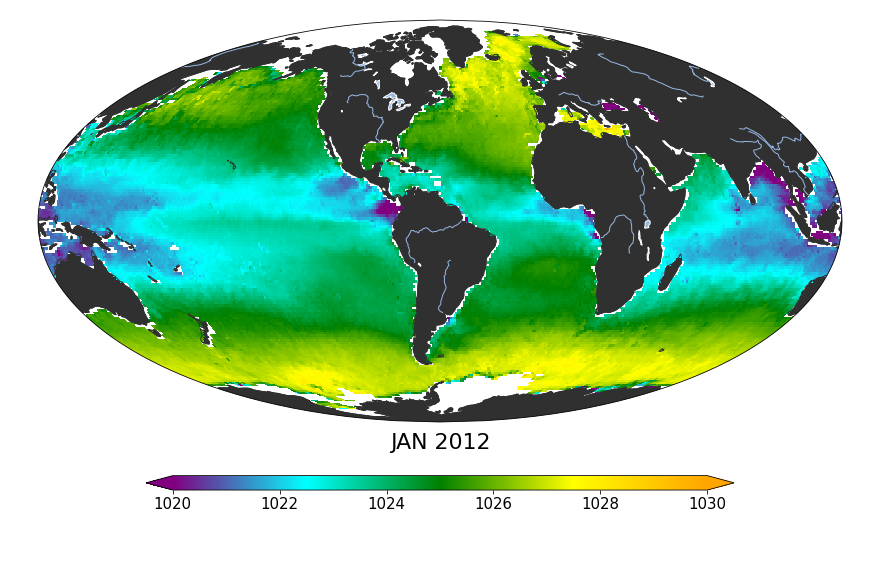
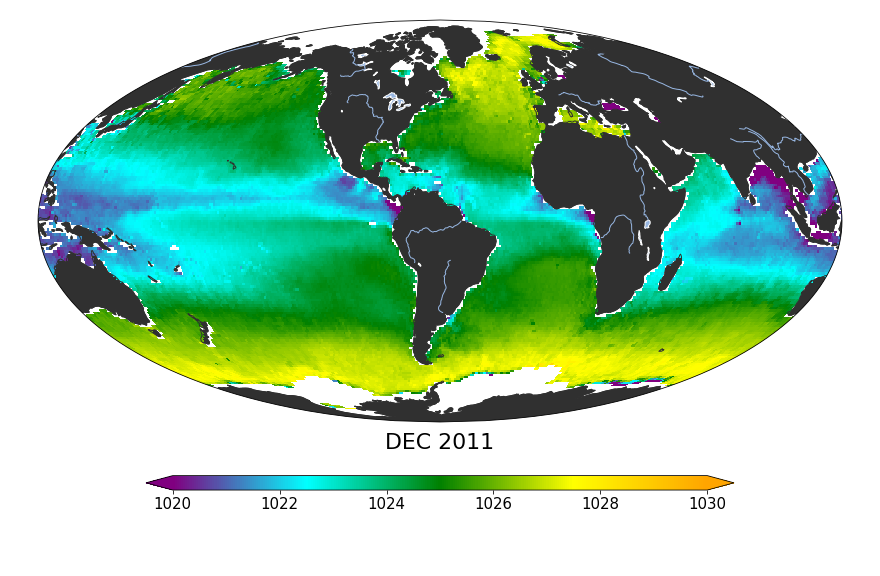
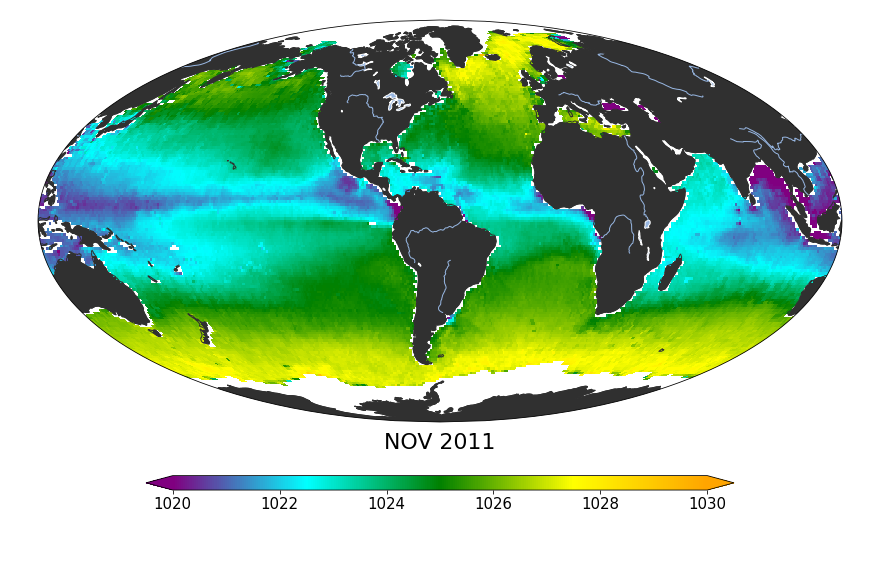
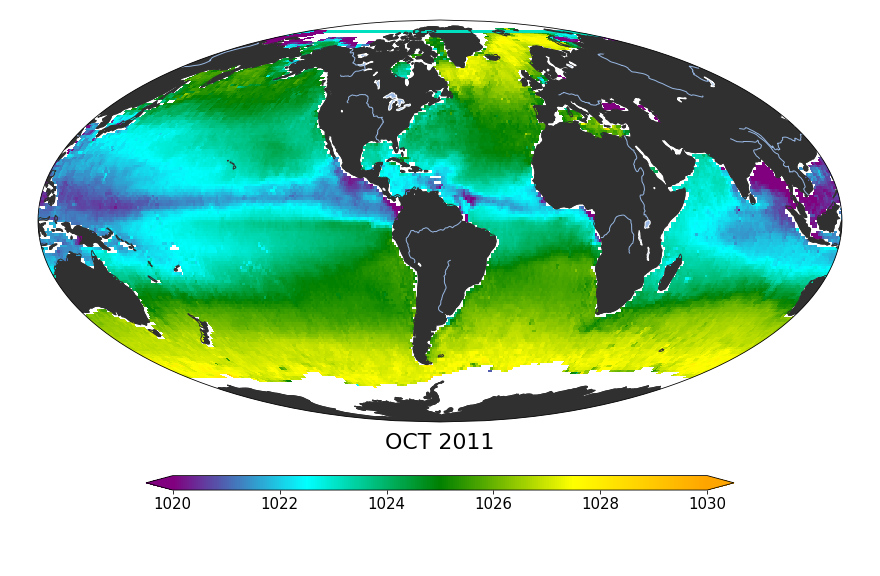
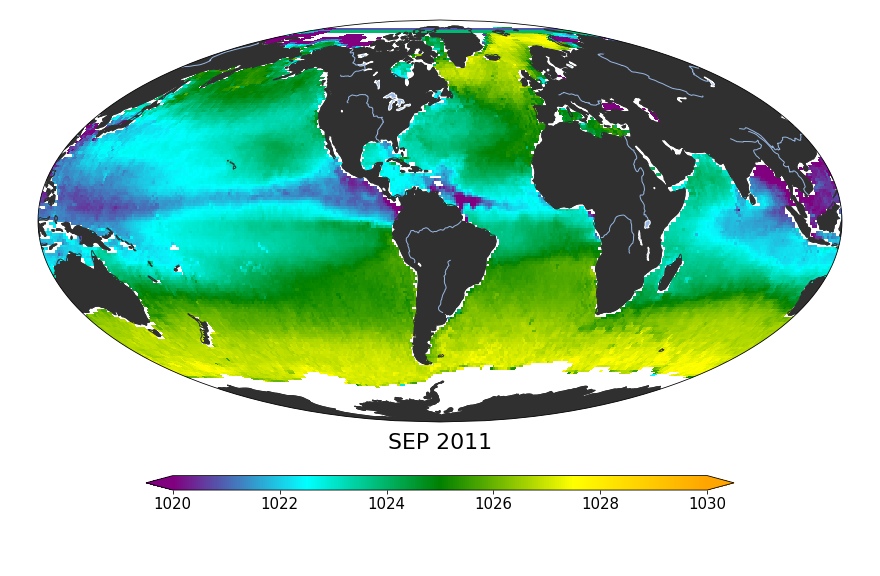
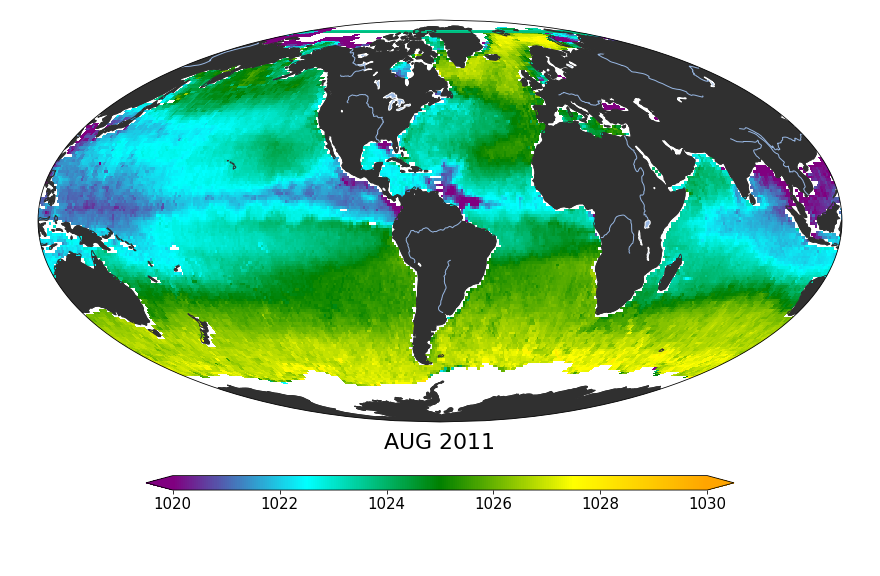
Monthly sea surface density map images, derived from Aquarius science products V5, are available here. These are produced from Aquarius sea surface salinity and ancillary sea surface temperature using TEOS-10 equation of state (McDougall and Barker, 2011). Click on the images (below) for a closer view.
In these maps, orange regions have higher density and purple regions have lower density (1030 to 1020 kilograms per cubic meter). Seawater density is determined by its temperature and salinity. Surface seawater temperature varies widely over the globe (-1°C to 30°C), while seawater's overall salinity range is relatively small (see monthly salinity maps).
The information on these maps is important because the density characteristics of a parcel of seawater are determined while it is at the sea surface. As water parcels sink and move through the ocean, their densities will be modified by mixing with other parcels of seawater. However, if the density signatures of all the end member water masses are known, this mixing can be "unraveled" to determine the proportions of their various source waters.