

- HOME
- SCIENCE
- HIGHLIGHTS
- DATA & MAPS
- DATA FOR YOU
- MEETINGS

A defining characteristic of ocean water is its high concentration of dissolved salts, or salinity. The resources on this page explore the nature of salt, the relationship between salt and water, and salt's effect on ocean chemistry.
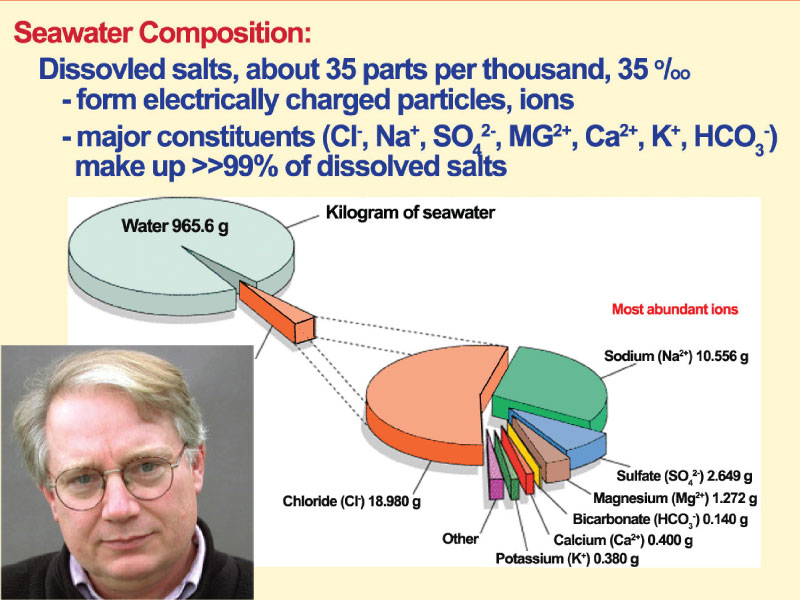
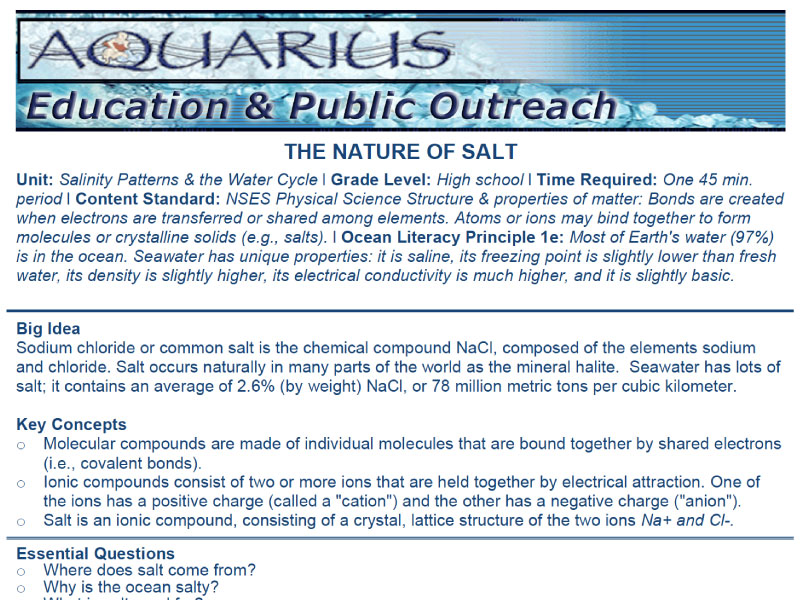
Probably more than you think. Some scientists estimate that the oceans contain as much as 50 quadrillion tons (50 million billion tons) of dissolved solids. If the salt in the sea could be removed and spread evenly over Earth's land surface it would form a layer more than 500 feet thick (152.4 meters), about the height of a 40-story building. Seawater is 220 times saltier than fresh lake water. Unrefined sea salt contains 98.0% sodium chloride and up to 2.0% other minerals (salts). Together there are over 100 minerals, composed of 80 chemical elements, in sea salt. The composition of a single crystal of ocean salt is so complicated that no laboratory in the world can produce it from its basic 80 chemical elements.
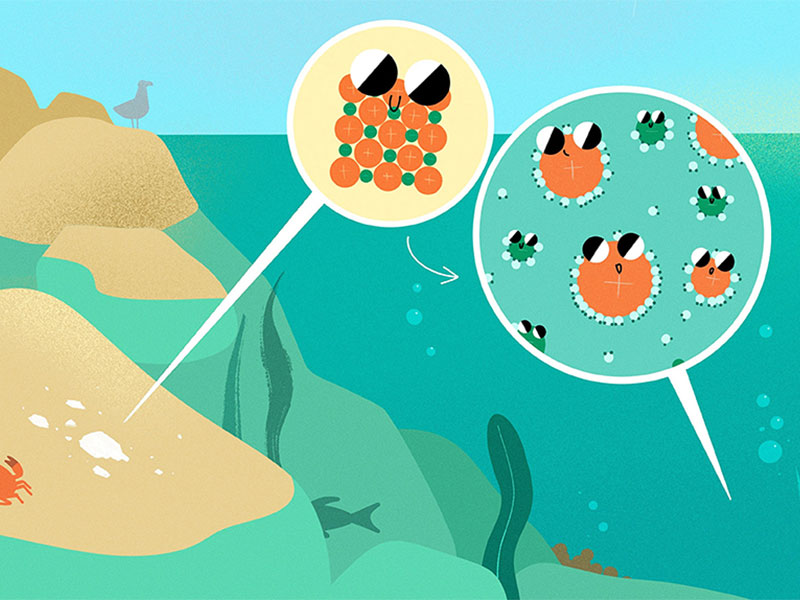
A defining characteristic of ocean water is its relatively high concentration of dissolved salts or salinity. Understanding why the sea is salty begins with knowing how water cycles among its physical states: liquid, vapor, and ice. As a liquid, water dissolves rocks and sediments, and reacts with emissions from volcanoes and hydrothermal vents: this creates a complex solution of mineral salts in our ocean basins. In other parts of the cycle, however, water and salt are incompatible: water vapor and ice are essentially salt free.
Through Earth's history, certain processes - including weathering of rocks, evaporation of ocean water, formation of sea ice - have served to make the ocean salty. These "salinity raising" factors are continually counterbalanced by processes that decrease salinity such as the continuous input of fresh water from rivers, precipitation of rain and snow, and melting of ice.
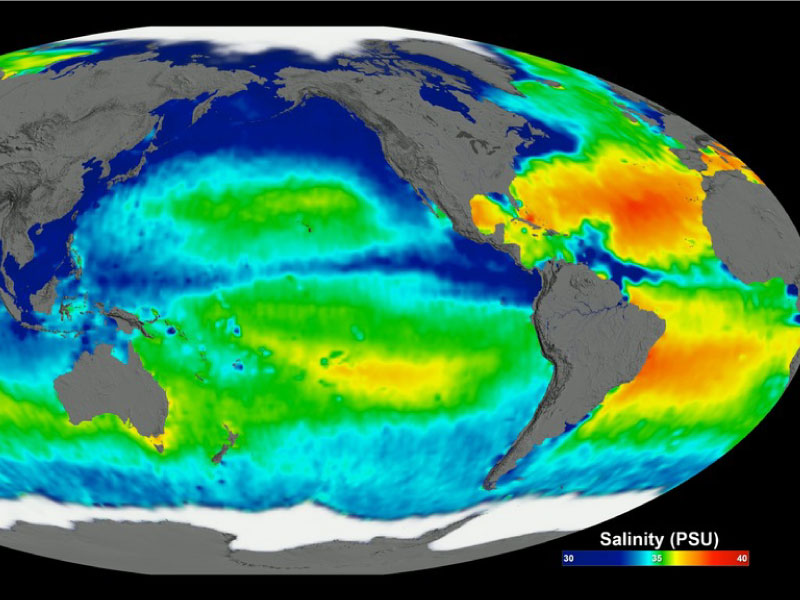
Seafarers through history have discovered that Sea Surface Salinity (SSS) varies from place-to-place: SSS in the open ocean generally ranges between 32 and 37 PSU (practical salinity unit), but may be much lower near fresh water sources or as high as 42 in the Red Sea. Between 300 and 600 AD, awareness of changes in salinity, temperature, and smell helped Polynesians explore the southern Pacific Ocean.
In the 1870s, scientists aboard H.M.S. Challenger, the scientific expedition that started modern oceanography, systematically measured salinity, temperature, and water density in the world's oceans. Over the years techniques for measuring such ocean water properties have changed drastically in method and accuracy. Aquarius was a NASA Earth Systems Science Pathfinder mission that provided a new type of SSS measurement through an innovative use of technology.
Although everyone knows that seawater is salty, few know that even small variations in SSS can have dramatic effects on the water cycle and ocean circulation. This is why long-term, accurate, global maps of SSS - such as those delivered by Aquarius (2011-2015) and the higher resolution SMAP satellite (active since 2015) - are crucial to climate studies. Learn more about NASA's SSS satellites here.
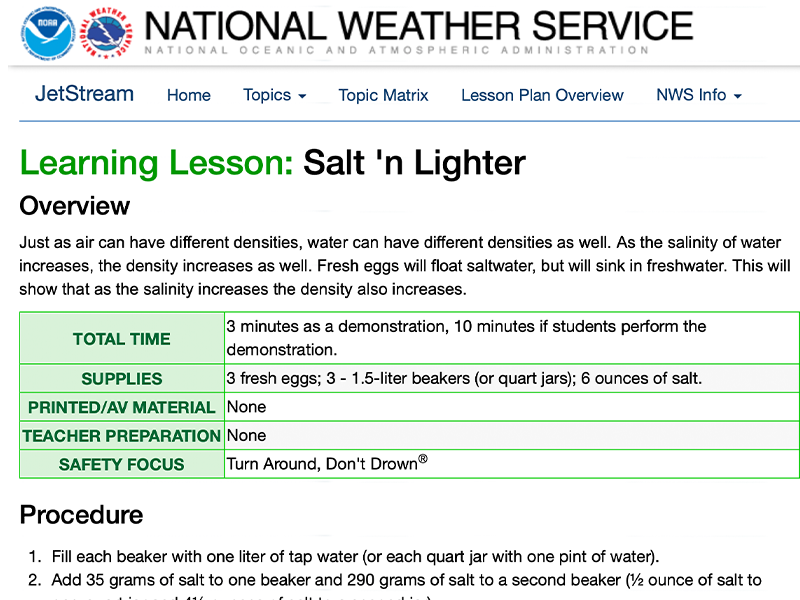
For a hands on activity exploring this topic, check out: Recovering Salts from Seawater.
Yes, there is a lot of salt in the ocean, but there is a lot more water. In ocean waters of average salt content (35 PSU), the weight of water is over 28.5 times greater than the weight of salt it contains. Oceanographers use the measure of salinity to describe the relative amount of salt to water.
No. Although the amount of salt in the ocean is relatively constant on time scales of years to decades, sea surface salinity (SSS) varies because freshwater input & output - part of the global hydrologic or water cycle - varies from place-to-place. The large scale pattern of evaporation and precipitation is established by Earth's atmospheric convection cells. In the simplest case - for example, if Earth were covered by oceans and not spinning - the atmosphere would move heat between the hot tropics and cold poles in a very simple way. Hot air would rise along the equator, creating a band of low atmospheric pressure. Cold air would sink at the poles, creating regions of high atmospheric pressure.
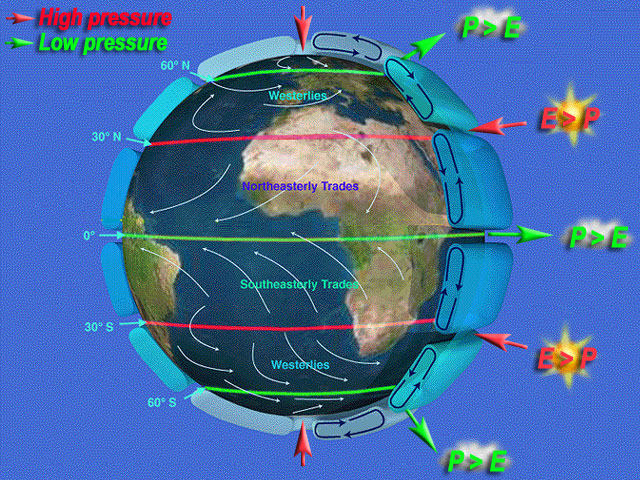
The presence of continents and Earth's rotation complicates the idealized "two cell" system. A fairly realistic model of Earth's atmospheric circulation consists of six cells: three on each side of the equator. This pattern has atmospheric pressure highs at the poles, 30°N and 30°S. It also has atmospheric lows along the equator, 60°N and 60°S. Away from the poles, cloudiness and precipitation (P) dominate bands of low pressure: these latitudes host the world's rainforests. Dryness and evaporation (E) dominate bands of high pressure: these latitudes are home to deserts.
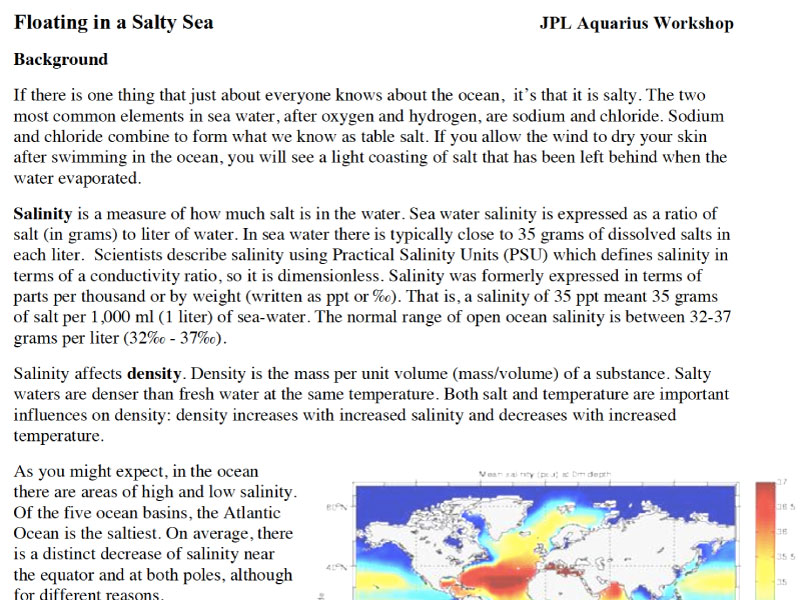
In terms of SSS, lower salinity generally occurs where precipitation is greater than evaporation (P>E). Higher SSS generally occurs where evaporation is greater than precipitation (E>P). Compare the "six cell" model with the map of global average SSS (image upper right). How well do SSS patterns mirror bands of high and low atmospheric pressure? In places where they do not match, what other types of freshwater inputs & outputs might be occurring?
Absolute salinity is defined as the concentration of dissolved salts in seawater, historically expressed in grams of salt per kilogram of seawater (g salt per 1000 g of water), also known as parts per thousand (ppt, or notated as 0/00). Determining salinity in traditional ways (e.g., titrating seawater) is very time consuming. Thus, salinity measurements were very sparse prior to the development of electronic sensors within oceanographic instruments. These instruments can be attached to moorings, floats, docks, and ship hulls, as well as deployed with cables overboard ships to measure salinity over great ocean depths.
Modern oceanography uses the Practical Salinity Scale (PSS) to derive salinity from measurement of the electrical conductivity, temperature, and pressure (related to depth) of a sample of seawater (usually measured in situ or in the water). Also used is the Practical Salinity Unit (PSU). Both PSS and PSU are roughly equal to parts per thousand (0/00).
With the advent of satellite-based salinity measurements, collected by the pioneering Aquarius satellite starting in 2011, and currently collected by the SMAP satellite since 2015, global ocean sea surface salinity (SSS) mapping is now possible (view the global data maps on our home page). In order to match up these different salinity data sets, many scientists and sensors were needed to intercalibrate satellite SSS measurements (a measurement of seawater brightness temperature) with ocean (in situ) SSS measurements. Now satellite-made SSS data can be reported reliably in units of PSU and 0/00 as well!


