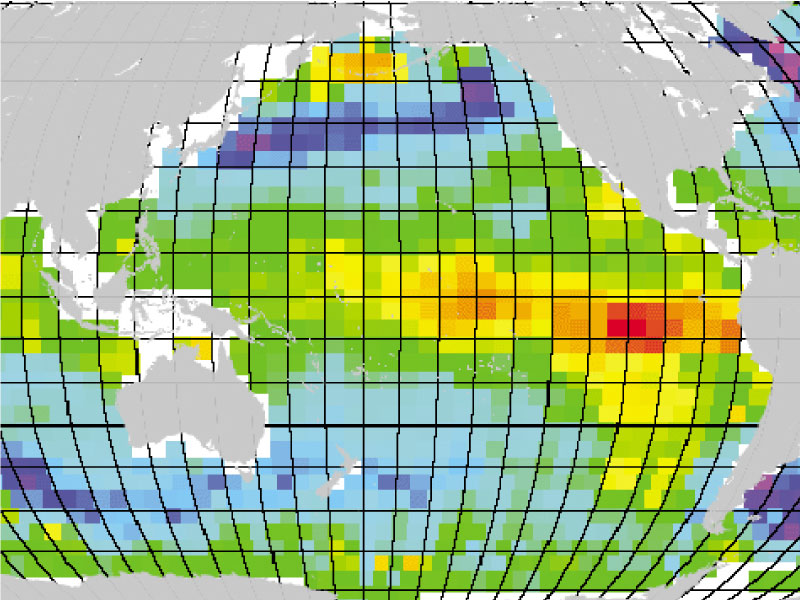
What have we learned about the SPURS site and what's next? The interdisciplinary cruise undertaken by SPURS scientists involved the coordination of an armada of technology - from in-water instruments to shipboard measurements to satellites in orbit around Earth. Dr. Bingham shows us the results of the team's research, including real data collected during the cruise.
Concept map developed for this webinar by Dr. Fred Bingham.
- Got Salt? NASA's Salt Mapper Toasts First Birthday [NASA JPL]
This interactive gives visitors a 'look under the hood' at the Aquarius spacecraft and a chance to meet some of the 'salt sleuths' on the Aquarius team
- NASA Earth Observatory's Experiments [NASA]
Interactive experiments to teach about the art and science of space-based remote sensing
- Ballast and Buoyancy [Undersea Museum]
Build your own ballast tank
- Eyes on Salinity [Maryland Department of Natural Resources]
Students will build a hydrometer and practice skills in measuring salinity in this activity about Chesapeake Bay
- What's a Water Column Profile? [NANOOS]
In this activity students explore the relationship between temperature, salinity and density in coastal marine waters
- How to Use CTD Data [NOAA]
Students use data from the Okeanos Explorer to create and interpret graphs of temperature, salinity, and depth
- A Matter of Density [NOAA]
Given CTD data, students will be able to calculate density and construct density profiles of a water column
- Adopt a Drifter Program [NOAA]
Adopt a buoy, tracker drifters, and access lesson plans for middle school, high school, and undergraduate students
- Ocean Observing With Gliders [Monterey Bay Aquarium Research Institute]
Students will investigate the movement of gliders by performing a simple simulation (Word document)
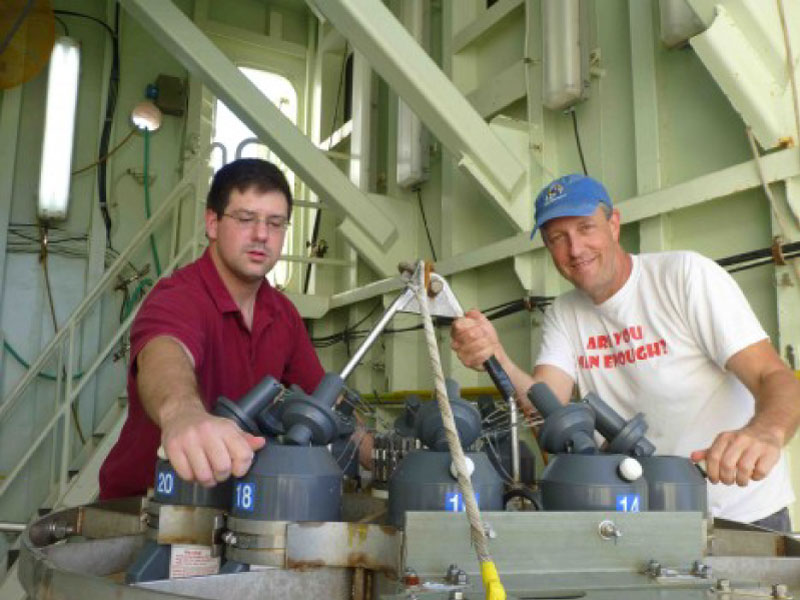
- How Science Data Are Collected [SPURS]
Answers to questions about how science data are collected, including information about platforms, technology, and the instruments used to make oceanographic measurements on the SPURS cruise
- Ocean Instruments [Woods Hole Oceanographic Institution]
How they work, what they do, and how they do it
- Instruments [Woods Hole Oceanographic Institution]
Information about sensors, samplers, moorings, buoys, floats, and drifters from Woods Hole Oceanographic Institution
- R/V Atlantis [Woods Hole Oceanographic Institution]
Winches and wire, cranes and overside handling, boats, scientific instrumentation, navigational equipment, and the SeaBeam - necessary items for a successful cruise
- Then and Now: The HMS Challenger Expedition and the "Mountains in the Sea" Expedition [NOAA]
A comparison of modern-day exploration with the late 19-century journey of the HMS Challenger illustrates the progress that science has made in ocean exploration
- Exploring the Ocean Surface with Data from the Global Drifter Program [NSDL]
Access buoy data from the Global Drifter Program
- Education: Student Outcomes [NASA Aquarius]
Twenty three student outcomes, addressed by Aquarius EPO materials and aligned with National Science Education Standards, North American Association for Environmental Education standards, and Ocean Literacy standards
Presented by Dr. Fred Bingham – March 12, 2013
is a Professor in the Department of Physics and Physical Oceanography at the University of North Carolina at Wilmington.
His research interests include global distributions of sea surface salinity and large scale regional physical oceanography - the Kuroshio, the western North and Equatorial Pacific, and Onslow Bay, North Carolina.