This 2018 publication evaluates four popular sea surface salinity (SSS) datasets in the Gulf of Mexico (GoM) to characterize the differences among the products and also versus in-water observations. The analysis includes three products from NASA's Soil Moisture Active Passive (SMAP) mission: two processed by Remote Sensing Systems (RSS) with different spatial resolutions and another from the Jet Propulsion Laboratory (JPL). The fourth product evaluated is from the European Space Agency's Soil Moisture Ocean Salinity (SMOS) mission.
| SMOS | SMAP | |||
|---|---|---|---|---|
| Data product used in study | Debiased Version 3 (LOCEAN) | Version 2 – RSS (native) | Version 2 – RSS (smoothed) | Version 4.0 – JPL (smoothed) |
| Spatial resolution | ~60 km | ~40 km | ~70 km | ~60 km |
| Comments | "Debiased" data products employ methodologies to mitigate systematic errors including land-sea emissivity contrasts, which have improved data product quality over time. | The difference between the 40-km and 70-km products is based on the smoothing: 40 km is the native resolution of SMAP SSS data and 70-km data are smoothed. The 70-km smoothing is applied to the Level-2 (swath) data. These values are then gridded onto the same 0.25° x 0.25° grid as the 40-km data. | 60-km resolution investigator-led product (also known as "CAP"). Primary differences between this and RSS products relates to different approaches to land contamination and data smoothing radius. | |
Over the open ocean, there is typically small variation among these sea surface salinity (SSS) products. However, the Gulf of Mexico (GoM) presents an opportunity to evaluate these products in a region with large SSS variability due to river discharge and regional circulation (e.g., eddies associated with the Loop Current).
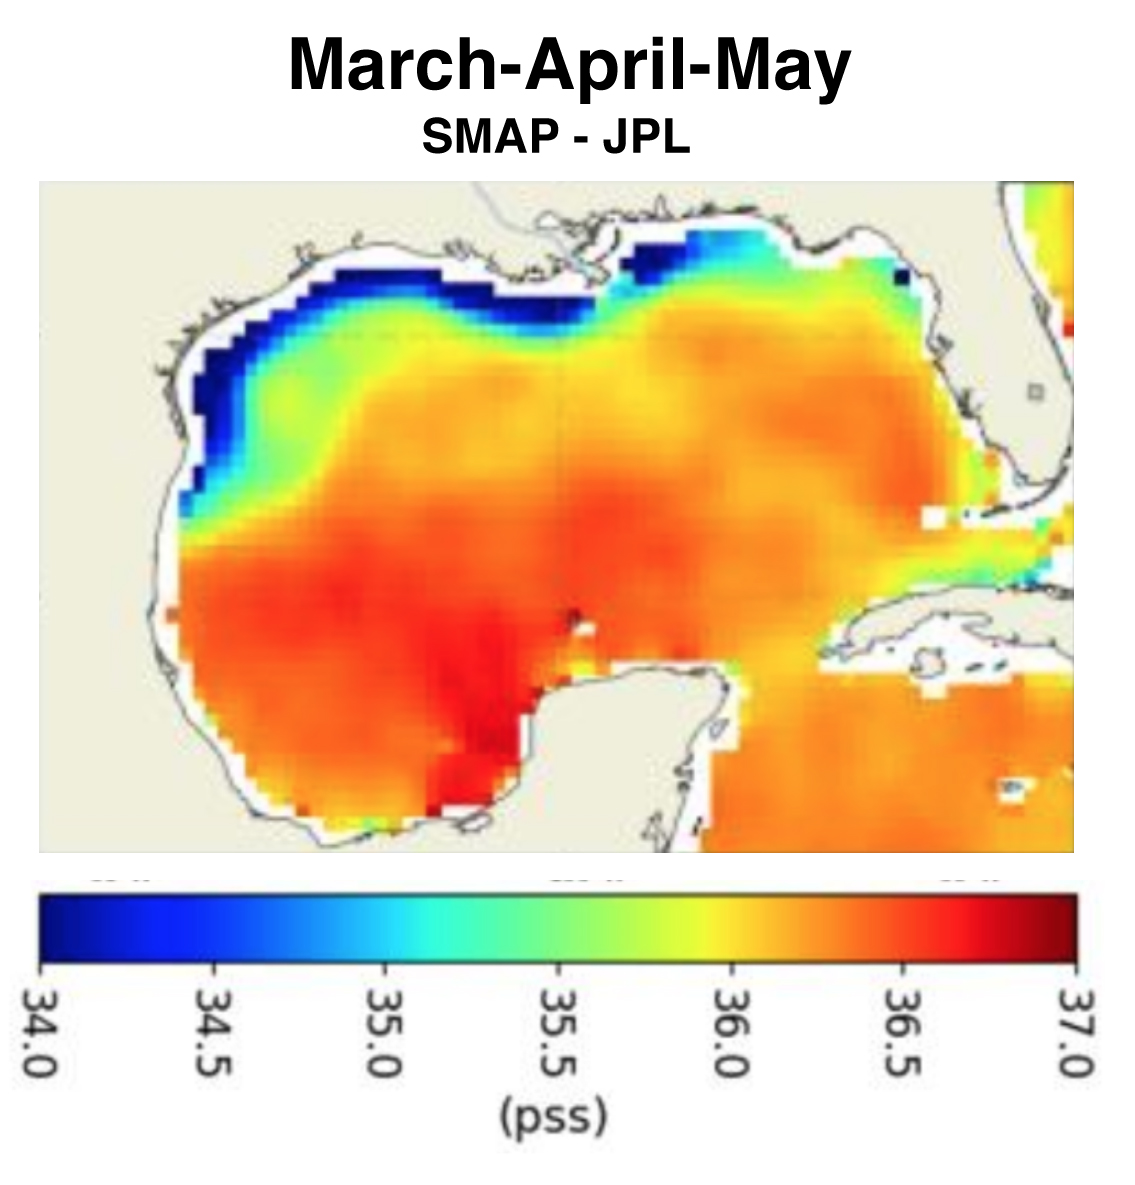
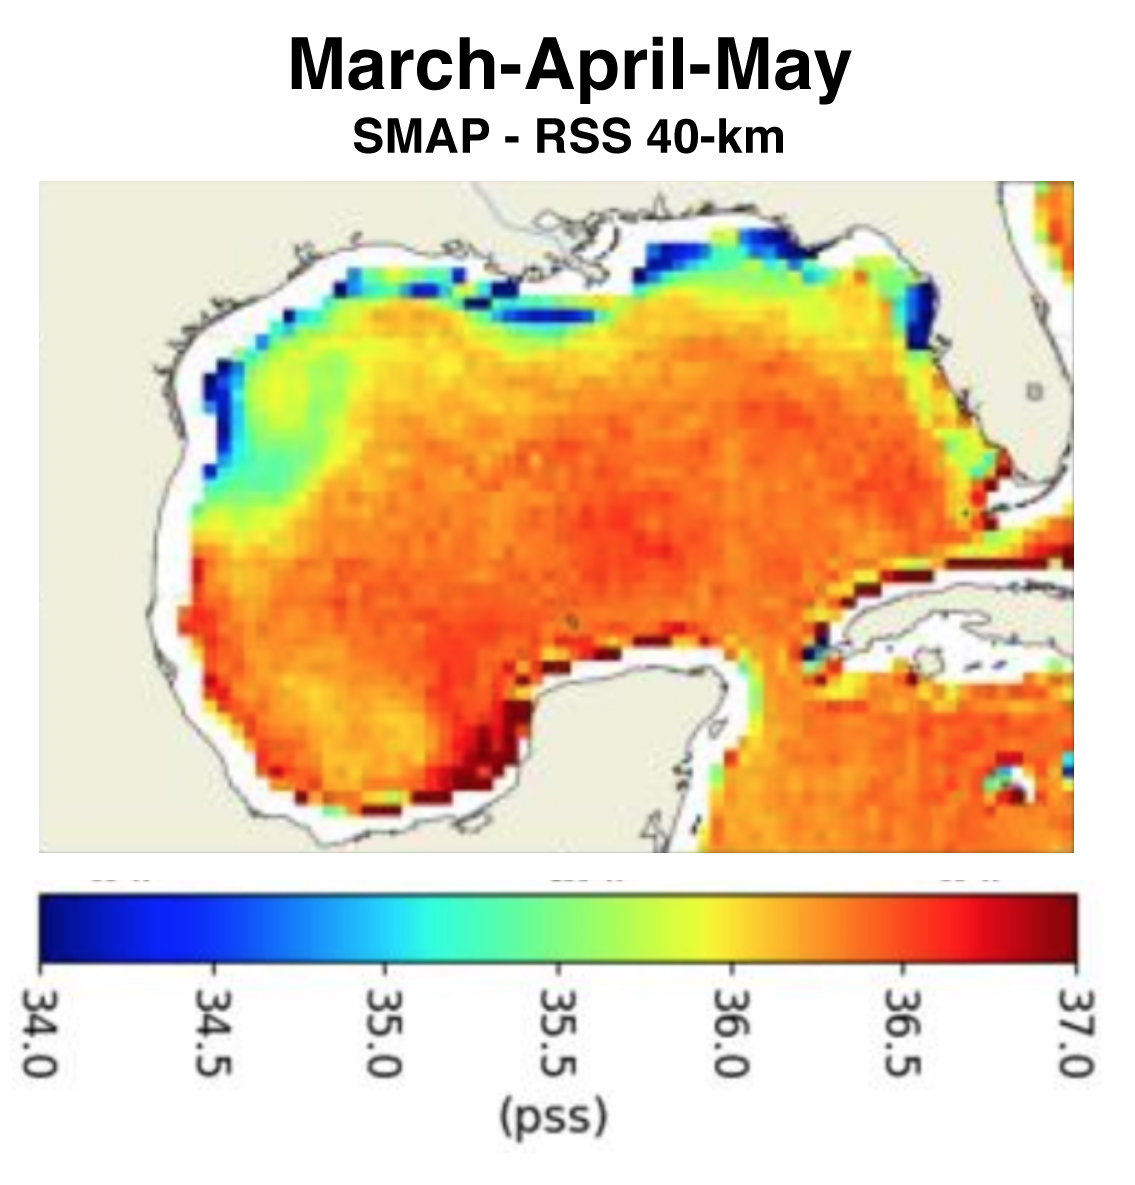
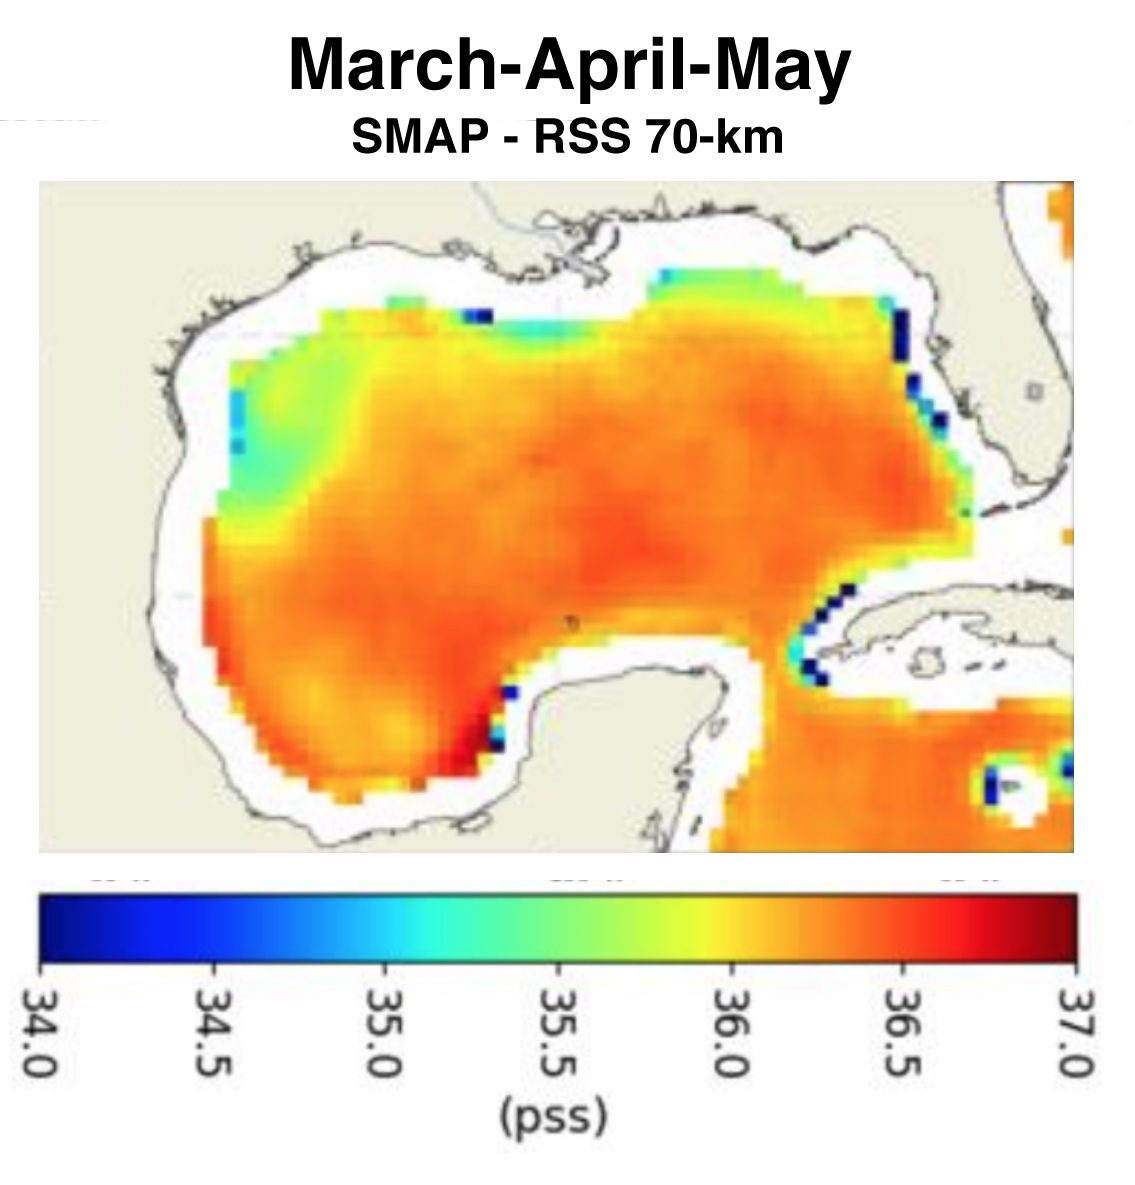
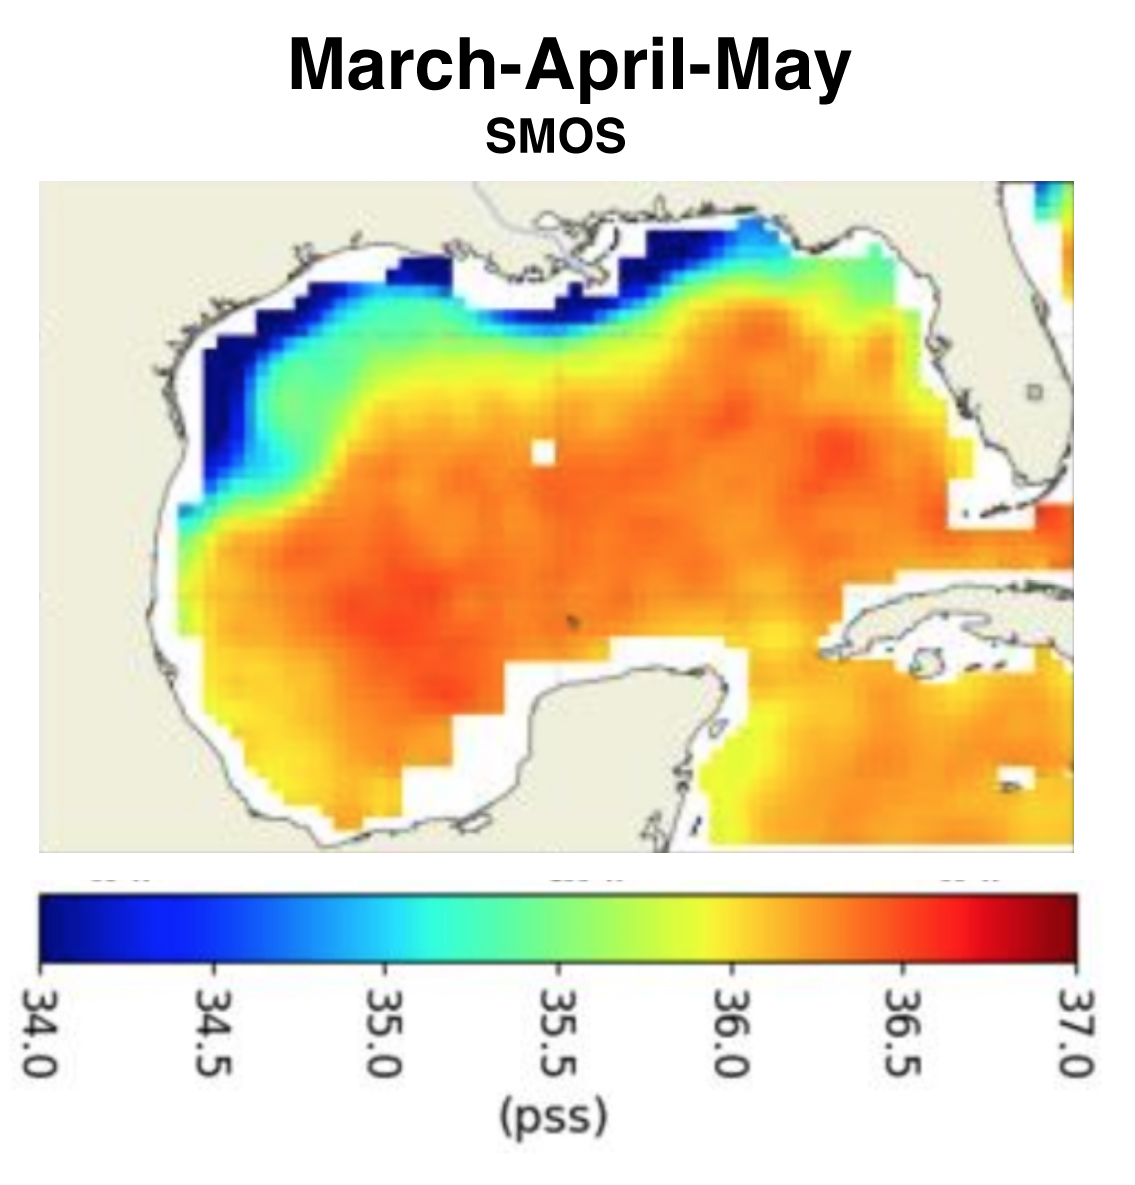
When averaged over the GoM, the four products show excellent consistency in capturing seasonal variations. They also consistently identify regions with strong SSS variability over time such as those associated with river plume discharge. Figure 1 shows an example of the data from the northern hemisphere spring months (i.e., March, April, May).
The GoM is a semi-enclosed basin, thus "land contamination" is a key consideration since it impacts the quality and coverage of SSS measurements. Differences among the products are related to varying spatial resolutions (see table). This can be seen in white areas along the coasts, indicating a lack of SSS retrievals due to land contamination (see Fig. 1).
The availability of in-water data is uneven in the GoM, as shown in a density plot of observations (purple colors in Fig. 2) from the World Ocean Database (WOD) from April 2015 to December 2017. So, the study team focused on comparing of satellite SSS with in-water salinity measurements from buoys (colored markers C10, C13, etc.).
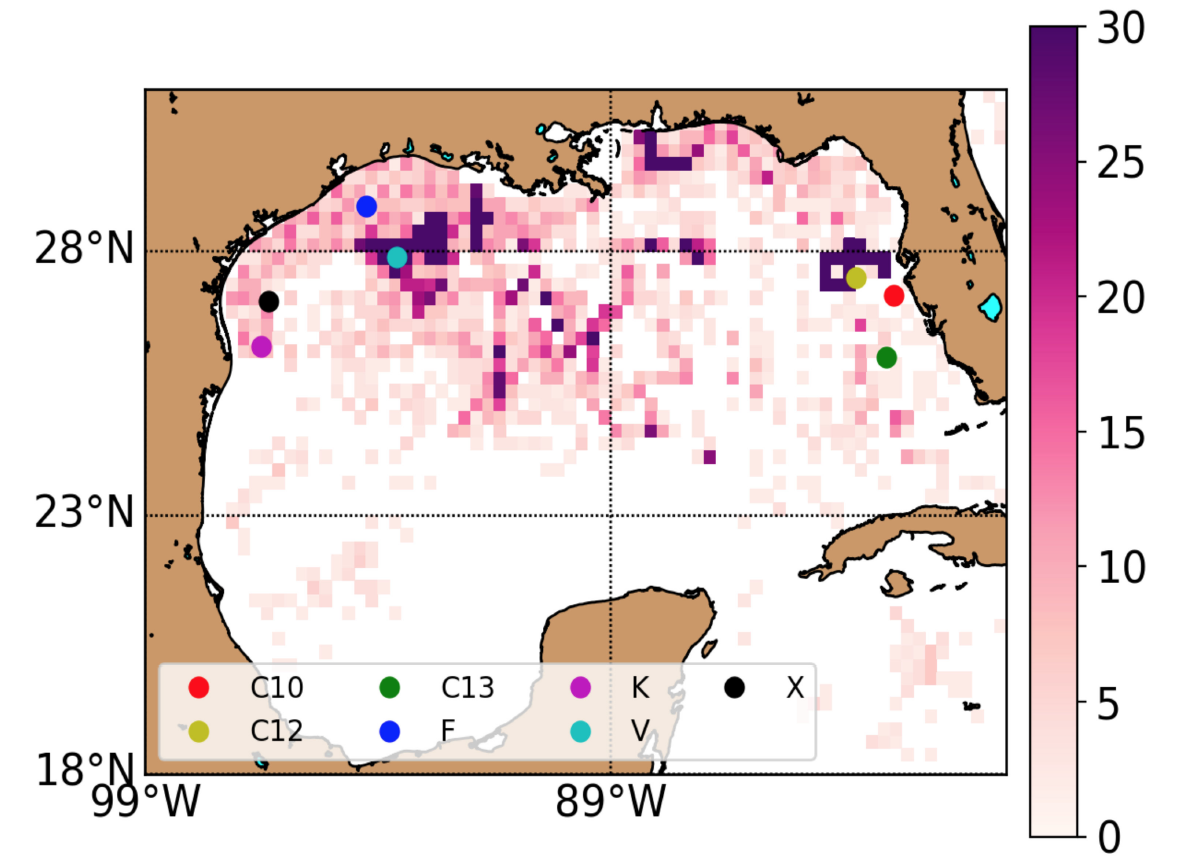
With respect to in-water data, most of the satellite SSS products are comparable overall – independent of distance from the coast. On the other hand, the SMAP Version 2 RSS 70-km performed relatively poorly within 100 km of the coast.
Yes, in a sense — and it's a positive result — I was surprised that, overall, the seasonal cycles in all of the SSS data sets were reproduced pretty much the same. In other words, they compare very well. Also, you see the discharges of the rivers, they too compare very well. The only part which might have been a little surprising — but in a sense not unexpected — was that as you got closer to land these data sets all had different answers.
In general, Argo profiling floats serve as open-water sources for validation and the Gulf of Mexico is a semi-enclosed basin. The Gulf does have in-situ data that is collected by NOAA (i.e., World Ocean Database). Also, one of the interesting things is that we were fortunate in a sense because there has been an "explosion" of data in the Gulf of Mexico since the Deepwater Horizon oil spill. This study definitely took advantage of being able to get that in-situ data (in the absence of Argo) to do very good statistical comparisons.
Number one: We have to improve SSS data closer to land! A major area of study today is Earth's water cycle. The water cycle depends on what happens between the land and the ocean (i.e., the land-ocean connection). That means it depends a lot on what happens between river discharge, the ocean, and connections with the atmosphere.
The Gulf of Mexico is an enclosed basin. So, it's going to have a lot of evaporation associated with it as well as currents. So, it's a perfect study in terms of understanding the land-ocean connection and Earth's water cycle. The Gulf is also fed by one of the largest river systems in the world: the Mississippi. But we need to improve the SSS data sets as they get closer to land. That's obvious from this study... the differences among all of these data sets when you get closer than 100 km from land.
One of my dreams is to be able to see comparisons between all of these salinity data sets showing small differences when you get closer to land. In other words, really be able to use SSS for studying the Mississippi discharge. And also see discharge from rivers such as those in the Yucatán. There are so many rivers that discharge into the Gulf. Understanding how such relationships change salinity near the coast – and also impact Earth's water cycle – is critical.
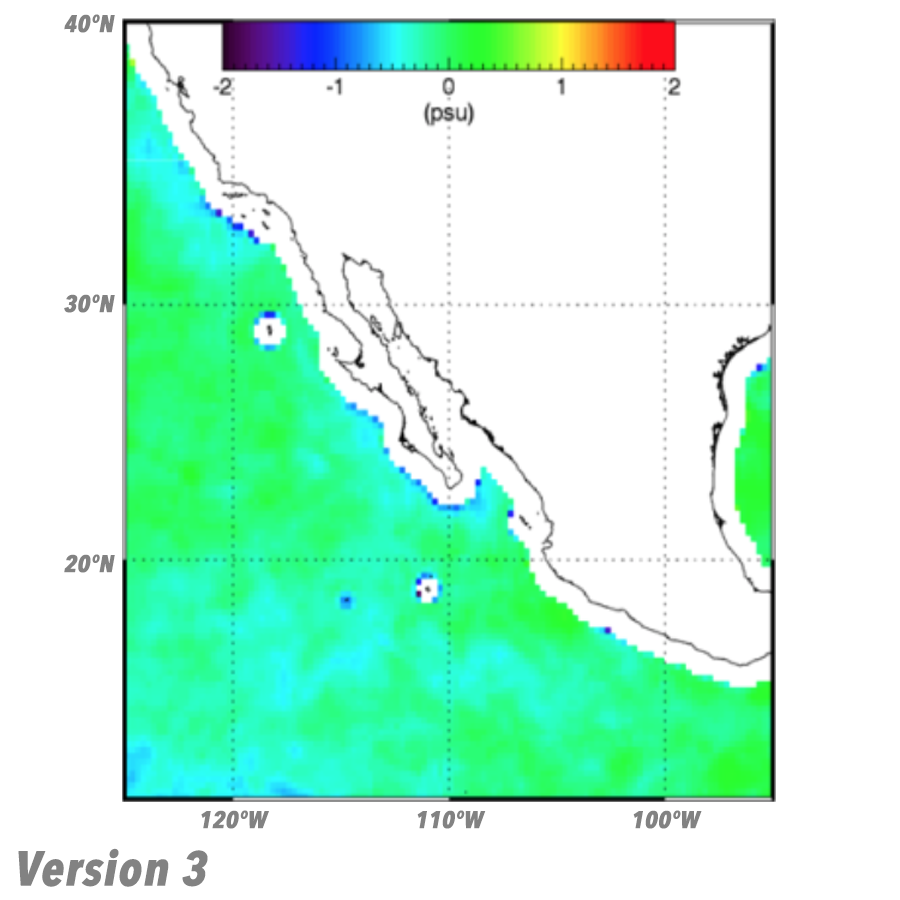
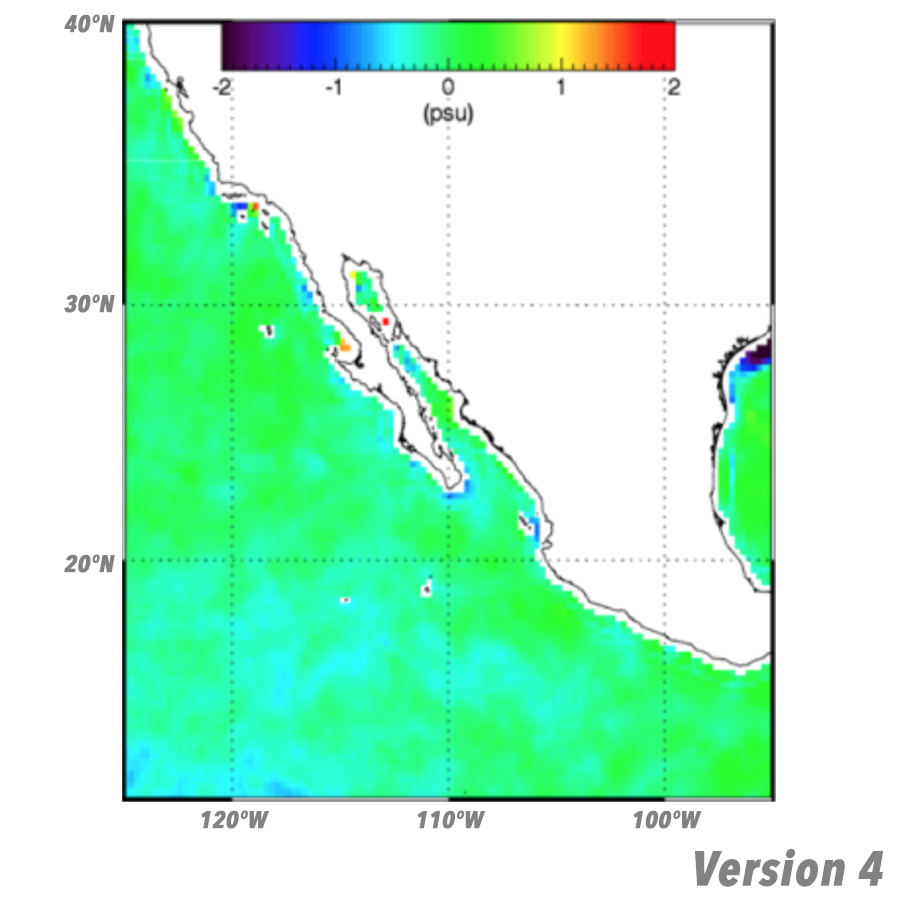
Results from this publication prompted us to follow up this study with a new project off Baja and the California coast, a major upwelling system associated with the California Current system. It shows that the newer RSS versions of SMAP data (e.g., Version 4) provide much better results closer to land (Figure 3). I'm hoping that somebody will do a new Gulf of Mexico study using newer versions of SSS data. We haven't done it, but from what we've seen in other applications such as along the Baja and California, we've definitely seen improved comparisons with in-situ data and the newer versions of SSS data.
I think it's absolutely critical to include SMOS data in comparative salinity studies. SSS and in-situ comparisons are showing very encouraging results in the Mediterranean. The Mediterranean has a lot of river systems associated with it, such as the Nile. So, yes, we should keep including SMOS in these types of comparisons. From what we're seeing, newer SMOS data products can also really improve the SSS retrievals close to land.
Yes, absolutely. What we're looking at is Earth's water cycle, understanding how it's changing with climate. This is one of the biggest questions for Earth science. So, improving those data sets will help improve climate models, which will improve predictions along with our basic understanding of the water cycle.
John and I were asked to give a webinar for Earth Science Week about hydrology connections. We didn't even know each other at that point. But we were both interested in a flooding event near the Gulf of Mexico from different perspectives. John was a hydrologist and I had experience in oceanography remote sensing. After the webinar, there was a NASA research opportunity. John and I asked ourselves: Why don't we try to submit a proposal? We called it "the land-ocean connection." The proposal was funded and that's how we started working with Severine Fournier. And, as they say, the rest is history.
A new mission, Surface Water and Ocean Topography (SWOT), is going to be incredible in terms of land-ocean connections. It is going to tell us the amount of discharge that rivers are putting into the ocean. SWOT will address a multi-disciplinary problem: you have the land connecting to the ocean, and you have oceans connecting to the atmosphere. That's much like how John and I worked together: He brought the hydrology perspective and I brought the oceanography perspective. We have both realized that combining our knowledge is exactly what is needed for this kind of a problem.
Well, I think the users can tell from our paper that because there's a lot of data in the Gulf of Mexico from the World Ocean Database, we actually can plot the errors in the SSS datasets as you get closer and closer to land. You can see the errors in the RSS SMAP data product, you can compare with the JPL SMAP data product, and you can compare with the SMOS data product. The statistics are all there. Users can very easily see which data set(s) would work well for their particular application. Again, the statistics are there. We aren't telling users "this is the best data product." Rather, we are providing information that they can assess for themselves. I think the Gulf of Mexico study was very valuable in terms of comparing SSS with in-situ data. We were fortunate to have so much in-situ data in the Gulf of Mexico that we were able to do this very nice validation study. For several data sets, we were able to determine: this is what the errors look like in the middle of the Gulf and characterize the errors as you get closer to the coast. So, users can refer to our plots and determine which data set(s) they want to use.
I encourage users to really understand the data for their own applications. Also, to be aware of data release versions... especially with respect to when your manuscript is submitted and published!