Highlights

Seasons of Salinity

  • We observe seasons all around us. The ocean also has seasons!
    We observe seasons all around us – flowering spring, hot summer, colorful fall, cold winter. The ocean also has seasons!
  • We also see seasonal change in ocean salinity.
    Not only do we see seasonal change in ocean temperature and phytoplankton blooms, but also in ocean salinity.
  • Seasonal salinity changes are caused by evaporation and precipitation cycles.
    Seasonal changes in salinity are caused by cycles in evaporation and precipitation that change with the global water cycle.
  • Salinity seasonality can be caused by inputs of freshwater.
    Salinity seasonality can be caused by inputs of freshwater into the ocean, particularly large rivers.
  • Variations can also be caused by seasonal changes in sea ice and melting.
    Variations in salinity can also be caused by seasonal changes in sea ice and the melting of ice on land.
 «» 
1 2 3 4 5 6

"To everything (turn, turn, turn) there is a season (turn turn turn)" – The Byrds

We observe the seasons around us. You may experience long winters and mild summers or mild winters and hot/humid summers. Or perhaps you live in the tropics where temperatures are relatively constant but the seasons are "wet" and "dry."

Salinity in our ocean also has seasonal patterns. It generally rises and falls in one cycle per year. In other words, most places have annual high and low salinities. When it comes to salinity, tropical areas have the largest seasonal cycle of salinity. These patterns are unlike ocean temperature, where mid-latitude areas show the greatest variation throughout the year.

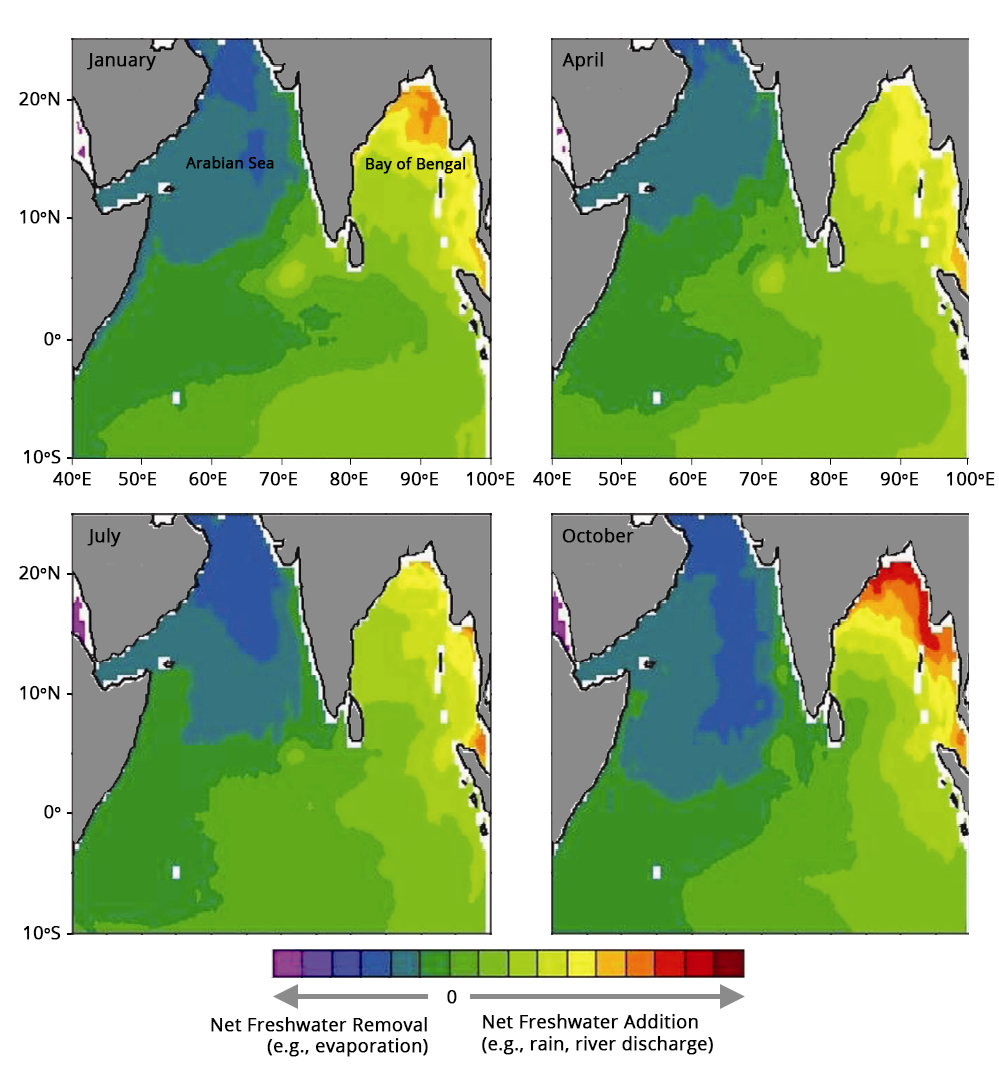
What causes salinity to change during the year? It is not about adding or removing salt from ocean basins, it's about adding or removing freshwater. The primary ways that freshwater is removed from the ocean are evaporation or the freezing of seawater (i.e., making sea ice). On the other hand, freshwater is added to the ocean by precipitation, ice melt, and river runoff. So, changes in ocean salinity are tied to the global water cycle... which is, of course, seasonal.

Map
These composite maps show global sea surface salinity averaged by season. Data are from the Aquarius satellite mission. More information on these maps and their data can be found here.

Related Publications

  • Lu, X., Hu, S., Guan, C., Li, M., Sprintall, J., and Wang. F. (2023). Quantifying the Contribution of Salinity Effect to the Seasonal Variability of the Makassar Strait Throughflow, Geophys. Res. Lett., 50(21), e2023GL105991, doi: 10.1029/2023GL105991.
  • Chen, Y., Xiao, C., Zhang, Y., and Lai, Z. (2023). The Mixed Layer Salinity Budget in the Northern South China Sea: A Modeling Study, J. Mar. Sci. Eng., 11(9), 1693, doi: 10.3390/jmse11091693.
  • Jofia, J., Girishkumar, M., Ashin, K., Sureshkumar, N., Shivaprasad, S. and Pattabhi Ram Rao, E. (2023). Mixed Layer Temperature Budget in the Arabian Sea During Winter 2019 and Spring 2019: The Role of Diapycnal Heat Flux, J. Geophys. Res. Oceans, 128(2), e2022JC019088, doi: 10.1029/2022JC019088.
  • Hall, S., Subrahmanyam, B. and Steele, M. (2023). The Role of the Russian Shelf in Seasonal and Interannual Variability of Arctic Sea Surface Salinity and Freshwater Content, J. Geophys. Res. Oceans, 128 (1), e2022JC019247, doi: 10.1029/2022JC019247.
  • Varna, M., Jithina, A. and Francis, P. (2023). Characteristics and Dynamics of Mesoscale Eddies in the Eastern Arabian Sea, Deep Sea Res. Part II Top. Stud. Oceanogr., 207, 105218, doi: 10.1016/j.dsr2.2022.105218.
  • Li, W., Wang, Z. and Huang, H. (2022). Seasonal and Intra-seasonal Variations of Surface Hydrological Parameters over North Yellow Sea and its Implications for Applicability of Quasi-synchronous Ship-based Multi-station Hydrological Investigation Data, J. Sea Res., 190, 102310, doi: 10.1016/j.seares.2022.102310.
  • Katsura, S., Sprintall, J., Farrar, J.T., Zhang, D. and Cronin, M.F. (2022). The Barrier Layer Effect on the Heat and Freshwater Balance from Moored Observations in the Eastern Pacific Fresh Pool, J. Phys. Oceanogr., 52 (8), 1705-1730, doi: 10.1175/JPO-D-21-0243.1.
  • Nyadjro, E.S., Foli, B.A.K., Agyekum, K.A., Wiafe, G., and Tsei, S. (2022). Seasonal Variability of Sea Surface Salinity in the NW Gulf of Guinea from SMAP Satellite, Remote Sens. Earth Syst. Sci., 5, 83-94, doi.10.1007/s41976-021-00061-2.
To view all salinity publications, visit the publications page.
Time scales over which salinity varies with seasons Time scales over which salinity varies without seasons
Maps showing the time scales over which salinity varies across the global ocean. Values are presented as decorrelation time scales in days. Left: Full data set. Note that most of the ocean has a seasonal time scale of about 90 days (medium blue). Right: Same data but with the seasonal cycle removed. High latitudes vary on short time scales (dark blue) due to precipitation events. Near the equator, variation is at longer time scales (red) due to El Niño/La Niña events. Credit: Bingham and Lee (2017).

Featured Publications

Heavy rain over the ocean

This paper sought to capture the dominant harmonic patterns of seasonal variations of sea surface salinity (SSS) in the ocean. To address these questions, 2016-2018 data from four satellites were examined and compared to two in situ data sets (Argo and EN4) and the longer term World Ocean Atlas. Globally, the ocean had a strong annual harmonic - a defined cycle with one one salinity maximum and minimum during the year. Seminannual harmonics (i.e., two maximums and two minimums per year) were important in specific areas with unique weather patterns, namely monsoon regions and major rivers.

Summary of the mean, standard deviation (bold-face numbers), and the seasonal ranges (light-face numbers) in key ocean regions. Click on the image to enlarge. Credit: Yu, et al (2021).

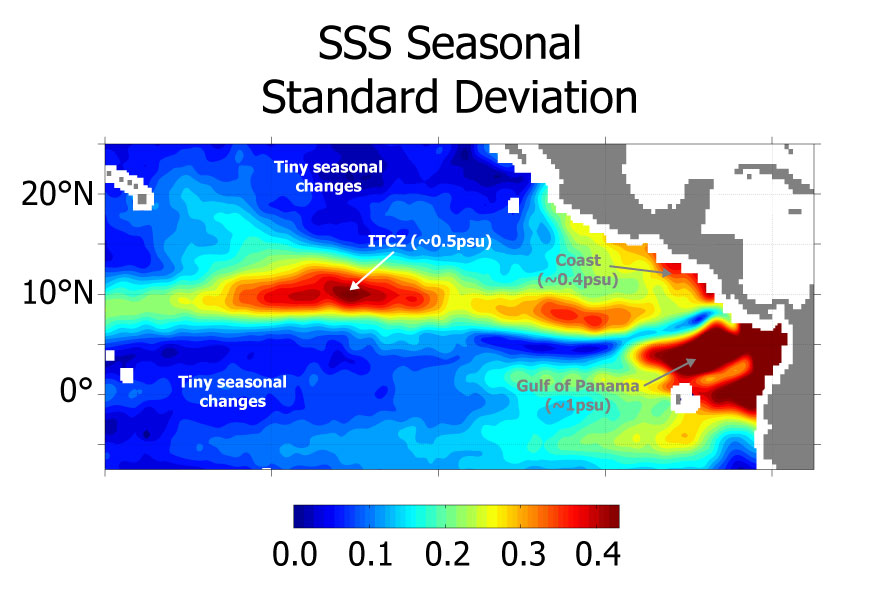
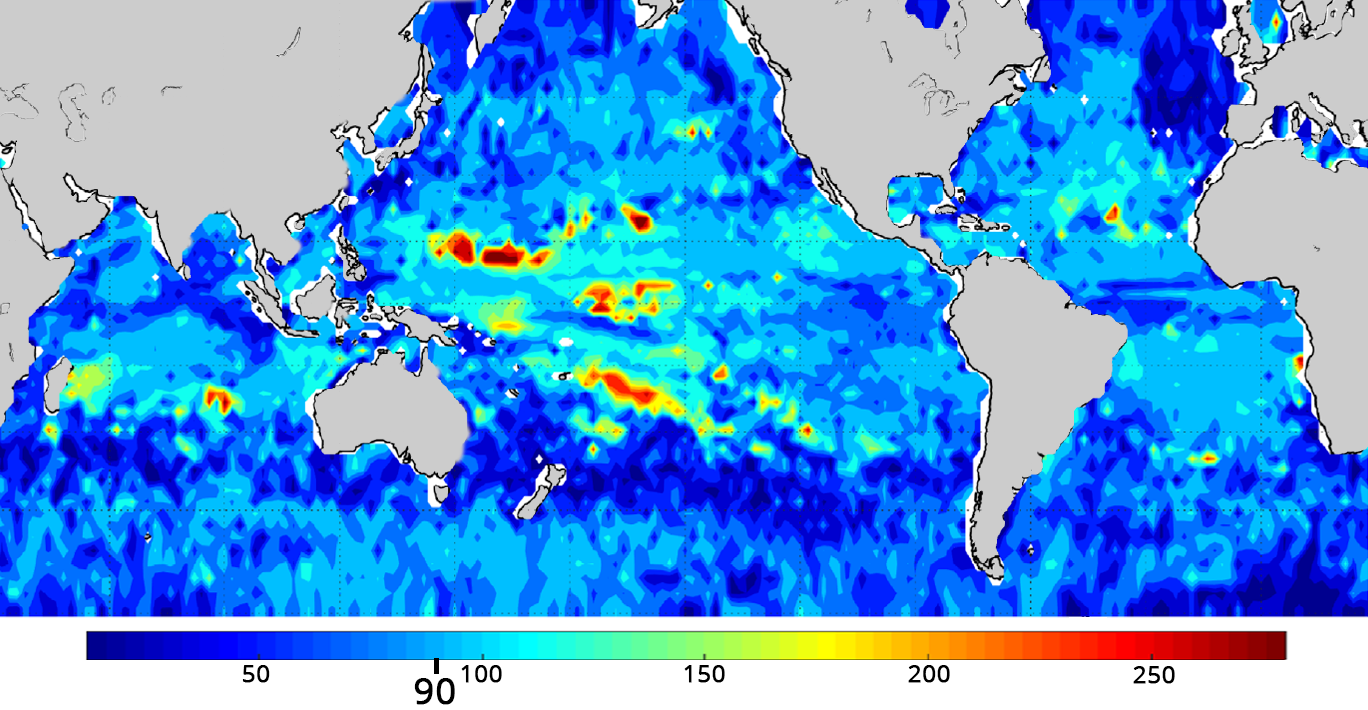
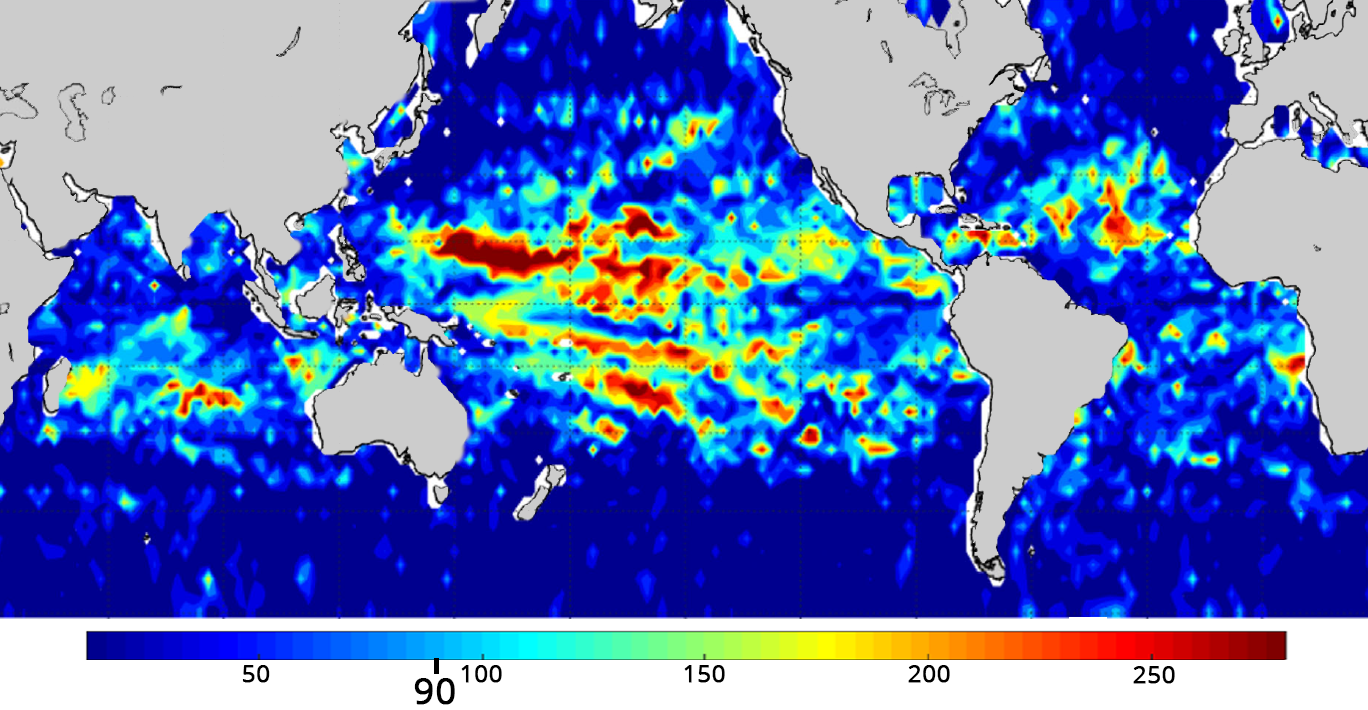
Most of the global ocean had an annual cycle of SSS less than 0.3 practical salinity scale. Areas with the greatest annual fluctuation in salinity were the tropical Atlantic and the Pacific in the Inter-Tropical Convergence Zone, the South Pacific Convergence Zone, and the northern North Atlantic with its seasonal ice melt. In general, areas with the greatest fluctuations were those influenced by freshwater sources - rainfall, river discharge, ice melt.

Reference

Yu, L., Bingham, F.M., Lee, T., Dinnat, E.P., Fournier, S., Melnichenko, O., Tang, W., and Yueh, S.H. (2021). View the full paper.

NOAA mooring at sunset

While Yu et al. (2021) focused on global, basin-scale sea surface salinity (SSS) over three years compared to the World Ocean Atlas, this article took the approach of examining the full 9 year satellite SSS data set and comparing it to the Global Tropical Moored Buoy Array at the level of individual moorings. The end results were similar, providing further support that satellites are able to observe the seasonal cycle of SSS and that we have a good understanding of the dynamics of that seasonal cycle.

This map shows mooring locations in the Pacific Ocean. The size of each dot – whose scale is at top in blue – indicates how much satellite-derived salinity varies across the seasons (amplitude). Dot colors indicate the time of maximum salinity (phase) per the color scale at bottom (1 = January, 2 = February, etc.) Credit: Bingham, et al (2021). Click on the image to see data from other ocean basins.

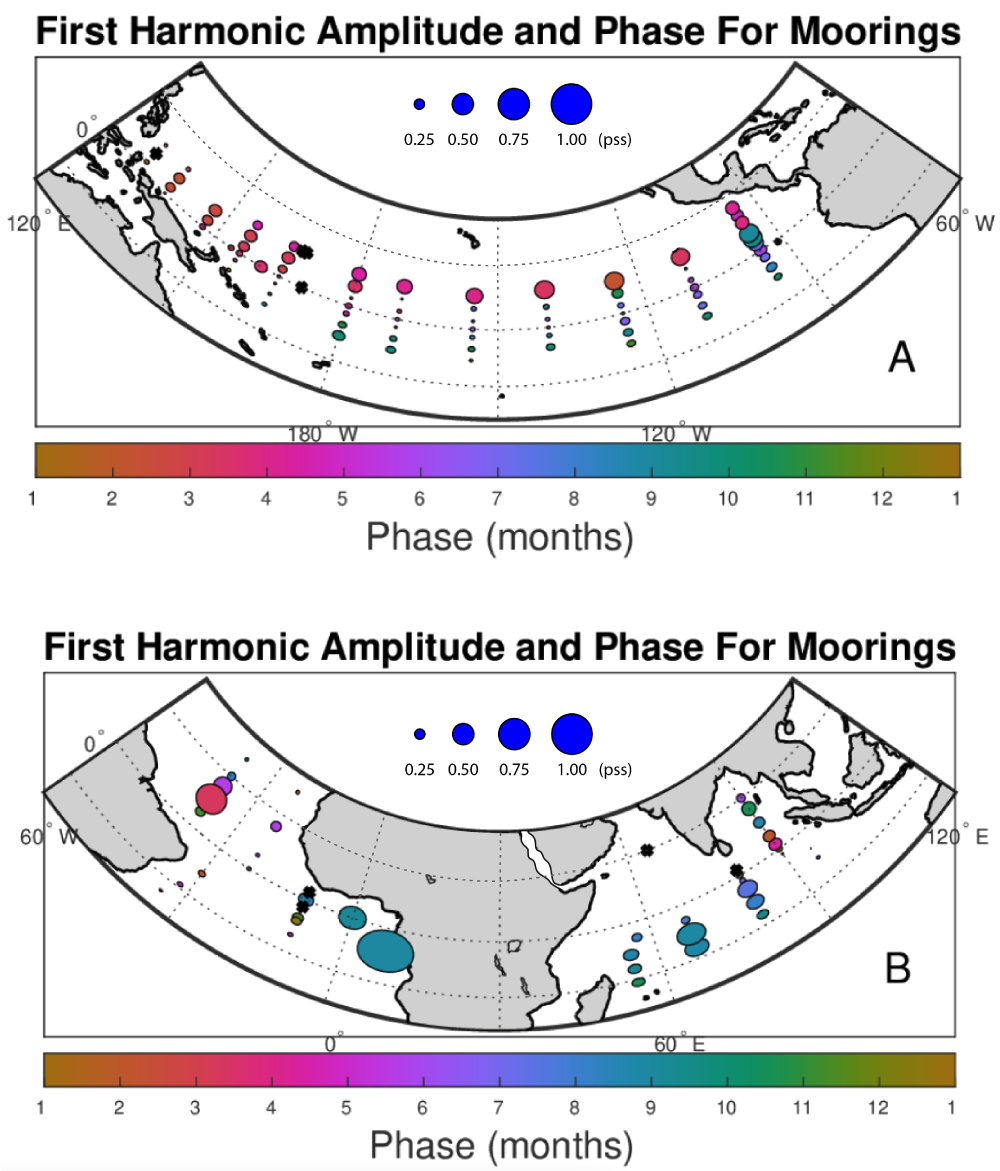
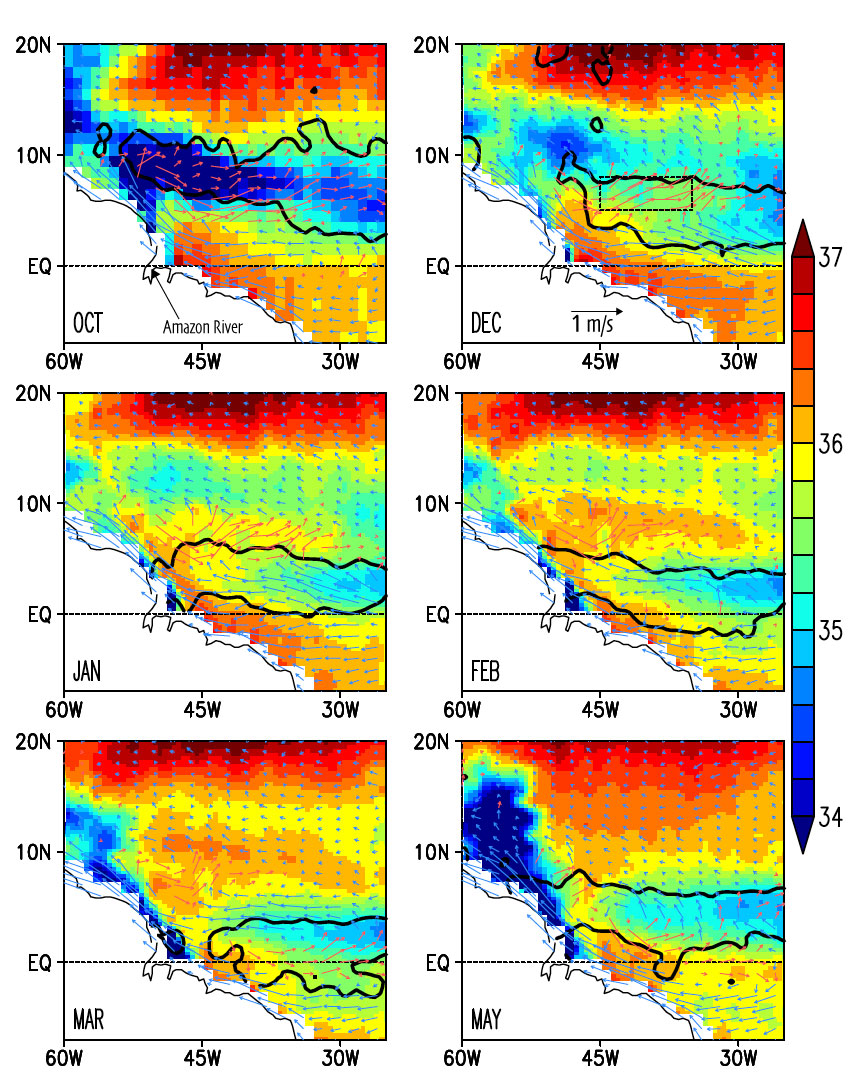
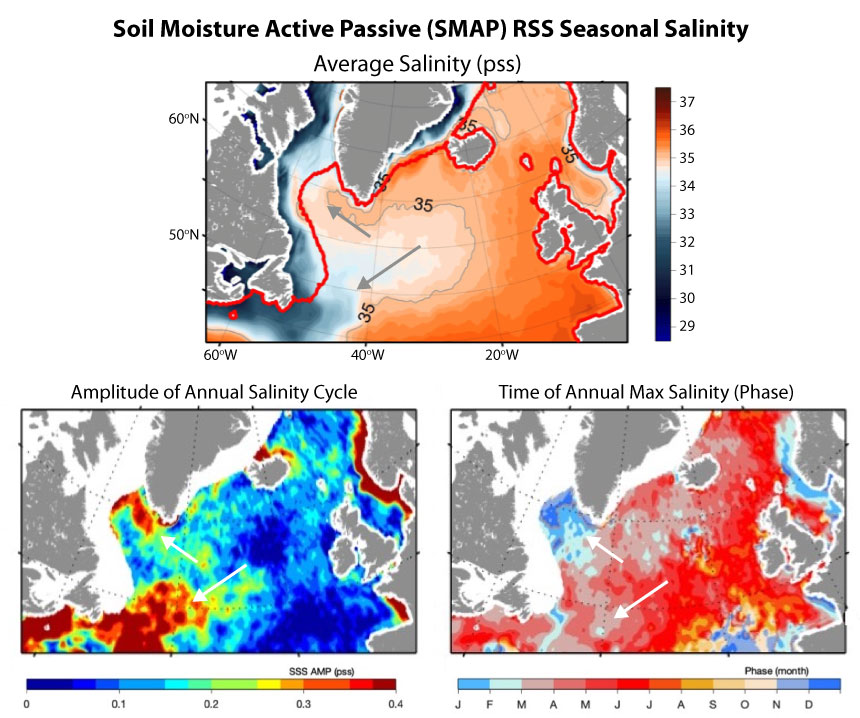
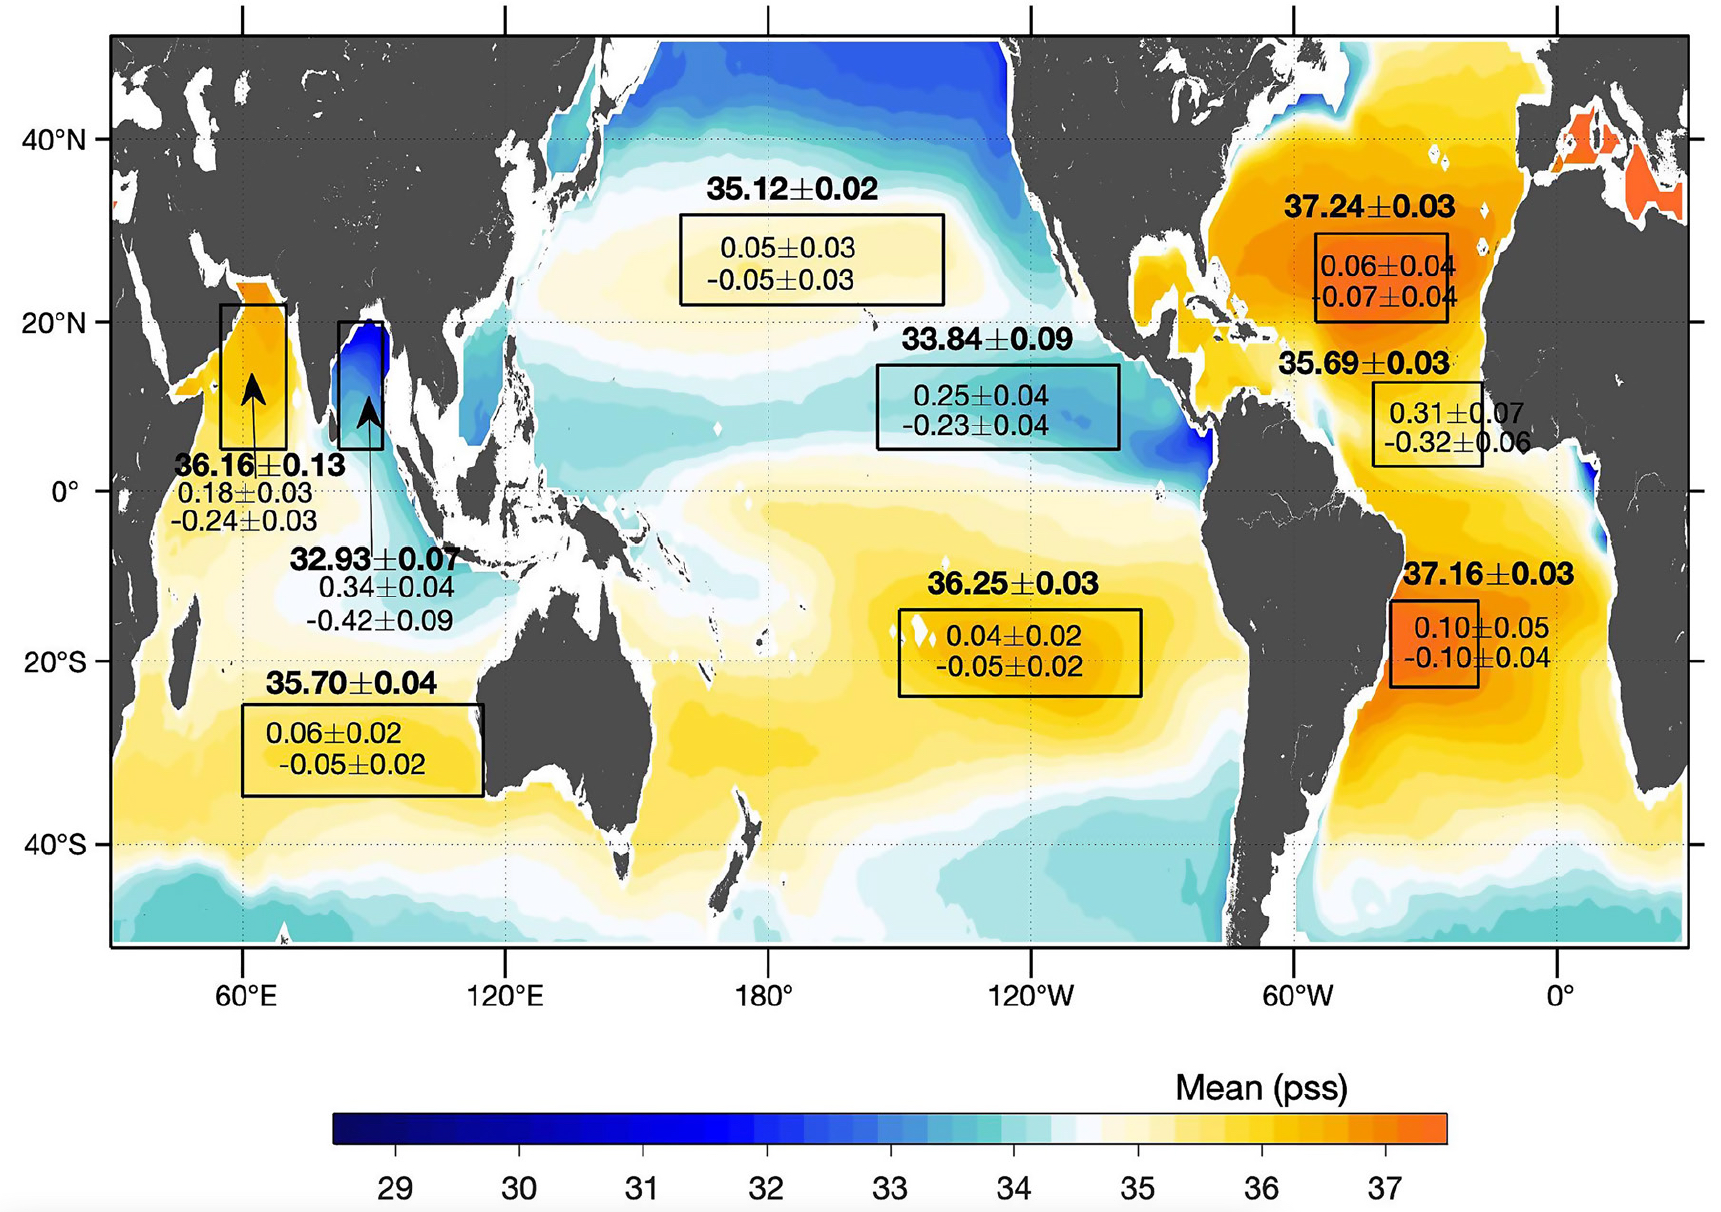
This study found the satellite and mooring data sets to be comparable in that they showed the same seasonal features in salinity - the largest amplitude changes were by the Congo and Amazon River outflow areas, the western tropical Indian Ocean, and the North Pacific around 10°N. In the Northern Hemisphere, the time of annual max SSS (i.e., phase) was between February-May, while in the Southern Hemisphere it was between July-December. Outliers to this timing included the monsoon driven Bay of Bengal with its max SSS in October prior to monsoon season.

Reference

Bingham, F.M., Brodnitz, S., and Yu, L. (2021). View the full paper.

Argo deployment

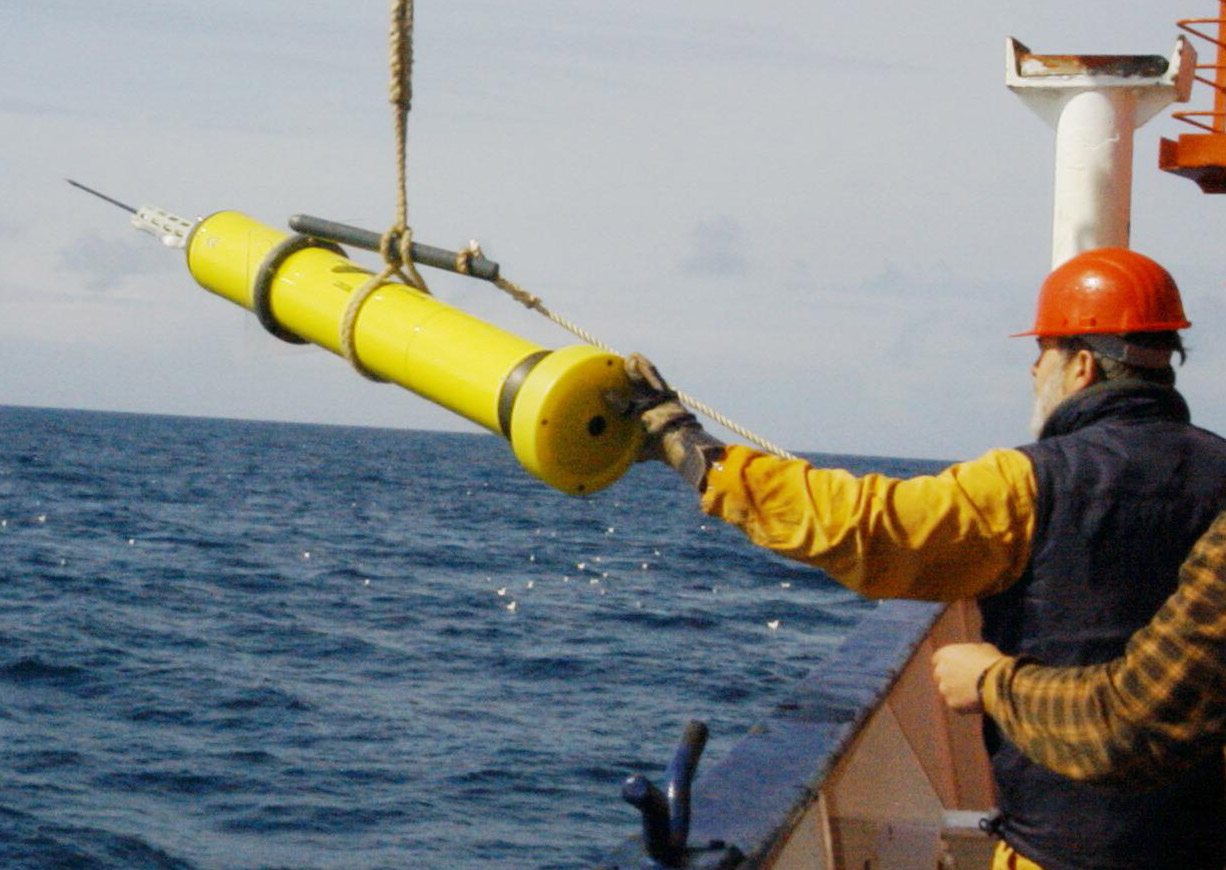
In this paper, ten years of Argo data are analyzed to learn more about climatology and seasonality of salinity in the global upper ocean. Note that many of the studies included in this highlight use Argo data to compare to satellite data, so although Argo floats are in situ sampling devices, they are instrumental in using satellite data.

Several key features of salinity seasonal variability extracted from this analysis, include: 1) Seasonal variability, both it in its annul and semiannual components, penetrates the upper ocean down to 2,000 meters. 2) Unlike temperature where the midlatitudes have greater seasonal variation, salinity varies most across seasons in the tropics. 3) In surface waters, salinity seasonal dynamics are driven by evaporation/precipitation and river runoff; below 100 meters, seasonal variability is driven by currents and circulation patterns.

Reference

Chen, G., Peng, L., and Ma, C. (2018). View the full paper.