Salinity is normally measured from a ship. We measure the conductivity of seawater. Well, we can get a estimate of the conductivity of the seawater from space. As the conductivity changes, the microwave emissions change and we put a very sensitive radiometer in space that measures the microwave emissions from the sea surface and we can back that out into a salinity estimate. It's a very daunting remote sensing measurement. We have to have a very sensitive radiometer and we have all sorts of conflicting issues: the roughness of the surface, the temperature of the surface, the galactic background radiation. Read more here.
Eric Lindstrom, Program Scientist in the Science Mission Directorate at NASA Headquarters in Oceans and Climate Change, Pod Academy, 2012
Absolute salinity is defined as the concentration of dissolved salts in seawater, historically expressed in grams of salt per kilogram of seawater (g salt per 1000 g of water), also known as parts per thousand (ppt, or notated as 0/00). Determining salinity in traditional ways (e.g., titrating seawater) is very time consuming. Thus, salinity measurements were very sparse prior to the development of electronic sensors within oceanographic instruments. These instruments can be attached to moorings, floats, docks, and ship hulls, as well as deployed with cables overboard ships to measure salinity over great ocean depths.
Modern oceanography uses the Practical Salinity Scale (PSS) to derive salinity from measurement of the electrical conductivity, temperature, and pressure (related to depth) of a sample of seawater (usually measured in situ or in the water). Also used is the Practical Salinity Unit (PSU). Both PSS and PSU are roughly equal to parts per thousand (0/00).
With the advent of satellite-based salinity measurements, collected by the pioneering Aquarius satellite starting in 2011, and currently collected by the SMAP satellite since 2015, global ocean sea surface salinity (SSS) mapping is now possible (view the global data maps on our home page). In order to match up these different salinity data sets, many scientists and sensors were needed to intercalibrate satellite SSS measurements (a measurement of seawater brightness temperature) with ocean (in situ) SSS measurements. Now satellite-made SSS data can be reported reliably in units of PSU and 0/00 as well!
There's no such thing as absolute good or bad, right? In certain areas, you want to monitor the change, that's really the key. You want to see whether the area's freshwater gets fresher, you know, and if the salty water gets saltier. That represents the speeding up or slowing down of the water cycle. So you ask the questions: do we have more evaporation as we change the climate? Do we have more freshwater melting? All these questions are related.
Yi Chao, Aquarius Project Scientist, NASA Jet Propulsion Laboratory in Ocean Bights Interview with Yi Chao, The Magazine of the Catalina Marine Society (CMS), Vol. 2, No. 2, 2010 [Interviewer: Chris Howell]
Over the past 50 years, we see a dramatic freshening of seawater in some parts of the North Atlantic. We also see salinity increasing, or getting saltier, in other regions. So global warming will have a signature in ocean salinity, that is why we want to measure it from space.
Yi Chao, Aquarius Project Scientist, NASA Jet Propulsion Laboratory in Inspire Chat with Yi Chao, 2010 [Host: Jim Gerard]
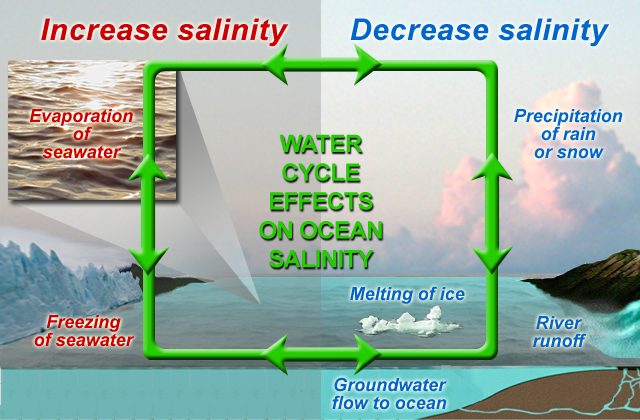
The key to understanding the earth is not simply to understand individual processes but rather to understand their linkages. Surface salinity in the ocean provides linkages and understanding of a number of different cycles in the earth. If we want to understand the water cycle of the earth, we have to understand things like evaporation and precipitation; that is, the water moving from (the land and) the ocean to the atmosphere...and coming from the atmosphere back to the ocean. When you rain on the ocean, you change its salinity: the surface salinity becomes less. When you evaporate water from the ocean, you change its salinity: the surface salinity becomes greater. When you freeze (ocean) water into ice, the ice rejects the brine (i.e., salty water) and the salinity of the surrounding ocean increases. So the point of making those measurements today is that they help us to elucidate so many different aspects of the coupled processes that define the earth as a system.
Furthermore, the deep circulation of the ocean is driven by density differences: heavy water sinks, lighter water floats. The salinity content of the deep ocean - of the subsurface ocean - is a big part of determining the density of those waters. So if we are to understand subsurface currents, we need to understand surface salinity because it's at the surface where the "imprint" of salinity is placed on the water. It really ties together a lot of things. It is an extremely timely mission.
Michael Freilich, NASA Earth Science Division Director, 2010
Mostly due to the land-sea contrast (located between two major continents). It is also smaller than the Pacific.
Yi Chao, Aquarius Project Scientist, NASA Jet Propulsion Laboratory in Inspire Chat with Yi Chao, 2010 [Host: Jim Gerard]
There are quite a lot of interesting discoveries the science community has been finding from the Aquarius data over the ocean. The dynamics involving fresh water from precipitation and how it mixes with upper layers of the ocean is of special interest. Satellites measure salinity at the surface. We also use ocean buoys, but readings use conductivity sensors to measure salinity at a depth of about five meters, a depth at which algae is less likely to grow. We know that the surface layer, aerated by wave motion and carrying warm water in the tropics, is conducive to algae growth. Sensors placed closer to the surface would become fouled with algae and no longer function. At a depth of five meters, algae growth is discouraged, the increased salinity at depth acts much the same as chlorine would in a swimming pool. The ever-changing salinity dynamic in the top five meters of the oceans has recently become a topic of great interest to oceanographers and climate scientists. Its understanding is now seen as a key factor in predicting weather patterns and changing climate.
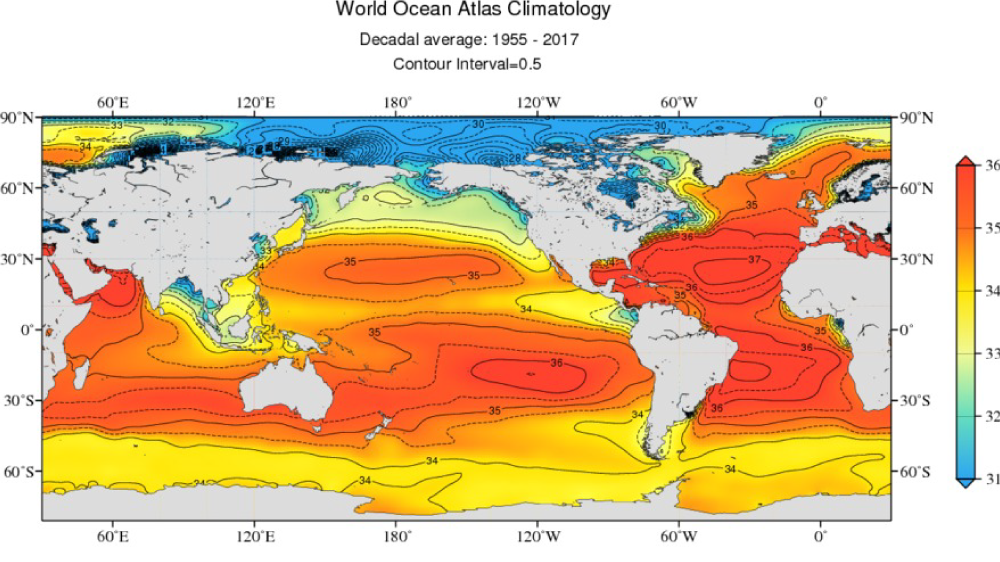
Explore how salinity changes over depth, from the ocean's surface to the deepest depths, at World Ocean Atlas, an interactive database. Click on "Salinity" to access global salinity maps, and then choose from a range of depths (surface to 4000 m).
In the tropics, the Pacific, and the Atlantic, there are what we call inter-tropical conversion zones. These zones occur near the tropics where wind develops between the northern and southern hemispheres. In the Pacific, this region produces more rain than the Atlantic. The traditional thought - before the Aquarius mission - was that rainfall would form a freshwater layer on the surface that then quickly mixed vertically with the seawater below it. If this were the case, we should not see a freshwater layer on the ocean surface for very long. The speculation from Aquarius data is that it has to do with local wind conditions. When the ocean surface is calm and the wind is low, the freshwater layer can stay "intact" longer. But when the wind is stronger, vertical mixing is more rapid and the convection currents increase, potentially affecting weather patterns. A recent study indicates that this could very well be the case. Scientists looking at data from Aquarius and SMOS observed, in unprecedented detail, a vast, warm water surface barrier layer emanating from the Amazon/Orinoco plume outfall and crossing - largely intact - the Atlantic Ocean during Hurricane Katia.
It's a little bit complicated in engineering terms but I'll see if I can make this clear: conductivity is what makes currents flow. So something that has good conductivity, like the wires in your house, conduct electricity very well. If something has poor conductivity, like a glass window, it doesn't conduct electricity well at all. It turns out that the saltiness of seawater increases its conductivity. That conductivity suppresses the energy that's emitted from the ocean surface. Actually, what happens is that (the energy) bounces off the surface and back into the ocean; so the more conductivity, the more energy is retained (i.e., bounced back into the ocean).
Probably more than you think. Some scientists estimate that the oceans contain as much as 50 quadrillion tons (50 million billion tons) of dissolved solids. If the salt in the sea could be removed and spread evenly over Earth's land surface it would form a layer more than 500 feet thick (152.4 meters), about the height of a 40-story building. Seawater is 220 times saltier than fresh lake water. Unrefined sea salt contains 98.0% sodium chloride and up to 2.0% other minerals (salts). Together there are over 100 minerals, composed of 80 chemical elements, in sea salt. The composition of a single crystal of ocean salt is so complicated that no laboratory in the world can produce it from its basic 80 chemical elements.
There are a number of ways of measuring the salinity in the water, including tagging marine animals as you mentioned. The TOPP project is just one such example of tagging animals in the ocean. One can also measure salinity from ships, moored and drifting buoys, and profiling floats. There are 3000+ Argo floats that measure sea surface salinity every 10 days. We need these in situ measurement to calibrate the satellite observations, and verify the proposed 0.2 salinity unit accuracy.
Yi Chao, Aquarius Project Scientist, NASA Jet Propulsion Laboratory in Inspire Chat with Yi Chao, 2010 [Host: Jim Gerard]
That could be part of the answer but because the oceans are so vast there's a much bigger chemical process going on than in a lake. And there are also some lakes that are extremely salty, for example the Great Salt Lake. For various reasons because of the nature of the minerals that feed into the lake, the amount of evaporation that goes on in the lake and because the Great Salt Lake is in the desert, water flows in and then evaporates away and leaves the residue behind.
Whereas in lakes like the Great Lakes there is more of a turnover in fresh water: the water flows in and goes back out again so there is a flushing. The water eventually makes its way to the Saint Lawrence River and to the ocean. So the Great Lakes get flushed through and the salt doesn't accumulate. In the Great Salt Lake there's no outflow (i.e., the water flows in from a river and then evaporates into the atmosphere and leaves the salt behind). This is the same reason why the Dead Sea is very salty.
Historical ocean surface salinity values collected in situ by instruments based on ships and in-water buoys. Credit: World Ocean Atlas 2018.
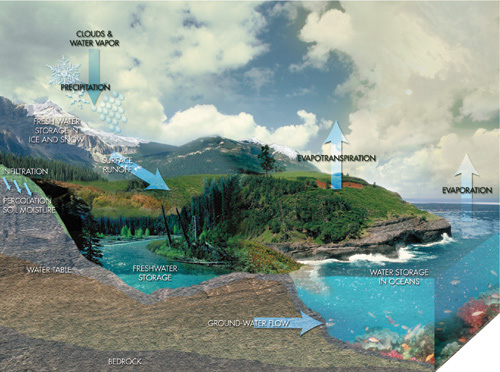
A defining characteristic of ocean water is its relatively high concentration of dissolved salts or salinity. Understanding why the sea is salty begins with knowing how water cycles among its physical states: liquid, vapor, and ice. As a liquid, water dissolves rocks and sediments, and reacts with emissions from volcanoes and hydrothermal vents: this creates a complex solution of mineral salts in our ocean basins. In other parts of the cycle, however, water and salt are incompatible: water vapor and ice are essentially salt free.
Through Earth's history, certain processes - including weathering of rocks, evaporation of ocean water, formation of sea ice - have served to make the ocean salty. These "salinity raising" factors are continually counterbalanced by processes that decrease salinity such as the continuous input of fresh water from rivers, precipitation of rain and snow, and melting of ice.
Seafarers through history have discovered that Sea Surface Salinity (SSS) varies from place-to-place: SSS in the open ocean generally ranges between 32 and 37 PSU (practical salinity unit), but may be much lower near fresh water sources or as high as 42 in the Red Sea. Between 300 and 600 AD, awareness of changes in salinity, temperature, and smell helped Polynesians explore the southern Pacific Ocean.
In the 1870s, scientists aboard H.M.S. Challenger, the scientific expedition that started modern oceanography, systematically measured salinity, temperature, and water density in the world's oceans. Over the years techniques for measuring such ocean water properties have changed drastically in method and accuracy. Aquarius was a NASA Earth Systems Science Pathfinder mission that provided a new type of SSS measurement through an innovative use of technology.
Although everyone knows that seawater is salty, few know that even small variations in SSS can have dramatic effects on the water cycle and ocean circulation. This is why long-term, accurate, global maps of SSS - such as those delivered by Aquarius (2011-2015) and the higher resolution SMAP satellite (active since 2015) - are crucial to climate studies. Learn more about NASA's SSS satellites here.
There are two potential ways to look at your question. I don't really know how much of an interference of our microwave frequency signal that we would see from a volcanic eruption. We do know that when there are large volcanic eruptions, it certainly throws off infrared frequency measurements from space because the dust and debris get injected into the stratosphere and creates a horizontal cloud that obscures some of the infrared light. But I think that microwave energy (that NASA measures) will pass right through so I don't think it will actually affect our measurement. But its impact on the ocean is going to less direct. It will impact the temperature over the long run because it will shield some sunlight and therefore affect the temperature that, in turn, could affect the interaction of the ocean with the atmosphere to change rainfall patterns that would affect salinity. This is because salinity is directly tied to rainfall and evaporation off the sea surface. There wouldn't be any near-term effect but there could be long-range effects associated with volcanic eruptions. But I don't think a volcano is going to have any direct effects on sea surface salinity.
Yes, there is a lot of salt in the ocean, but there is a lot more water. In ocean waters of average salt content (35 PSU), the weight of water is over 28.5 times greater than the weight of salt it contains. Oceanographers use the measure of salinity to describe the relative amount of salt to water.
That's an interesting question. The important thing to understand about marine biology and what affects life in the ocean such as primary productivity is that the saltiness of the water doesn't have much direct effect on sea life. Marine organisms can live pretty much at any ocean salinity. What really governs the concentration of biology in the surface waters is the availability of nutrients and that depends on ocean circulation. The salinity, however, can be a tracer of different water masses, some of which are nutrient-rich and some of which are nutrient-poor. In the coastal areas, there tends to be river water flowing out that can be rich in nutrients. We can also have coastal upwelling that can bring nutrient-rich water from the deeper ocean to the surface; these areas will have surface salinity signatures that we can observe with Aquarius that will help tell us where those nutrient-rich waters are. But it isn't the salinity itself that governs the biological productivity; it's actually the availability of nutrients.
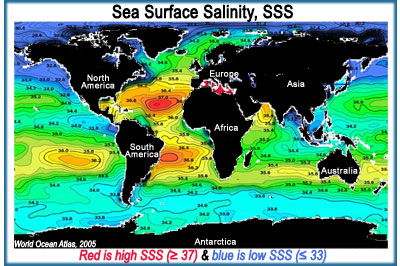
Historical ocean surface salinity values based on ships and in-water buoys. Red areas show relatively high salinity (over 37 parts per thousand) and dark blues show relatively low salinity (below 33 parts per thousand).
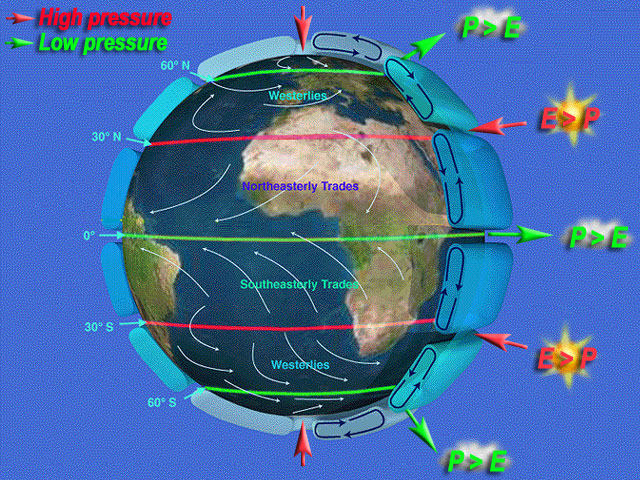
No. Although the amount of salt in the ocean is relatively constant on time scales of years to decades, sea surface salinity (SSS) varies because freshwater input & output - part of the global hydrologic or water cycle - varies from place-to-place. The large scale pattern of evaporation and precipitation is established by Earth's atmospheric convection cells. In the simplest case - for example, if Earth were covered by oceans and not spinning - the atmosphere would move heat between the hot tropics and cold poles in a very simple way. Hot air would rise along the equator, creating a band of low atmospheric pressure. Cold air would sink at the poles, creating regions of high atmospheric pressure.
The presence of continents and Earth's rotation complicates the idealized "two cell" system. A fairly realistic model of Earth's atmospheric circulation consists of six cells: three on each side of the equator. This pattern has atmospheric pressure highs at the poles, 30°N and 30°S. It also has atmospheric lows along the equator, 60°N and 60°S. Away from the poles, cloudiness and precipitation (P) dominate bands of low pressure: these latitudes host the world's rainforests. Dryness and evaporation (E) dominate bands of high pressure: these latitudes are home to deserts.
In terms of SSS, lower salinity generally occurs where precipitation is greater than evaporation (P>E). Higher SSS generally occurs where evaporation is greater than precipitation (E>P). Compare the "six cell" model with the map of global average SSS (image upper right). How well do SSS patterns mirror bands of high and low atmospheric pressure? In places where they do not match, what other types of freshwater inputs & outputs might be occurring?
This area, the Sargasso, was first investigated by NASA two years ago in a study called SPURS (Salinity Processes in the Upper Ocean Region Study). What's interesting is that when the SPURS data is analyzed in conjunction with the data from Aquarius, the conclusion is the ocean is much more dynamic than scientists had thought in the past. So, it's not really a desert. There are a lot of activities going on in the region. It was thought, in the past, that because the region is dominated by high evaporation and so little precipitation, no rain in the area, the salinity should follow the evaporation pattern pretty well. But then it turned out that, that's not really the case. It's what we call horizontal advection, and also, vertical mixing. Horizontal advection corresponds to the ocean current redistributing waters of different salinities horizontally. Vertical mixing is the exchange of waters at different depths with different salinities.
Earlier in our conversation you mentioned fresh water outflow from rivers. Near the equator the river that produces the greatest outflow is the Amazon. What we're seeing now is that the outflow from the Amazon River can affect (the ocean salinity for) more than just a few hundred kilometers. We found that sometimes, large pockets of fresh water from the Amazon can break free, follow the current across the Atlantic and move towards Africa. This is really amazing. The thought has been that when the fresh water From the Amazon comes out, it would mix quickly with the ocean within a few tens of kilometers or maybe as much as a hundred kilometers. But it's more than that. Now, we're seeing that the ocean can carry that fresh water pocket for a much longer distance.
Simon Yueh, Aquarius/SMAP Project Scientist, NASA Jet Propulsion Laboratory, 2014 [Interviewer: Chris Howell]
This project is known as "SPURS," which stands for "Salinity Processes in the Upper-ocean Regional Study." The experiment will have two goals. One is to provide more in situ data to help us to compare with Aquarius and more importantly, to collect three-dimensional information at various depths. We have five cruises planned. Each cruise will be thirty days long and will take place in the North Atlantic about 28 degrees north, away from the coast, where maximum salinity in the Atlantic is present. We'll deploy a number of different vehicles, including robotic vehicles, to measure saline concentration in the three-dimensional water column, and then try to understand what controls the change at the surface. Aquarius measures only surface salinity. By knowing the surface changes, we hope to use this field campaign to understand the processes that take place within the water column. So, if we see some changes at the surface, we can anticipate what may be happening at depth.
Yi Chao, Aquarius Project Scientist, NASA Jet Propulsion Laboratory in Ocean Bights Interview with Yi Chao, The Magazine of the Catalina Marine Society (CMS), Vol. 2, No. 2, 2010 [Interviewer: Chris Howell]
The Atlantic experiences a higher amount of evaporation; the same is true for the Mediterranean Sea, where salinity is as high as 37-39 PSU.
Yi Chao, Aquarius Project Scientist, NASA Jet Propulsion Laboratory in Inspire Chat with Yi Chao, 2010 [Host: Jim Gerard]
We don't know. It's pretty interesting. This is something for the scientists to ponder. There's a lot of information that still missing. So, this is an area in which we're still learning.
Simon Yueh, Aquarius/SMAP Project Scientist, NASA Jet Propulsion Laboratory, 2014 [Interviewer: Chris Howell]
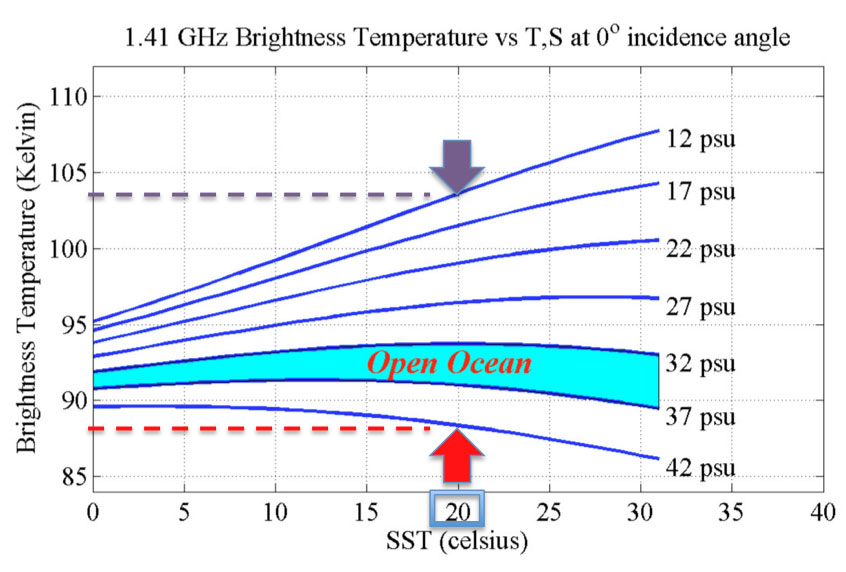
Brightness temperature versus sea surface temperature at the frequency of the NASA Aquarius instrument.
What we're measuring is natural radiation from the ocean surface. Everything has energy because it's not at absolute zero temperature and thus gives off radiation. An example of that is night vision. The military is able to see people at night not because they look at light but because they look at infrared radiation. The people are giving off energy at lots of frequencies. One of those (frequencies) is slightly below the optical and is called "infrared" and we use night vision to see that.
Another example of natural radiation is the heating of your electric stove. You turn on the burner, it warms up, and it glows red because it has gotten more energy and the added energy changes its frequency distribution. Now because it's so hot, it actually gives off more energy in the optical frequencies that our eyes are sensitive to. But it is also putting off radiation at all frequencies. So if we looked at it with night vision, then it would be overwhelmingly bright. And if you looked at it in the microwave frequency range (e.g., 1.41 GigaHertz, GHz like the Aquarius instrument measures), it would also look very bright. So it's giving off energy.
We talk about that energy as an equivalent temperature. So you can say that if the temperature is higher, there is more energy and if the temperature is lower, then there is less energy. The scale isn't so important because it depends on the frequency (e.g., the same temperature scale wouldn't work for the night vision scale at the infrared frequencies). But we have a scale called "Brightness Temperature" that is measuring the amount of energy that's being given off by the ocean surface at a fixed temperature.
So in the graph above right (click image to enlarge), go along the horizontal axis and stop at a sea surface temperature (SST) equal to 20 degrees Celsius (see blue box). If you go up to the blue line labeled "12 PSU" (practical salinity units, PSU), you'll see a purple arrow. If you read across to the vertical axis (i.e., follow the purple dashed line to the left), you see that lower salinity water gives off higher energy because the Brightness Temperature is about 104. At that same SST of 20 degrees Celsius, higher salinity water (see red arrow at 42 PSU), gives of relatively lower energy (i.e., follow the red dashed line to Brightness Temperature on the vertical axis at about 88).
Aquarius has a very precise instrument that tells us how much energy is coming off the ocean surface and we express that as a "Brightness temperature". If the brightness temperature is higher, then the seawater is fresher (i.e., less salty; see purple arrow / dashed line above). If the brightness temperature is lower, then the seawater has more salt (i.e., red arrow / dashed line). The graph shown at right was published in 1977. So an important new area of research is to develop a set of curves that are very carefully calibrated so we know exactly what energy corresponds to what salinity. And the instrument we use is very precise and makes these measurements accurately and consistently.
The sea is salty and lakes pretty much contain only fresh water and very little salt. The reason for that is, over geologic time, as rivers erode the land and carry minerals to the sea, some of those minerals accumulate in the seawater and build up over time. These minerals make up what is called "sea salt". There is a more complicated chemical balance between what is dissolved in seawater and what gets absorbed by the ocean sediments but, over time, it has reached an equilibrium and the saltiness of the oceans has remained relatively constant for hundreds of millions of years. So if you were to go back in time to the earliest days of the dinosaurs and you took saltwater samples, it would be pretty much the same salinity as we observe today. So it is a very complicated chemical balance that maintains the ocean salinity the way it is. But the water in lakes doesn't accumulate minerals to the same degree because, first of all, they haven't existed as long (as the ocean basins) and the chemistry of lakes is different.
In the tropics, in the Pacific and also the Atlantic, there are what we call inter-tropical conversion zones. These zones occur near the tropics where wind develops between the northern hemisphere and the southern hemisphere. In the Pacific, this region produces more rain, more precipitation, than the Atlantic. The traditional thought, before the Aquarius mission, was that when the fresh water comes down as rain, it would form a fresh water layer on the surface, then mix very quickly, vertically, with the ocean. If this were the case, we should not see a fresh water layer on the surface for too long. The speculation from the Aquarius data is that it has to do with local wind conditions. When the surface is calm, when the wind is low, the fresh water layer can stay longer. Then, when the wind is stronger, the vertical mixing will be more rapid.
Simon Yueh, Aquarius/SMAP Project Scientist, NASA Jet Propulsion Laboratory, 2014 [Interviewer: Chris Howell]
Yes, for the first series. There will be five cruises at the same spot at different seasons. Each cruise is thirty days long. The first cruise will take place in the fall of 2012, with the first series concluding in the summer of 2013. All will take place in the same North Atlantic location. We call it sub-tropical: 28 degrees north, 38 degrees west. You can go to the website for a detailed description. Each cruise will occupy an area a few hundred kilometers by a few hundred kilometers, so we'll have a view of Aquarius' footprint. A lot of information will be collected in that footprint. And even within this designated portion of Aquarius' path, a lot of changes occur such as microclimates and even micro-oceans. We chose that area because it's very salty, around 38 PSUs (practical salinity units). We want to understand what maintains the salty water. That's a simple question.
Yi Chao, Aquarius Project Scientist, NASA Jet Propulsion Laboratory in Ocean Bights Interview with Yi Chao, The Magazine of the Catalina Marine Society (CMS), Vol. 2, No. 2, 2010 [Interviewer: Chris Howell]
That's an extremely insightful and thoughtful question. Since the dawn of civilization, salinity measurements have been made rather sporadically: at points and intermittently in time, and with varying accuracies. What Aquarius/SAC-D will be doing is making global measurements frequently and with high precision, high accuracy and high stability. There are places in the ocean - particularly in the northern hemisphere - where we have almost enough salinity measurements in the past to be able to continue a "time series" as (the person who asked the question) pointed out with Aquarius/SAC-D. However, over vast reaches of the earth's ocean - especially in the southern hemisphere and the southern oceans - these will be the first measurements. So it's a combination of extending our knowledge and improving those measurements in some areas where we already have "barely reasonable" measurements (and) extending excellent measurements to areas where we have never measured before.
Michael Freilich, NASA Earth Science Division Director, 2010
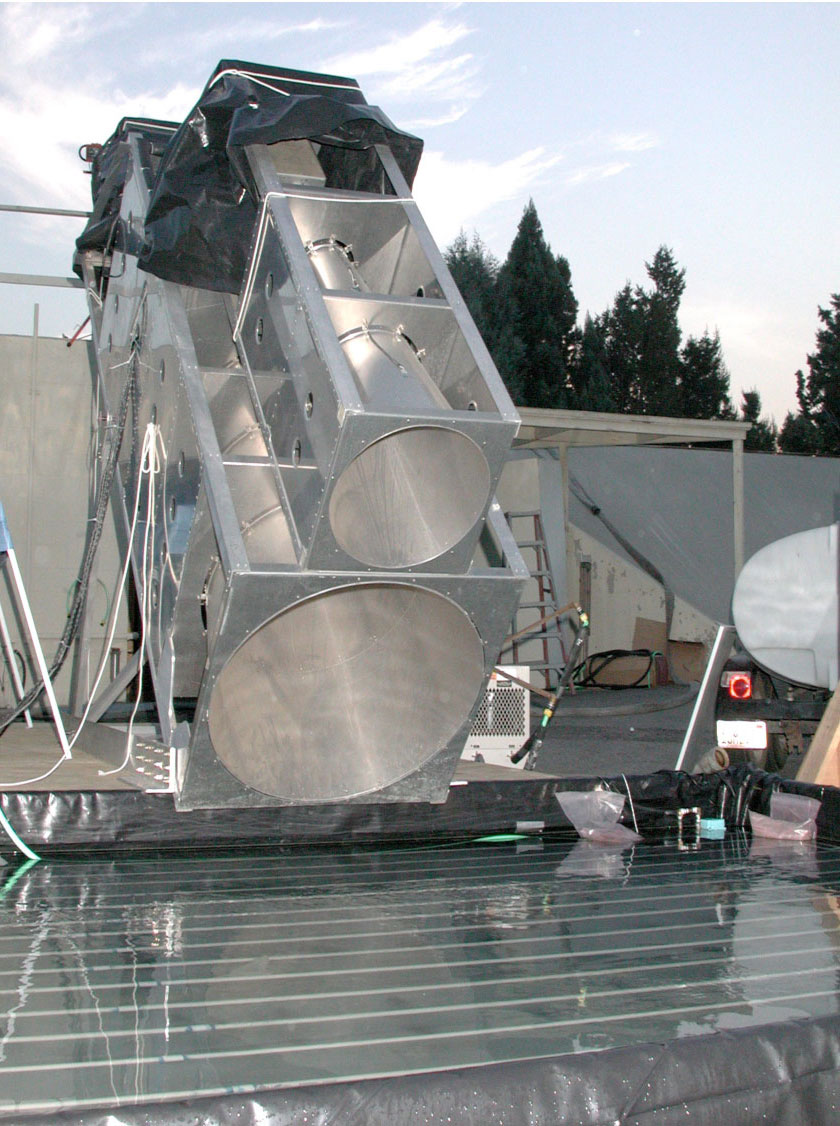
The theory was developed more than 20 years ago. Because this is such a challenging measurement, it took more than a decade to demonstrate that we can do this. We did the lab test first, then built a water pool outside (at JPL), and flew an aircraft to measure salinity in the coastal ocean. All of this occurred before Aquarius was launched.
Yi Chao, Aquarius Project Scientist, NASA Jet Propulsion Laboratory in Inspire Chat with Yi Chao, 2010 [Host: Jim Gerard]
Eric Lindstrom, NASA Physical Oceanography Program Scientist.
At the moment, it's just being used by salinity scientists trying to understand the measurement itself. It's not quite ready for prime time yet but the reason it's flying is to understand the water cycle on the planet, among other things. In this warming world that we have, the oceans are warming, the atmosphere's warming, there's the idea that the water cycle on the planet will accelerate, there'll be more moisture in the atmosphere, more precipitation, more cycling of water through the system. And the ocean can be kind of integrated gauge for that - changes in salinity can indicate changes in evaporation and precipitation over the ocean.
In fact, if you look back over all the measurements that have been made from ships over the last 50 years and you map the changes in salinity you actually find that most of the saltier places in the ocean surface have gotten saltier and the fresher places have gotten fresher, which is exactly the fingerprint that you would think to see in an acceleration of the water cycle. So as Aquarius is coming along ocean scientists are trying to diagnose if this is really true, that there is an acceleration. We have to act like a doctor doing diagnostics on a human, we have to rule out other diseases so what we're trying to do with salinity here is rule out that it's not ocean processes fooling us to make it look like an acceleration of the water cycle. Want to read more from Eric's interview? Click here.
Eric Lindstrom, Program Scientist in the Science Mission Directorate at NASA Headquarters in Oceans and Climate Change, Pod Academy, 2012
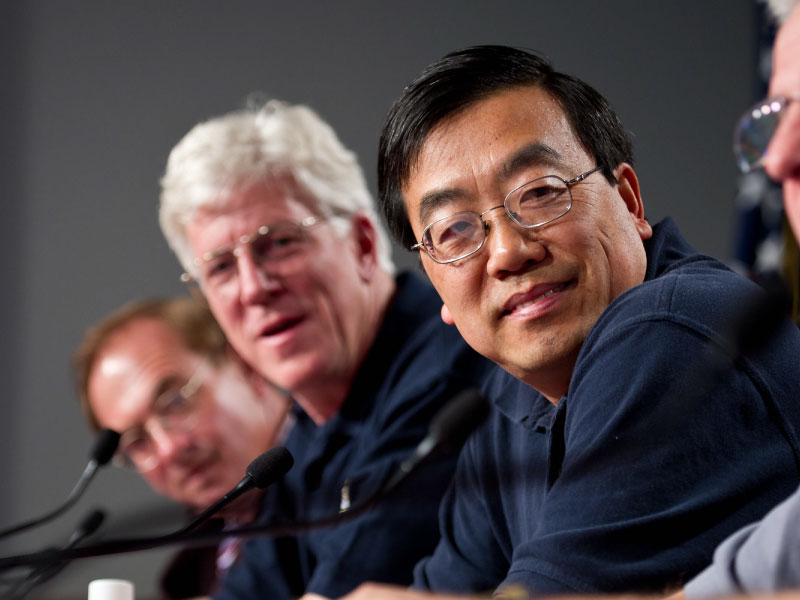
Gary Lagerloef (middle) and Yi Chao (right). Photo: NASA/Bill Ingals.
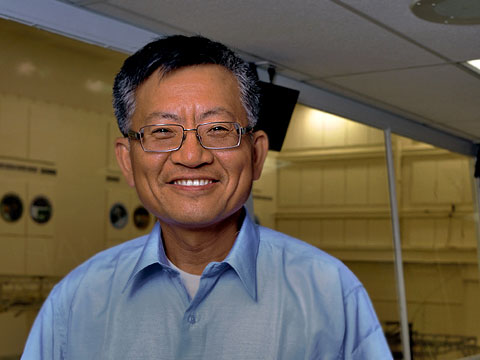
I received my Bachelor's degree from China in atmospheric physics and came to the United States for graduate school in 1985. I went to Princeton to study atmosphere/ocean sciences. After two years, having received my master's degree, I became more and more interested in the ocean, so I switched from atmospheric science to ocean science, which is very similar. They're both in the Earth/science, geo/science category. I got my Ph.D. in Oceanography, and then I came to UCLA as a post-doc, and began to interact with the people at JPL. I became fascinated with remote sensing techniques from aircraft and space, and after three years, I moved to JPL. I started my first job here in '93.
My main interest is studying ocean processes and phenomena. I try to ask the question why does the ocean do this, how does ocean health affect the ecosystem, atmospheric processes and climate? JPL is working with a lot of engineers who try to think about future ways of measuring the ocean from space. It evolved from sea-level measurements in the nineties, wind-level measurements in the late nineties, and then ocean salinity being the natural course of study.
Salt controls the weight of the water. More importantly, the temperature and the salinity determine the weight of the seawater, the density. The weight of the water determines how the ocean flows, how it overturns. So, heavy water sinks. It's like the atmosphere where light air rises and that drives the convection. The vertical motion of the atmosphere affects the rainfall, the circulation. It's the same thing for the ocean. It's the heavier water that's important. That weight, with heat convection, drives the three-dimensional flow. By knowing the surface salinity you can condition this kind of flow. Without knowing the salinity information, you only have partial information.
Scientists have been dreaming about remote salinity sensing for decades. The first paper on it came out in the seventies exploring a theory on how we might use microwaves to measure salinity. So the theoretical work was done thirty years ago. Because the signal is very small, it's very challenging and took about twenty years for the community to sort out how to make all those little corrections and extract a small fraction of the signal being measured. The frequency we use is 1.413 gigahertz in the microwave band. We chose that frequency because it gives us the biggest response to salinity. So, in other words, we found that this is the frequency where a slight change of salinity corresponds to the biggest changes in the microwave signal the Aquarius radiometers can detect.
Yi Chao, Aquarius Project Scientist, NASA Jet Propulsion Laboratory in Ocean Bights Interview with Yi Chao, The Magazine of the Catalina Marine Society (CMS), Vol. 2, No. 2, 2010 [Interviewer: Chris Howell]
Absolutely. The two groups have been working in concert from the very beginning of the development of both missions. We participated in each other's science team meetings. I sat on the SMOS Science Advisory Group for about seven or eight years and we've been sharing information, algorithms, approaches to problems, things like that. There's been a great deal of communication between the two groups and we sort of see each other as one team supporting two missions in a lot of ways.
Gary Lagerloef, Aquarius Principal Investigator, 2012
There is another mission launched by the European Space Agency in 2009 known as SMOS, the Soil Moisture and Ocean Salinity mission. The key focus of the mission is soil moisture followed by ocean salinity.
If you go to the NASA Website, you will see 15 or 16 satellites already flying which measure different aspects of the Earth's systems: atmospheric, land processes, ice, snow and the ocean. Aquarius is one of the many, yet we are providing this very important piece of information, this missing piece of the puzzle. I couldn't say this is going to be the silver bullet that's going to change everything, right? But this is certainly one of the key pieces of missing information to be added to our database of all known knowledge and to monitor the global changes. The capability of the satellites is global coverage. You don't have to send a thousand ships and all their technicians to the ocean, because every week, the satellite will cover every part of the planet.
Salinity is affected by precipitation, evaporation, river runoff, ice melting; so anything related to salt and freshwater will give you a signature in salinity. This is part of the water cycle. In other words, if you are melting more of the snow pack in California, where does the snow go? You can't store it in your backyard; it eventually has to go back to the ocean. When the water goes back to the ocean, you will see the salinity becomes fresher. If the ice is melting, you're going to see salinity changes. Salinity is really an indicator of many of these processes. Aquarius will provide information about the global water cycle, and more importantly, will quantify the change. You can use the salinity changes to infer how much the source is changing. In that way, it's a very powerful data set to be added to the so-called knowledge database.
Yi Chao, Aquarius Project Scientist, NASA Jet Propulsion Laboratory in Ocean Bights Interview with Yi Chao, The Magazine of the Catalina Marine Society (CMS), Vol. 2, No. 2, 2010 [Interviewer: Chris Howell]
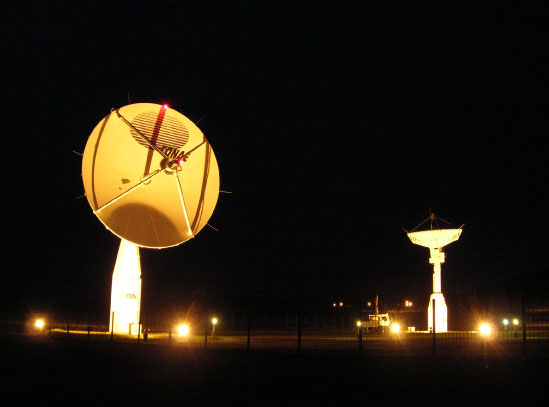
Ground Station in Córdoba, Argentina.
That's a very good question: yes, the data is downloaded at a station in Córdoba, Argentina (a little north and west of Buenos Aires). The photo at right shows the ground station. Argentina worked with the U.S. on developing this mission. It's part of a bilateral arrangement between the U.S. and Argentina to co-develop earth remote sensing satellites. Aquarius/SAC-D is the fourth mission that's been developed like this. They have a very sophisticated ground station in Argentina and they have the mission control center for Aquarius/SAC-D, as well. So they're doing all the work to control the satellite and also to download the data. The satellite passes over the Córdoba ground station about four times per day. So consequently, Aquarius has to store its data onboard and we have enough storage to hold about 16 hours of data. Every time the satellite crosses over the Córdoba ground station we download all the memory that's onboard and the next time it crosses over, we download it again. So sometimes we get multiple copies of the same data and during our ground processing we remove the duplications.
We also have a backup ground station in Italy so if we miss a pass over Córdoba, we can catch it on the next round when the satellite passes over Italy. This lessens our chances of losing any data. So far since we turned on the Aquarius instrument in August 2011, we have not lost a single bit of data. So we have 100% data recovery up until this point so we're very confident that it's working the way it's supposed to. But to answer your question, we do store the data onboard. We can store up to 16 hours of data; sometime during that 16 hours we have to have a download in order to preserve it. If we don't get it downloaded, then we start to lose some of the data because it gets overwritten.
Once we are through the calibration/validation phase, the data will be released and made available to the public. JPL's data center, known as PODAAC (Physical Oceanography Distributed Active Archive Center), is responsible for gathering the data and publishing it on the website. The digital data, the images, the graphs, everything is public access. It's open to everybody on the globe without restriction.
Before releasing the data to public domain, the science team makes sure the instrument is working properly and the information is accurate. That's the calibration/validation phase. Our goal is to release accurate data within a year of the launch. Coming up in the next few months, in early 2012, there'll be a major meeting with all of the science team members presenting their findings. Hopefully, we'll conclude that the data are accurate, then, release it so that everybody can do their own research. Then, the public can then go to the website and access ocean salinity information in their region of interest.
Yi Chao, Aquarius Project Scientist, NASA Jet Propulsion Laboratory in Ocean Bights Interview with Yi Chao, The Magazine of the Catalina Marine Society (CMS), Vol. 2, No. 2, 2010 [Interviewer: Chris Howell]
On 27-Sep-11, the Physical Oceanography Distributed Active Archive Center (PODAAC) announced the availability of Aquarius Level 2 data. These data should be used for evaluation and validation purposes only as they are still being calibrated and contain uncertainties. There will be frequent calibration and reprocessing updates, replacing earlier versions, for the next several months. Data may be accessed by acknowledging a disclaimer through Aquarius Data Access in which the user agrees to accept full responsibility in how the data are used, and to inform the project of problems and/or results found, as well as publications. Questions may be addressed to PO.DAAC.
Taken together, the information from each of the two craft complement one another other quite well.
Simon Yueh, Aquarius/SMAP Project Scientist, NASA Jet Propulsion Laboratory, 2014 [Interviewer: Chris Howell]
It became a plus in the mission. Soil moisture measurement was known to be a role Aquarius could play, but it was never thought of as the primary mission.
Simon Yueh, Aquarius/SMAP Project Scientist, NASA Jet Propulsion Laboratory, 2014 [Interviewer: Chris Howell]
For the oceans, we always need a combination of in situ buoys, which can either move freely with the ocean current, or be fixed on moorings to the ocean floor. The data from the buoys is always limited to its spatial sampling. It would be unrealistic to have moored buoys throughout the ocean. It just wouldn't be possible. It would be too expensive to do that. And so, the satellite gives us a global view of what's going on. The Aquarius mission has been going along pretty well. And in fact NASA is going to launch a new mission in a few months called Soil Moisture Active and Passive, or SMAP. (SMAP has been measuring salinity since April 2015, overlapping with Aquarius - which began collecting salinity data in August 2011 - for a few weeks. For more info see NASA Satellites.
Earlier we spoke of the Aquarius spacecraft using a fixed dish antenna and three radiometers rather than a single rotating antenna. In those days, 5 or 6 years ago, a rotating antenna presented some problems. Since then, we've developed new technology to build a big antenna that rotates. So this new mission called SMAP has the instrumentation Aquarius has, the radiometer, the radar, but together with that, it also offers a big antenna, 6 meters in fact. The Aquarius antenna is 3 meters, so this will double it, plus, we're going to rotate it. So, this craft will give us a 1000 kilometer swath with a higher spatial resolution of about forty kilometers.
Yes, every three days. And, of course, it will acquire data over the ocean all the time. The primary focus of SMAP is the soil moisture over land. Just like Aquarius, we expect the ocean salinity and the ocean vector wind product will be a plus for SMAP. This will be happening sometime next year. The mission will be launched in January 2015. Starting as early as February 2015, SMOS, Aquarius and SMAP, all operating on the same frequency, will begin working together in concert and should be operating for many years. I think it will be very exciting, very interesting.
Simon Yueh, Aquarius/SMAP Project Scientist, NASA Jet Propulsion Laboratory, 2014 [Interviewer: Chris Howell]
Sea surface temperature (SST) and in the eastern Pacific on 10 July 2012. Image created with PO.DAAC’s State of the Ocean Visualization Tool.
I think with the information we're obtaining from Aquarius, we're learning to go back and re-assess - re-evaluate - the role of vertical mixing and horizontal advection in ocean dynamics. So, even for a region we think is dominated by evaporation, or for some reason, dominated by precipitation, now the general picture is we can only grasp these as hypotheses. Horizontal advection, vertical mixing, evaporation, precipitation, all these play an important role at different times, at different scales and resolutions.
For example, another very interesting science phenomena discovered by Aquarius is what we call a tropical instability wave in the Atlantic and Pacific Oceans. (Tropical instability waves are north-south deflections of the "tongue" of upwelled cold water that extends westward from African and South American continental margins and along the Equator. These waves propagate with an average period of about 30 days, and a wavelength of about 1100 kilometers.) This is a new discovery by Aquarius. While it has been seen in ocean surface temperature images from locations a few degrees north of the equator, Aquarius now shows us that these kinds of waves also exist near the equator - but can only be seen in the salinity dataset.
The other example is the river outflow. Standard thinking has been that fresh river outflow from the Mississippi River would only affect coastal regions near Texas, Mississippi and Louisiana. The Aquarius data now shows that the fresh water on the surface can reach all the way to the southern end of the Gulf of Mexico. In the winter, when there's not much precipitation in the region, then in the summer when there is precipitation, we can see that salinity cycle in the upper ocean through the Aquarius data.
Another example I'd like to tell you is pretty interesting, it's something that we've just started to understand. It's a combination of how useful it is to combine the whole motion image salinity together. One of the interesting regions for the oceanographer or the climate scientist is the ocean surrounding the Indian Subcontinent. Why is that region so important? They have a monsoon season, right? In September, they get a lot of rain. Then, in the Indian sub-continent, around Tibet, they also get lots of snow. So the heavy precipitation and river run-off dump vast quantities of fresh water in the Bay of Bengal. We also have heavy precipitation over the open ocean in the same region. When we start to look at the soil moisture changes over the continent, and the salinity changes in the ocean, we can see their time correlation. Then, we can see when the fresh water will actually reach the southern point in the Bay of Bengal. But there's something else, more than just the fresh water coming into the Bay of Bengal. There's also a current in the Bay of Bengal, and that current can change direction in winter and summer. So, we can see how everything plays together, with fresh water coming out of the Bay of Bengal, and then the ocean current actually moving the fresh water around.
Spatial resolution and temporal revisit. We're seeing more than just a revolution in technology. NASA is really pushing the technology from smaller to bigger coverage with higher resolution creating even more powerful tools for the scientist. At the same time, we're gaining new insight, even in those areas over the ocean that we thought we understood pretty well in the past.
Simon Yueh, Aquarius/SMAP Project Scientist, NASA Jet Propulsion Laboratory, 2014 [Interviewer: Chris Howell]
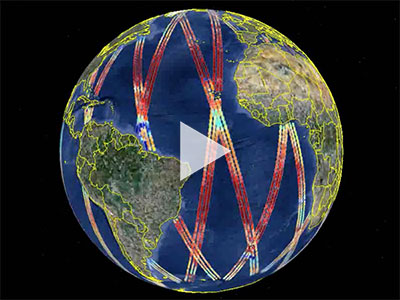
The cycling of water and energy through the atmosphere and oceans.
The mission was conceived with the primary objective to measure the ocean salinity field and the overarching scientific purpose of measuring ocean salinity is to study the interaction between the global water cycle, ocean circulation and climate variability. The global water cycle is rainfall, evaporation off the sea surface, river runoff, freezing of sea ice, melting of ice caps, all of those things that affect where fresh water is in the climate system and how it moves around. In terms of evaporation on earth, 85% comes off of the ocean. So if you look out your window and see clouds, odds are that 85% that the moisture in those clouds was evaporated off the sea surface (as opposed to off a land area). About 78% of the moisture that falls from the sky and back onto earth's surface lands on the ocean. -Gary Lagerloef
So more than 3/4 of the global water cycle is just the exchange of water between the ocean and the atmosphere. Now that said, we don't really know much about how that affects the ocean. We know it governs the broad-scale patterns of ocean salinity but how small changes in rainfall and evaporation affect the sea surface and how it affects ocean circulation are still largely unknown. That's the essence of what we want to investigate with Aquarius by mapping those variations in sea surface salinity, relating them to rainfall data that we collect from satellites, relating them to ocean temperature data that we collect from satellites, and relating it to ocean circulation data that we collect from satellites. So, in a way, Aquarius is filling in a "missing piece" of information that we really need to completely understand the role of the ocean in regulating climate and interacting with the atmosphere. That's the reason why we built Aquarius. -Gary Lagerloef
I would just like to add that it's what we call a "Pathfinder Mission" so it has the objectives of demonstrating the technology to measure salinity and then applying the salinity measurements to understanding of ocean dynamics, weather and climate, and the water cycle. -David Le Vine
Gary Lagerloef, Aquarius Principal Investigator and David Le Vine, Deputy Principal Investigator in How Do We Cover the Globe with Aquarius Data? NASA's Aquarius Studies Our Salty Seas Webinar, 2012 (Session 2)
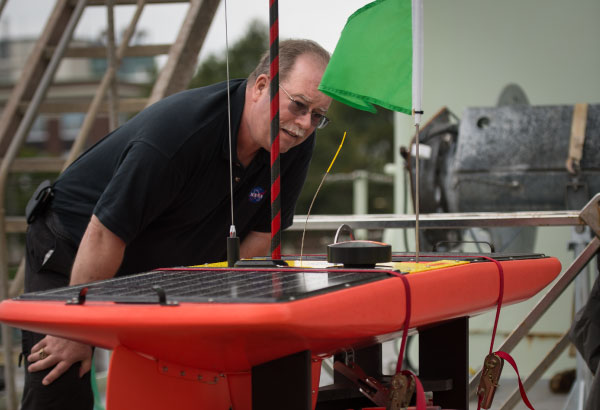
Aquarius prototype, PALS.
It kind of depends on where you start but the design work began back in 2001 with some conceptual designs that David and I worked on with a number of other scientists and engineers. We put together this basic concept of a passive/active system: that means a (passive) radiometer and an (active) radar together with three "horns" bundled together in such a way that we could create a wide enough swath to make the global measurements that we wanted. That led to a proposal that we made to NASA and, after two rounds of reviews, we were selected as a mission to be built. So then we went into much more detailed design. We didn't start the process of building the actual instrument that's now being flown in space until 2006 or 2007. We built a number prototype components before, called "engineering models", to test out the design and so on. I guess you would have to say, from beginning to end including the development of the satellite and everything else, it took us about six or seven years to build the space hardware that's now operating. There was quite a bit of time devoted to design work and engineering model development before that. -Gary Lagerloef
It also rests on the research that was done before. So you see in the concept map the chronology that takes you back to when the idea began. What's not really shown in this map so much is the engineering that went into instrument design; so there was also progress being made in the 1970s, 1980s and 1990s on the type of instrument that actually makes measurement of the brightness temperature (i.e., the Aquarius radiometer). -David Le Vine
Without the heritage that we described (in the concept map) - going all the way back to the 1970s - we wouldn't have been able to do this. There was really a long, slow build up of knowledge that led us to where we are. -Gary Lagerloef
Gary Lagerloef, Aquarius Principal Investigator and David Le Vine, Deputy Principal Investigator in How Do We Cover the Globe with Aquarius Data? NASA's Aquarius Studies Our Salty Seas Webinar, Session 2, 2012
Each radiometer is identical. We don't have to fly three. We can fly one. It would just take three times as long to cover the globe. So, think about it. We line up the three footprints, first one, then the second, then the third in a nice configuration. They line up horizontally. So rather than cover a hundred kilometers, now we can cover three hundred, and within a week, we can cover the whole globe. If we were to fly only one, it would take three weeks to cover the whole globe. Three is a nice configuration.
We could fly more, but mechanically, it's difficult to arrange. How do you fly five? With three, you optimize the coverage while giving the mechanical engineer less of a headache to configure. The original concept was to rotate the dish. Rather than have a mechanical dish with three radiometers, we would have had one radiometer in constant rotation. That option proved not to be very practical. It would have cost a lot of money, and would have presented a lot of risk. Eventually, we decided to take a more conservative course, utilizing three radiometers for the configuration. That was optimal. These studies took a few years before we were ready to begin the project.
Yi Chao, Aquarius Project Scientist, NASA Jet Propulsion Laboratory in Ocean Bights Interview with Yi Chao, The Magazine of the Catalina Marine Society (CMS), Vol. 2, No. 2, 2010 [Interviewer: Chris Howell]
Good question. We model the sun and galactic radiation very accurately, and remove them from the signal the satellite receives. We develop a complete error model for every source.
Yi Chao, Aquarius Project Scientist, NASA Jet Propulsion Laboratory in Inspire Chat with Yi Chao, 2010 [Host: Jim Gerard]
The average altitude of Aquarius/SAC-D is 657 kilometers (408 miles) at the equator.
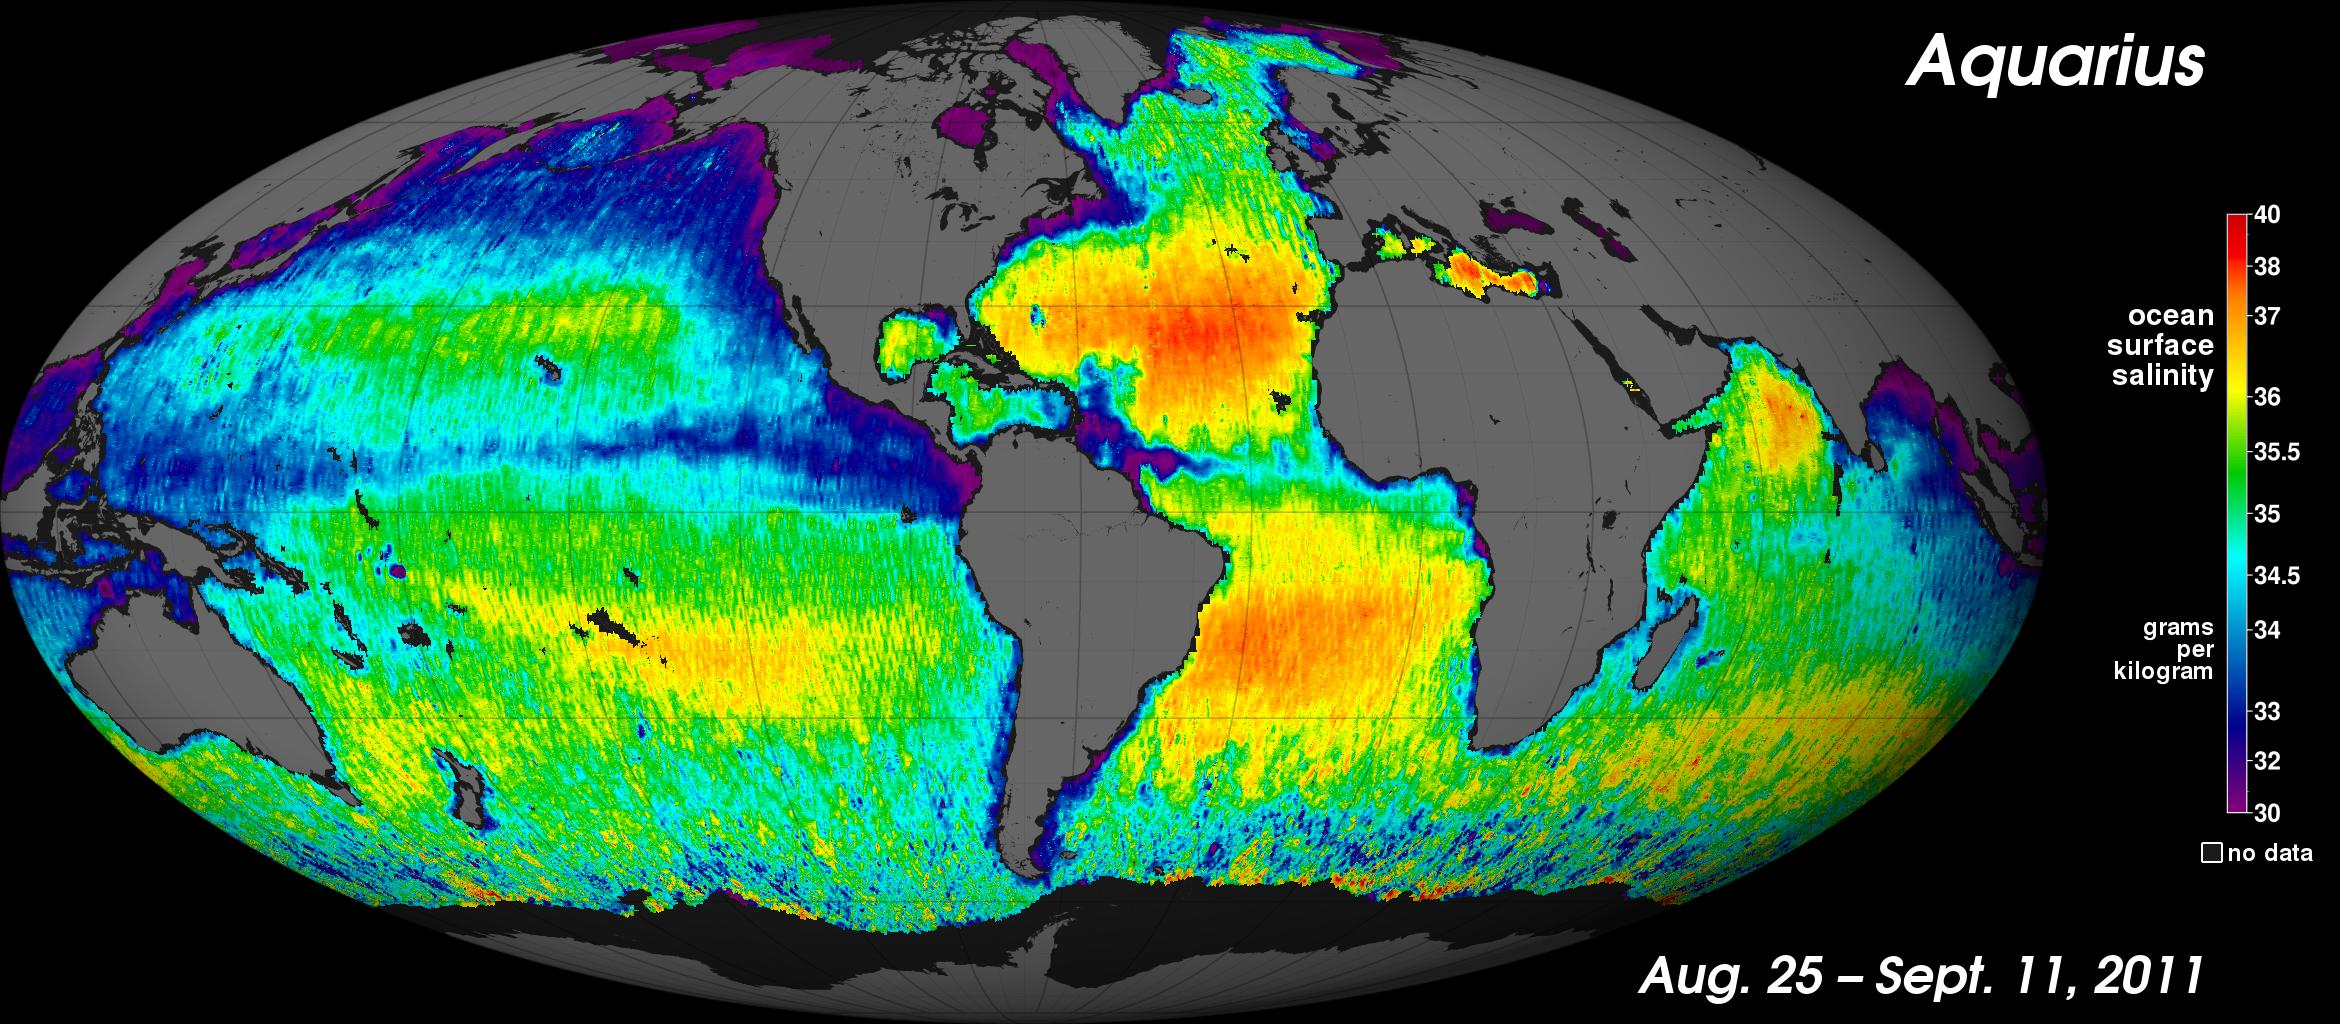
NASA’s first map of global ocean surface salinity, a composite of the first two and a half weeks of data after the Aquarius instrument became operational.
Once you start turning on the instruments, there are a number of different calibration processes to complete. There are the orbital parameters and the pointing of the instrument. You want to make sure you're pointing in the right direction, and to calibrate the antenna patterns and the antenna temperatures. All of this is first tested on the ground and in the lab. Then, in space, we have to make sure everything functions the way it was designed to. So, calibrating the stability of the radiometer is still ongoing at this point with less than a month of the data sets in. The first of the data sets began to come in almost a month into flight, around 21 July 2011. Now, we want to take a little more time and better understand how the instrument works.
Once we finish the calibration, then we start the validation. We have many independent surface measurement sources to verify calibration. Salinity readings taken by ships, buoys, robotic vehicles, and drifting vehicles in the ocean are vital to the process. With their conductivity sensors, they measure salinity at the surface, and then we compare the two. One is touching the water and one is four hundred miles in space. We are still in this calibration phase and working out some issues. Yesterday was our "first light" (Aquarius completed its first global mapping on Sept. 23, 2011). There are still some issues we need to work out. We need to understand the scatterometer data better. In first light, we only used the information from the radiometer. We're still working to calibrate the scatterometer so we can better utilize all the information. There's a variety of information you can feed into the retrieval program. So right now, we call it quick-look processing.
Yi Chao, Aquarius Project Scientist, NASA Jet Propulsion Laboratory in Ocean Bights Interview with Yi Chao, The Magazine of the Catalina Marine Society (CMS), Vol. 2, No. 2, 2010 [Interviewer: Chris Howell]
We fly a so-called "terminator" orbit. Basically, we follow the sun by flying the boundary between day and night. This way, the spacecraft can collect solar energy while the instrument looks at the dark side of the planet, allowing us to minimize the "noise" caused by sunlight reflecting off the water. On the night side, the only thing reflecting off the water is the light from stars and galaxies, making it much easier to work with.
Yi Chao, Aquarius Project Scientist, NASA Jet Propulsion Laboratory in Ocean Bights Interview with Yi Chao, The Magazine of the Catalina Marine Society (CMS), Vol. 2, No. 2, 2010 [Interviewer: Chris Howell]
It's going 4.2 miles per second; that's very fast. It's about 25,000 miles to circle the earth and we do it in 96 minutes that is about an hour and half so it's something like 15,000 miles per hour.
The microwave L-band radiometer plus the scatterometer that is used in the Aquarius instrument are far and away the most accurate and precise and stable instruments of their type that have ever been flown in space. This really could not have been done ten years ago.
Michael Freilich, NASA Earth Science Division Director, 2010
SMOS satellite.
That's a really good question. There are a couple of things to say about the SMOS mission and how it differs from Aquarius. First of all, SMOS stands for Soil Moisture & Ocean Salinity; it's a dual science mission. The primary science drivers for how that mission was designed were focused on measuring soil moisture. That's why the SM comes before the OS in the name of the mission. And it was always viewed as a kind of an experiment to see how well we could do salinity with it because the design is not idealized for ocean salinity. What we did differently with Aquarius was really focused on ocean salinity and what the measurement requirements were there in terms of accuracy, calibration, stability, and spatial and temporal resolution that we thought were the key science objectives.
So, the other factor is that SMOS employs a thinned aperture, phased ray design which is much more difficult to calibrate than Aquarius is going to be and so they're running into some of those problems. With regard to the radio frequency interference issue that you mentioned - that has plagued SMOS. They've done a lot of work on dealing with some of the emitters, particularly in northern Europe. Aquarius actually anticipated this problem and one of the other technological factors that went into the design of the Aquarius instrument was that we have actually tested and built an RFI filter using measurements that we've taken from rooftops and other places to see what the characteristics of that radio interference would be. So we built a filter into the processor - it hasn't been tested from space yet - but we think we'll have sort of a leg up on that problem once we get on orbit.
Gary Lagerloef, Aquarius Principal Investigator, 2012
The radiometer is a passive instrument collecting radiation emitted from the planet's surface. The scatterometer, on the other hand, is an active radar that measures the "roughness" of the water caused by waves and swells. It sends a pulse to the ocean's surface to measure the reflectance. If it's a perfect mirror, you get a perfect reflection. The spacecraft uses the same dish antenna for both instruments, combining the two separate signals from the radiometer and the scatterometer to produce an accurate measurement.
Yi Chao, Aquarius Project Scientist, NASA Jet Propulsion Laboratory in Ocean Bights Interview with Yi Chao, The Magazine of the Catalina Marine Society (CMS), Vol. 2, No. 2, 2010 [Interviewer: Chris Howell]
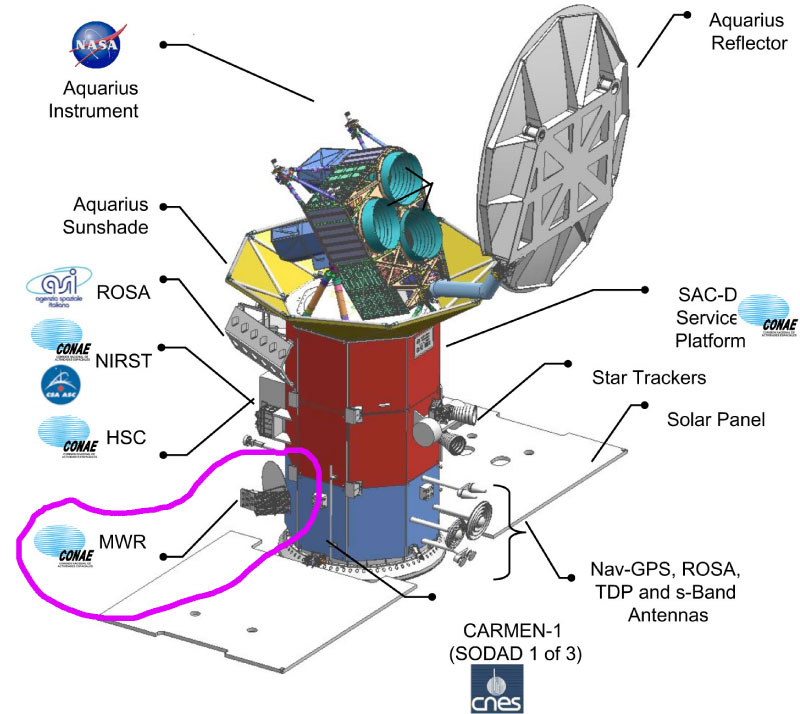
Deployed configuration of the Aquarius instrument (microwave radiometer is circled).
Generally no. The microwaves at this frequency band go right through clouds, so clouds are perfectly transparent. The only thing we have to worry about in relation to clouds is that in areas of very heavy rainfall, the rain itself will attenuate (i.e., reduce) some of the signal. We have a way of flagging data where rainfall is heavy by using data from other instruments. We have a microwave radiometer (MWR; see purple circle in lower left of image at right) onboard the satellite. The MWR was built by Argentina and its purpose is to look at rainfall and give us that measurement. We can also look at data from other satellites that are orbiting and use that information as well. But we do have to take heavy rainfall into account. -Gary Lagerloef
I would just like to add that the "L-band" frequency (1.41 GHz) that Aquarius uses is very nice to look at earth's surface because the atmosphere is pretty much transparent so clouds and light rain are not a major factor. -David Le Vine
We ran some simulations before the mission and calculated that we would lose less than 1% of the data due to rainfall. So it's not a significant problem. -Gary Lagerloef
Gary Lagerloef, Aquarius Principal Investigator and David Le Vine, Deputy Principal Investigator in How Do We Cover the Globe with Aquarius Data? NASA's Aquarius Studies Our Salty Seas Webinar, Session 2, 2012
Aquarius is acquiring data all the time, regardless of whether it's flying over land or water. The data from the ocean is read as ocean salinity, while the data over land can be interpreted as soil moisture. We cannot obtain the soil moisture reading if the ground is covered by snow or forest.
Simon Yueh, Aquarius/SMAP Project Scientist, NASA Jet Propulsion Laboratory, 2014 [Interviewer: Chris Howell]


