

- HOME
- SCIENCE
- HIGHLIGHTS
- DATA & MAPS
- DATA FOR YOU
- MEETINGS
Most people see salt as a common seasoning. However, it comes in many forms and serves thousands of roles, from preserving food to manufacturing pharmaceuticals.
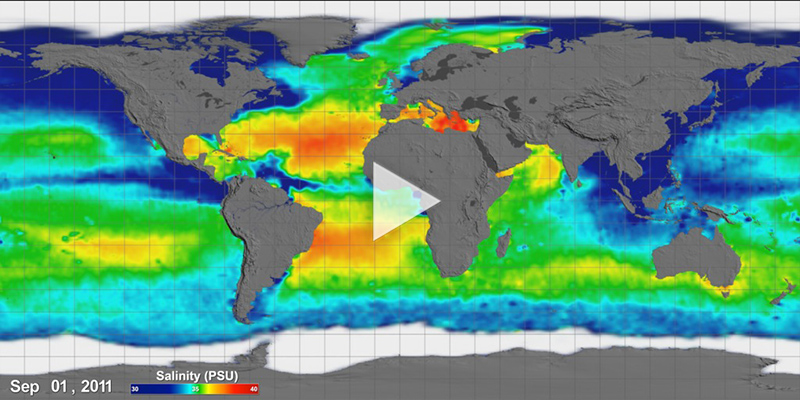
Less commonly known is the role of salt in our ocean. About 3.5% of seawater is dissolved salt, measured as salinity. At the sea surface — where the ocean exchanges water with Earth's atmosphere — salinity is an indicator of water cycle processes. Salinity also plays an active role in driving ocean circulation, helping to distribute heat around the globe and regulate climate.
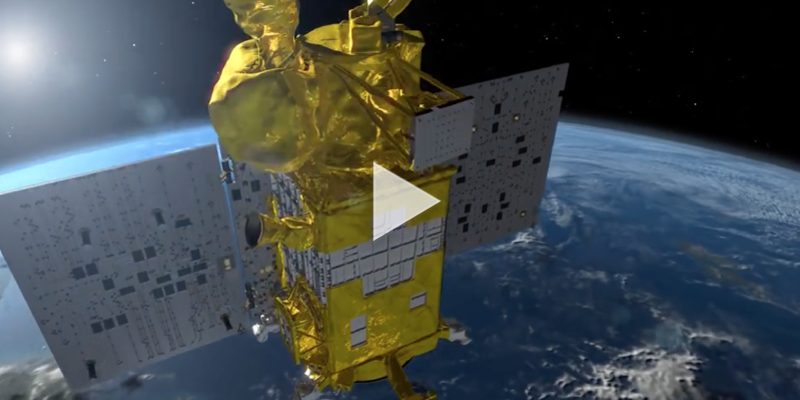
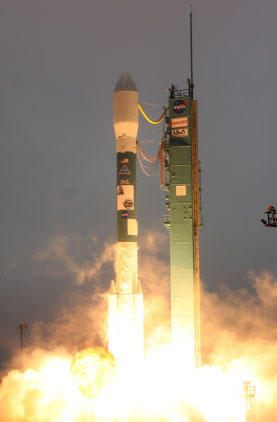
In 2011, NASA launched a pioneering salinity instrument, Aquarius, to study the links between ocean circulation, the global water cycle, and climate. Aquarius was aboard the international Aquarius/Satélite de Aplicaciones Científicas (SAC)-D observatory. The Aquarius/SAC-D mission was a collaboration between NASA and Argentina's space agency, Comisión Nacional de Actividades Espaciales (CONAE).
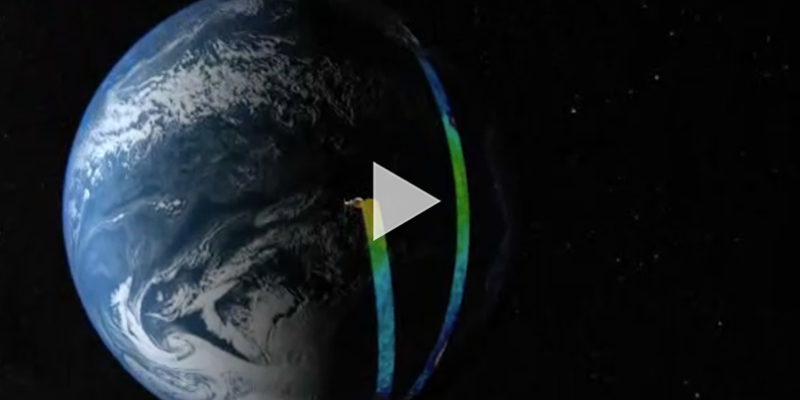
Aquarius made NASA's first space-based global observations of ocean surface salinity, flying 657 kilometers (408 miles) above Earth in a sun-synchronous polar orbit that repeated every seven days. This NASA Earth System Science Pathfinder mission mapped global changes in ocean surface salinity with a resolution of 150 kilometers (93 miles), providing information on how salinity changes from month to month, season to season, and year to year. Aquarius ceased collecting data on 07-Jun-15 when part of the power and attitude control system stopped operating. [Learn more]
As its name suggests, NASA's Soil Moisture Active Passive (SMAP) mission is primarily focused on the water content of soil. However, with a highly sensitive radiometer that operates at 1.413 GHz, SMAP has been detecting sea surface salinity since May 2015. SMAP orbits the earth at 685 kilometers (426 miles) in a sun-synchronous polar orbit that repeats every eight days. Its footprint size is smaller than that of Aquarius, thus it has better spatial resolution (~40 km or 25 mi). However, SMAP 40-km data are noisier than Aquarius data. Thus, some SMAP data products are spatially averaged to larger footprints (60 - 70 km) in order to reduce the noise.
| Measuring Salinity |
|---|
| Absolute salinity is defined as the concentration of dissolved salts in seawater, historically expressed in grams per kilogram or parts per thousand. Determining salinity in traditional ways (e.g., titrating seawater) is very time consuming. Thus, salinity data were sparse prior to satellite-based salinity measurements. |
| Modern oceanography uses the Practical Salinity Scale (PSS) to derive from seawater's electrical conductivity, temperature, and pressure (related to depth). Also used is the Practical Salinity Unit (PSU). Both PSS and PSU are roughly equal to parts per thousand. |
| Extremely sensitive radiometers were built for Aquarius and SMAP to detect subtle changes in the ocean's microwave emission that are caused by salinity. |
| Salinity Patterns |
|---|
| On average, sea surface salinity is about 35 PSS. |
| Over the globe, sea surface salinity varies from 32 to 37 PSS. |
| Salinity variations are caused by precipitation, evaporation, runoff, and ice freezing and melting. |
| Seawater's density – mass per volume – is governed by temperature, salinity, and depth. |
| Ocean circulation below the wind-driven surface (tens to hundreds of meters in depth) is driven by changes in seawater density. |
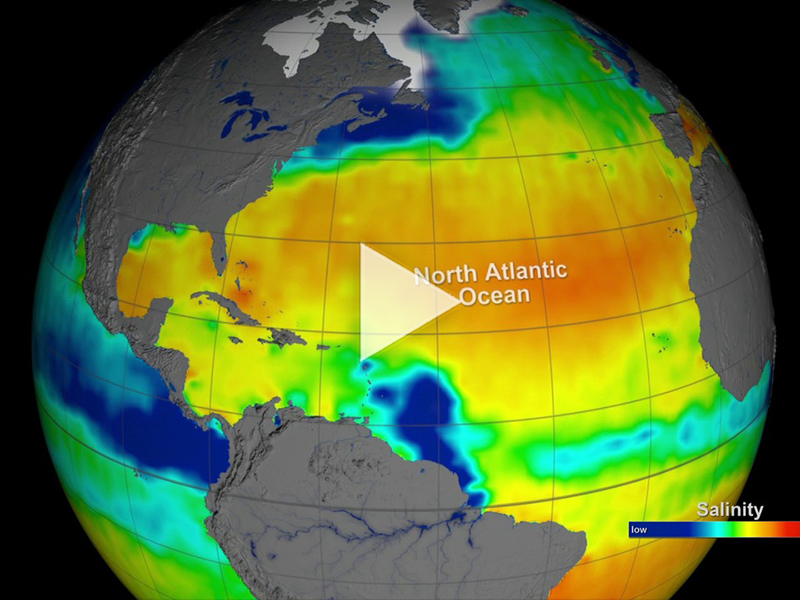
Salinity data have revealed interesting features in the global ocean, including a salty patch of water in the North Atlantic Ocean. Evaporation of water from this area leaves behind large amounts of salt, contributing to a high-salinity region.
Near the equator in the North Pacific Ocean, one of the wettest regions on the planet, heavy rainfall adds an abundance of water to the sea surface. This results in a band of low salinity water off the coast of Central America.
Rivers also influence the amount of salt on the sea surface. At the mouth of the Amazon River, millions of gallons of freshwater flow into the Atlantic Ocean, resulting in a plume of low-salinity water.
At high latitudes, the seasonal melting of sea ice causes a sharp decrease in sea surface salinity. In spring and summer, surface currents in the Labrador Sea transport low salinity water south, where it meets warmer, saltier water carried north by the Gulf Stream.
The waters surrounding the Indian subcontinent vary in salinity due to geography and climate. To the west, an arid climate and lack of freshwater input yields the salty Arabian Sea. To the east, monsoon rains and freshwater outflow from the Ganges River keep the Bay of Bengal far less salty.
Without satellite observations, these global changes would be largely invisible to us. These data are helping scientists to better understand our vast ocean, including how changes in ocean circulation and the water cycle may impact Earth's climate.
