

- HOME
- SCIENCE
- HIGHLIGHTS
- DATA & MAPS
- DATA FOR YOU
- MEETINGS
Since Aquarius began taking salinity measurements in August 2011 and SMAP continued NASA's salinity observations, scientists have been using this "key piece of the ocean puzzle" to better understand Earth's water cycle and oceanographic features. Salinity data are revealing how extreme floods impact our seas and low-salinity river plumes affect hurricane intensity. Seasonal monsoons are being monitored using salinity and soil moisture data from NASA. Tropical oceans are being intensely studied, challenging the classical notion that ocean surface salinity is a simple "rain gauge," uncovering important details about the ocean motion's near the equator, and providing compelling insights on phenomena such as salinity fronts.
Aquarius captured the impact of a record-flooding event of the Mississippi River and the subsequent interaction with circulation in the Gulf of Mexico.
The Mississippi River is the largest river in North America, draining about 41% of the contiguous U.S. More than half of the freshwater input into the Gulf of Mexico comes from the Mississippi River. River discharge in the northern Gulf shows significant seasonal variability and affects general ocean circulation and ecology of the Gulf.
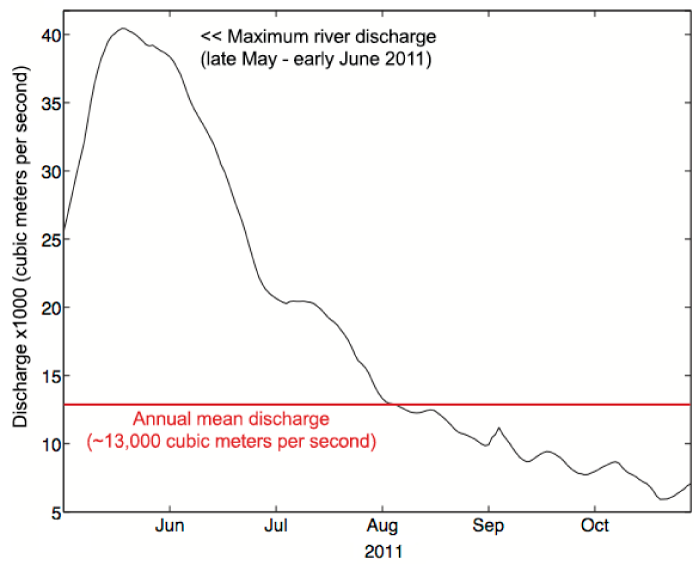
In May 2011, record-breaking floods occurred in the central U.S. caused by excessive precipitation from major storm systems along with extensive snowmelt. As a result, the Mississippi River and many of its tributaries reached record levels, impacting people in several states. Figure 1 shows the daily mean Mississippi River discharge into the northern Gulf of Mexico from May through October 2011, based on data from the U.S. Geological Survey's Baton Rouge, LA station.
Aquarius data collection began in late August 2011 and captured part of this discharge event in the Gulf of Mexico. As shown in Figures 2a and 2b, Aquarius data show low salinity values (purple) in the northeastern Gulf from August-September 2011, about three to four months after peak discharge. Five months after peak discharge (i.e., October 2011), the low salinity signature from the flooding event was no longer visible in Aquarius data (Figure 2c).
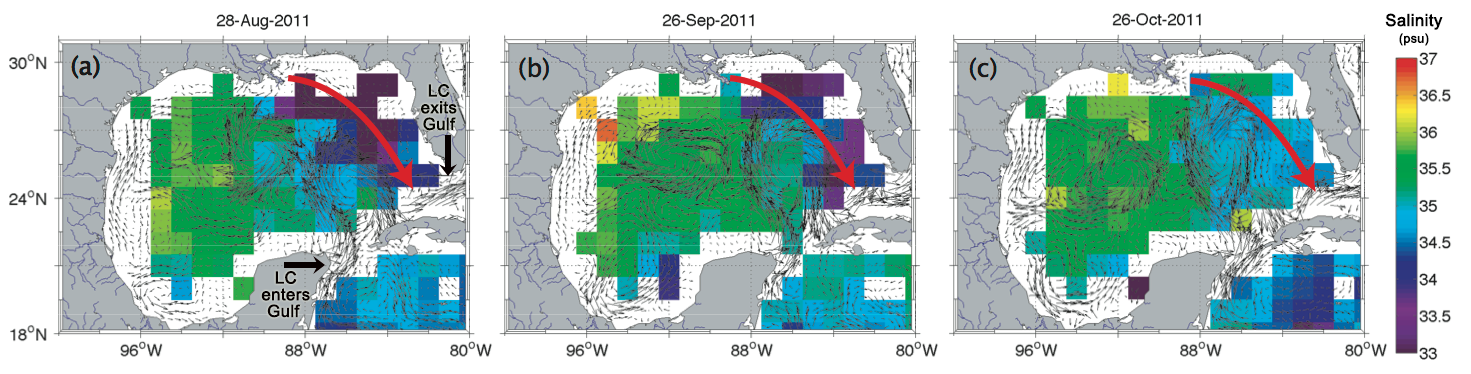
The observed salinity patterns are the result of seasonal winds and circulation in the Gulf of Mexico. From August to September 2011, winds blowing from the south/southwest helped to confine low-salinity water that originated from the Mississippi River along the coasts of Mississippi, Alabama, and Florida. Over time, this low-salinity water interacted with ocean currents, shown as thin arrows in Figure 2 (from OSCAR).
The Loop Current (LC) is the dominant circulation feature in the eastern Gulf of Mexico. It enters between the Yucatan Peninsula and Cuba and exits the Gulf between Florida and Cuba (Fig. 2a). The Loop Current and its associated eddies helped transport the relatively fresh water out of the Gulf by October 2011, as shown by red arrows in Figure 2.
From May to October 2011, a deluge of freshwater travelled from atmosphere over land and into the ocean ... a journey that Aquarius data helped scientists to understand.
Aquarius observed the impact of Hurricane Katia in 2011 on the salinity of the Amazon plume in the wake of the hurricane due to ocean mixing caused by hurricane winds. This was the first space-borne observation of the effect of hurricanes on ocean salinity.
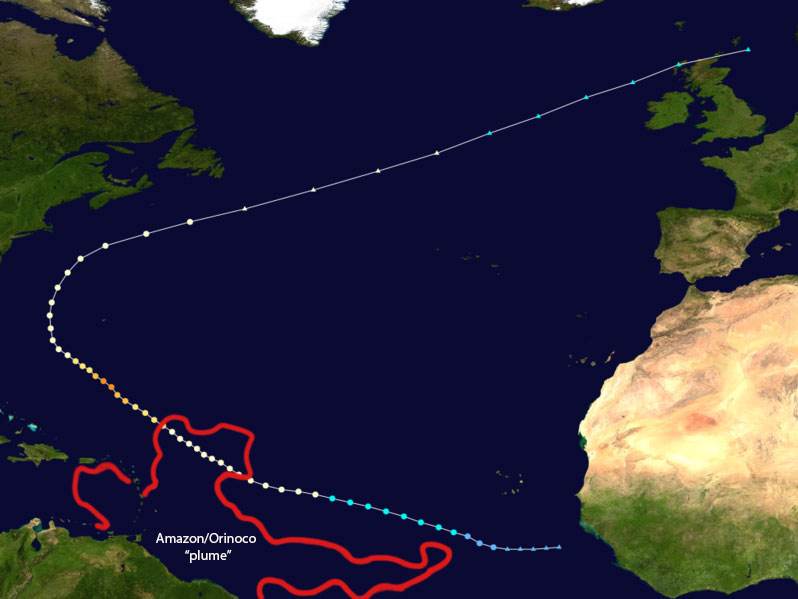
Along with sea surface temperature, satellite-derived Aquarius and Salinity Moisture and Ocean Salinity (SMOS) data are being used to better understand how the ocean contributes to hurricanes. A key area of research is interest where the Amazon and Orinoco Rivers flow into the Atlantic Ocean. At seasonal peak, these rivers create a plume of low salinity water that is more than 1 meter (3.3 feet) deep and covers a million square kilometers (over 380,000 square miles). This plume creates a barrier layer that inhibits ocean mixing and warms the sea surface to over 29 degrees Celsius (84.2 degrees Fahrenheit). Such warming helps to fuel hurricanes, producing nearly 50% increase in intensification rate.
In September 2011, soon after the Aquarius instrument began collecting data, Hurricane Katia crossed the Amazon/Orinoco plume. Usually, ocean mixing by hurricane winds brings deep, cold water to the surface, leaving a distinct trace (or "wake") of low sea surface temperature. However, Hurricane Katia's effect on sea surface temperature was much weaker inside the plume than outside of it. Sea surface salinity inside the plume, on the other hand, showed a strong increase in the wake of Hurricane Katia: a rise of 1.5 practical salinity units (equivalent to 1.5 parts per thousand) that covered over 100,000 square kilometers (over 38,000 square miles).
The unusual post-hurricane conditions inside of river plumes - higher-than-expected temperatures and salinities - are thought to be related to the energy needed to break down barrier layers. In these areas, hurricane winds are less efficient at bringing deeper, colder water to the surface. The end result is warmer water at the ocean surface, helping to intensify hurricanes. In fact, scientists have calculated that about 68% of hurricanes that eventually reached Category 5 crossed the Amazon/Orinoco plume during their journey. Thes results strongly suggest that salinity's role in ocean layering and mixing should be taken into account when forecasting hurricane growth. The global coverage by Aquarius is a key factor in making improved hurricane forecasts a practical reality.
Want to learn more about river plumes and hurricane intensity? Watch this movie.
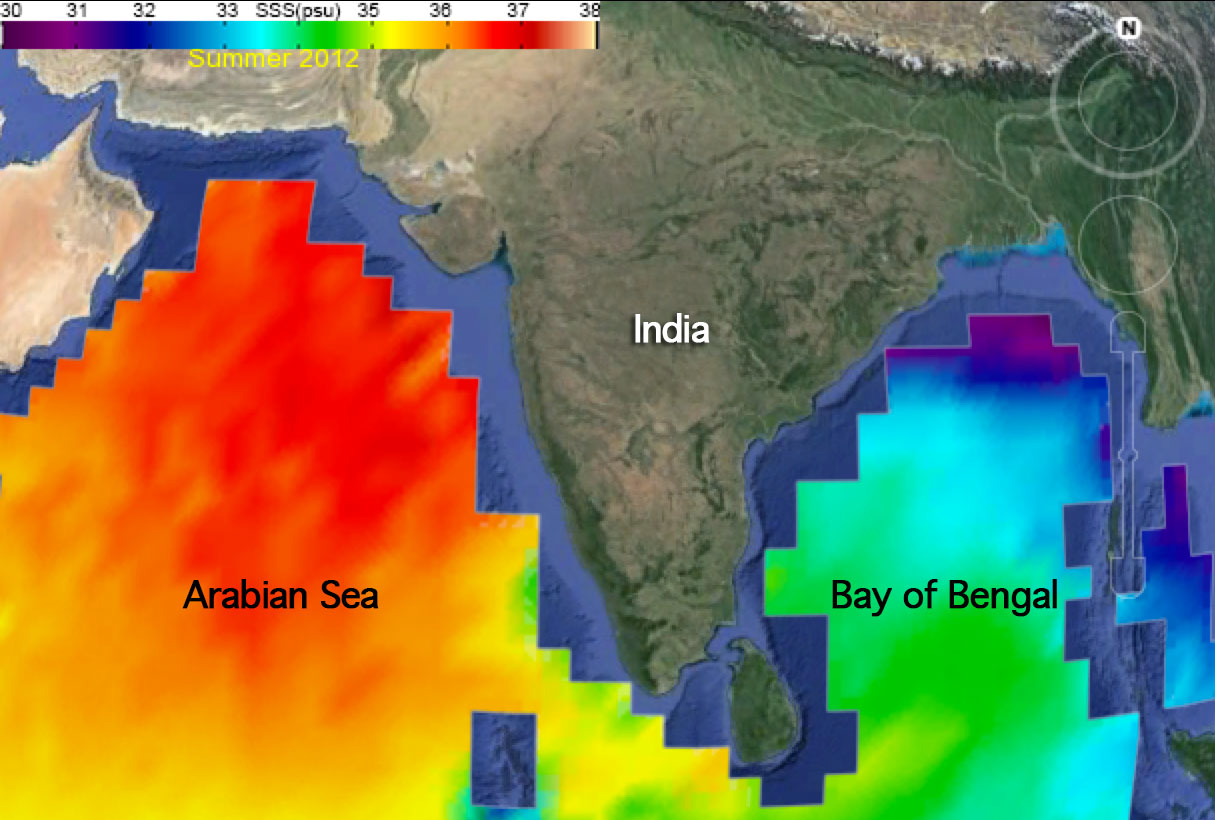
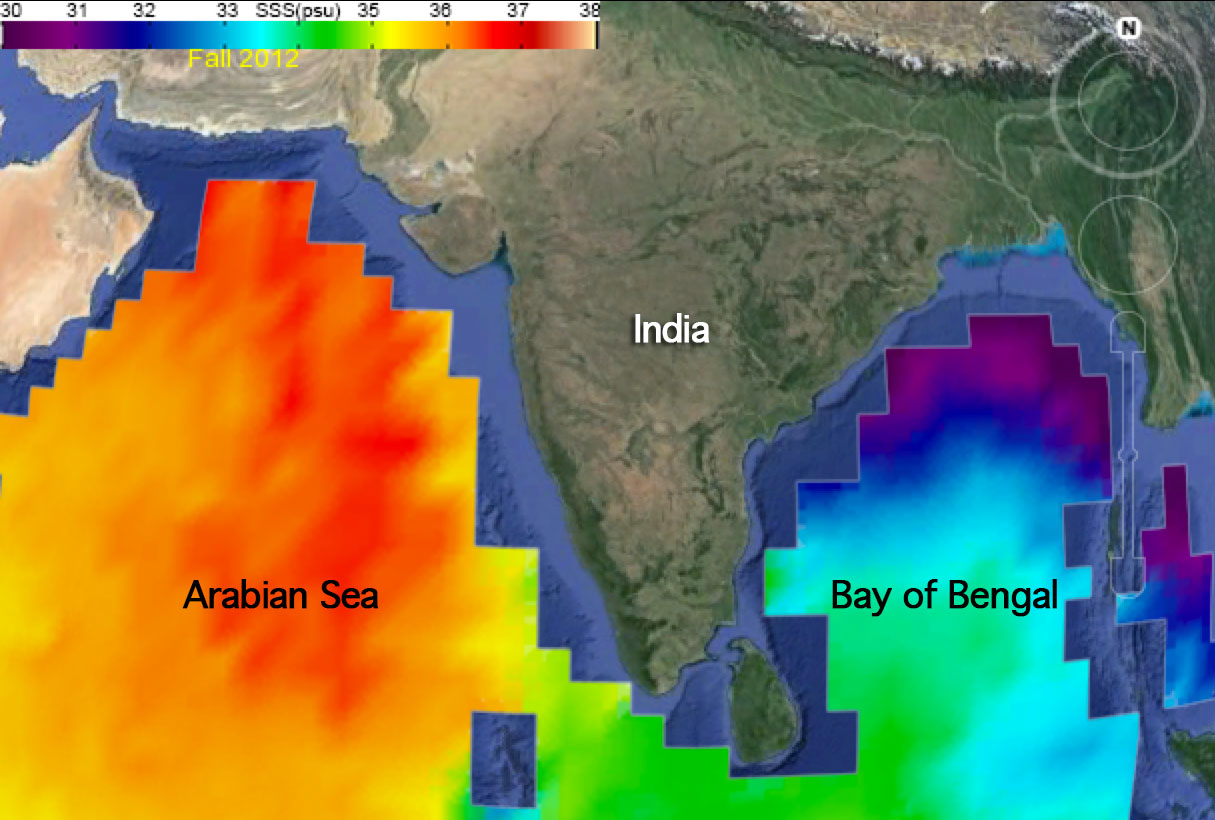
Aquarius maps of ocean surface salinity show seasonal variation in the waters surrounding the Indian subcontinent, which is due to geography and climate. Figure 4 shows that to the west, an arid climate and lack of freshwater input results in a salty Arabian Sea, while to the east, monsoon rains and freshwater outflow from the Ganges River keep the Bay of Bengal far less salty.
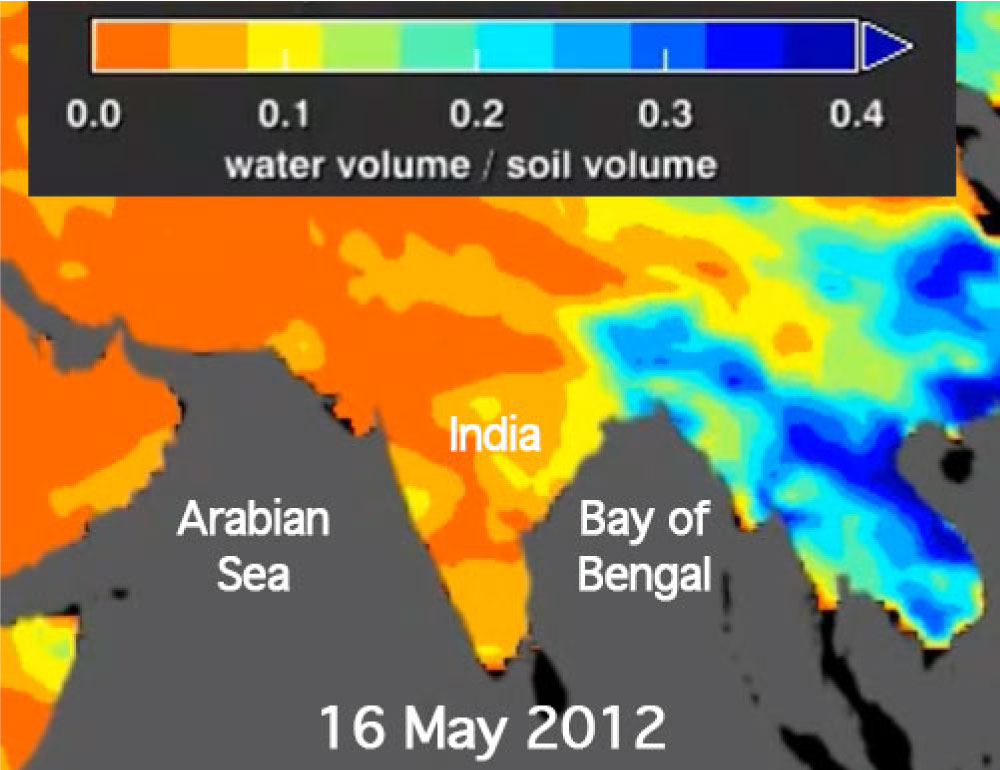
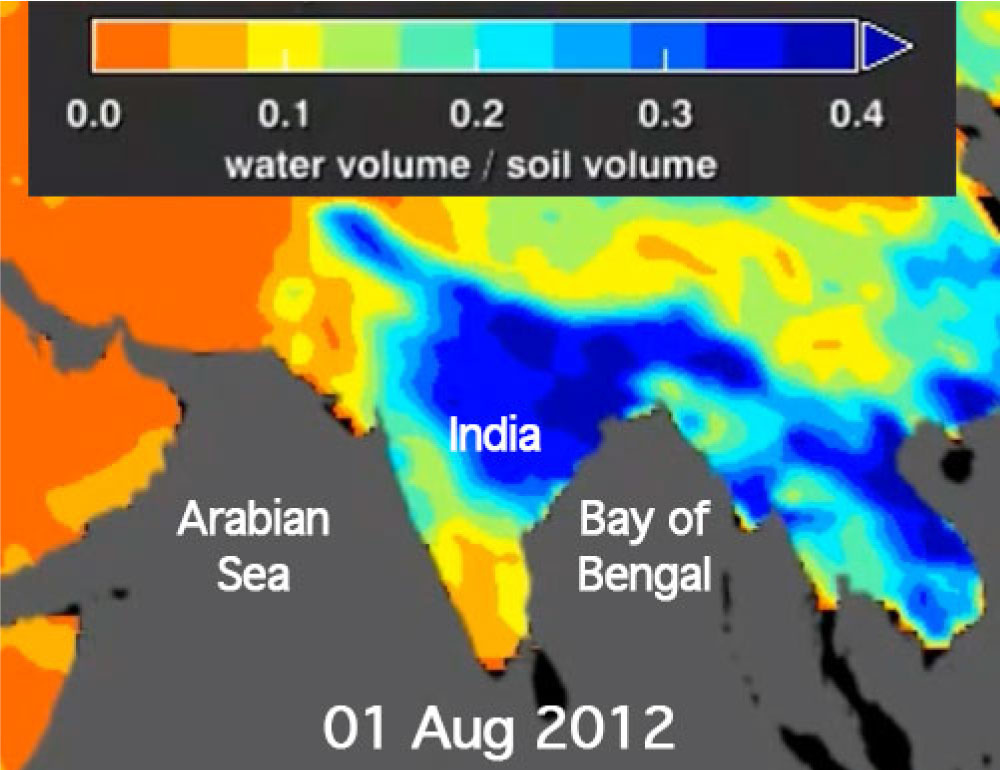
Aquarius and SMAP have also been used to monitor global soil moisture conditions. Soil moisture products, derived from Aquarius's L-band horizontally polarized brightness temperature observations, were first made available by the National Snow and Ice Data Center (NSIDC) in December 2012. For example, Figure 5 shows two Aquarius soil moisture maps centered on the Indian subcontinent: one from May 2012; the other from August 2012. The map from May is marked by dry soil conditions in India, while the map from August shows saturated conditions from monsoon rains. The Aquarius soil moisture product is available from NSIDC. Maps of monthly soil moisture are available in the Aquarius and SMAP Galleries.
Want to learn more about how NASA measures soil moisture? Read this article.
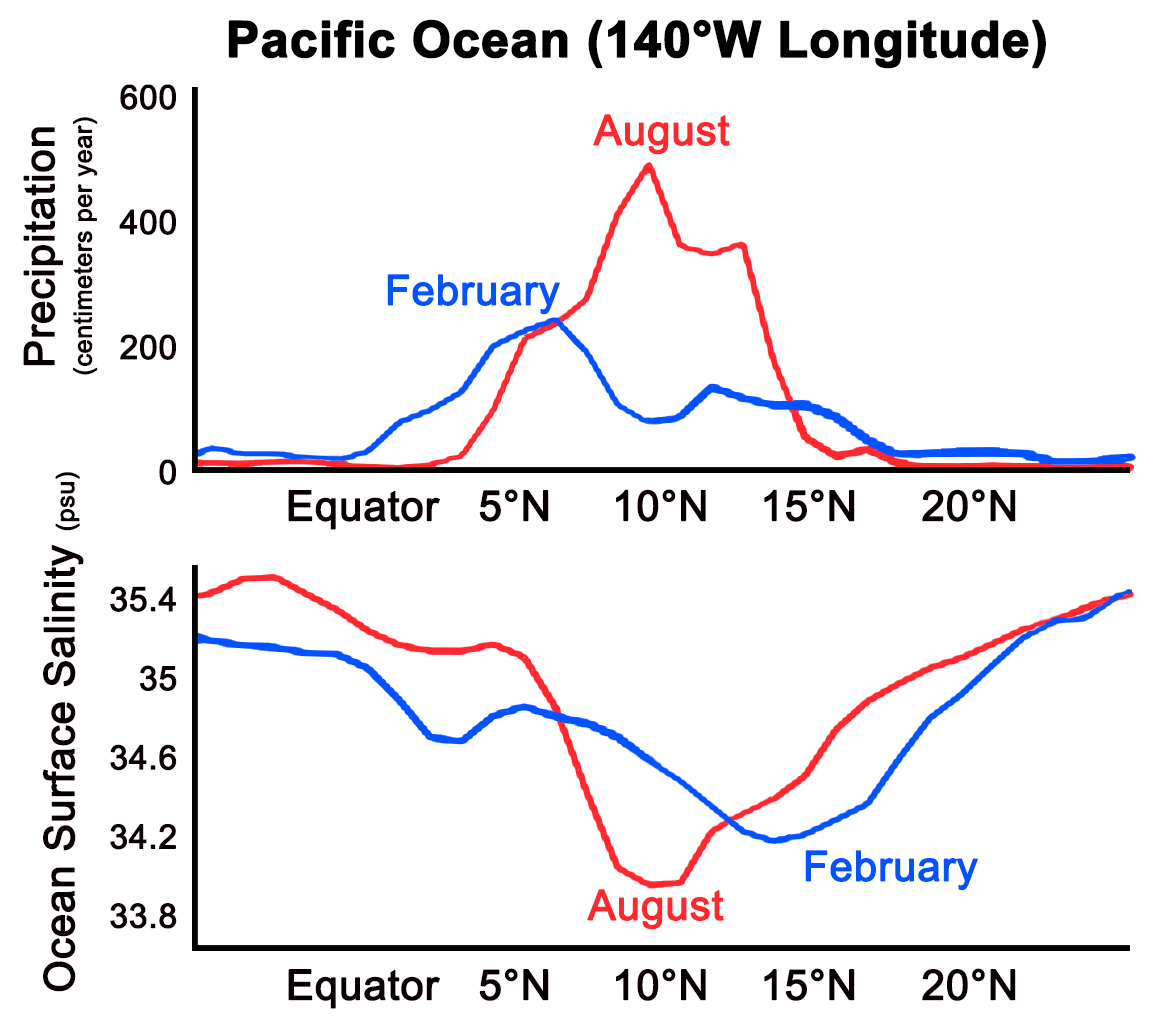
It has long been thought that in some regions - such as tropical rain bands in the Pacific Ocean - patterns of rainfall and salinity are very closely correlated. In this "ocean rain gauge" scenario, areas of high precipitation would have low ocean salinity because fresh rainwater dilutes the saltiness of the sea surface.
However, Aquarius-based scientific investigations revealed that, depending on the region and time of year, ocean surface salinity is not only affected by tropical rainfall but also by ocean circulation. An example is shown in Figure 6, which shows data from the Pacific Ocean along 140°W longitude, from the equator to 20 degrees north latitude. The upper figure shows precipitation and the lower figure shows ocean surface salinity. In both figures, blue data are from February and red data are from August.
If ocean surface salinity is truly an "ocean rain gauge", then high precipitation should correlate with low salinity. Figure 6 shows that this is indeed true during the month of August (red line). In February, however, maximum precipitation is offset from the minimum salinity by about 800 kilometers (497 miles), due to the motion of ocean currents.
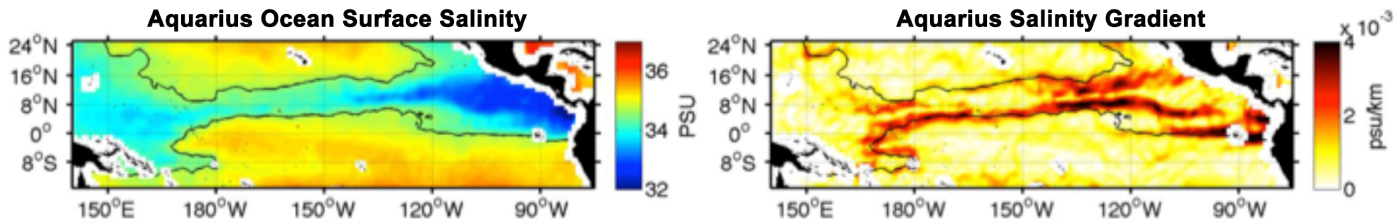
Aquarius data showed better-than-expected alignment with ocean circulation features, including eddies with diameters from tens-to-hundreds of kilometers that can persist from days to weeks. Early results from the eastern tropical Pacific indicated that the motion of low-salinity features correspond closely with ocean surface currents derived from other satellites measuring sea surface height and ocean winds (Figure 7). This level of detail of sea surface dynamical structure cannot be resolved with traditional salinity observations, emphasizing Aquarius's important role in monitoring ocean features to better understand their role in climate.
This promising early scientific result from Aquarius motivated scientists to take a new look at a category of major oceanic features - thousands of kilometers in length - known as "Tropical Instability Waves" (TIWs). These westward-traveling waves have been recognized for decades as north-south deflections in the tongues of cool water that extend along the equator, off the west coasts of Africa (Atlantic) and South America (Pacific). The cool tongue of seawater in the equatorial Pacific, for example, covers one-quarter of Earth's circumference. In this vast region, TIW activity has been associated with regions of localized high phytoplankton productivity and accumulations of marine organisms.
Although TIWs have been studied extensively using sea surface height and temperature data, Aquarius sea surface salinity measurements were instrumental in understanding their behavior very close to the equator. These sea surface salinity studies have revealed that TIWs at the equator can travel twice as fast (i.e,. 1 meter per second or 2.2 miles per hour) as those away from the equator. This previously unknown characteristic has significant implications for how these waves interact with ocean currents to redistribute seawater's heat, salt, nutrients, and carbon.
Salinity "fronts" - boundaries that separate water masses of different salinity levels - are commonly found where freshwater flows into the salty ocean (e.g., near river mouths). For example, in the western Pacific Ocean, an area closely tied to El Niño conditions, salinity fronts may affect important dynamics between the ocean and atmosphere.
Want to learn more about TIWs? Watch this video presentation.