- HOME
- SCIENCE
- HIGHLIGHTS
- DATA & MAPS
- DATA FOR YOU
- MEETINGS
Collecting science data in the Beaufort Sea is challenging, even when the weather is at its best. Many people are involved: researchers, crews for two ships (R/V Woldstad and smaller R/V Ukpik for pre-cruise deployment of Wave Gliders) and an airplane. So, it's important to be aware of conditions at sea and in the air... but being aware isn’t easy!
Downloading environmental data each day will be hampered by relatively slow internet, which is standard while onboard ships. Other challenges aren’t related to technology at all. For example, data cannot be collected in Canadian waters (and, believe it or not, there’s a border dispute between the U.S. and Canada in this region). Also, the SASSIE team is working with the Alaska Eskimo Whaling Commission to ensure that the southern extent of their research area doesn't conflict with hunting grounds where Indigenous Alaskans hunt bowhead whales.
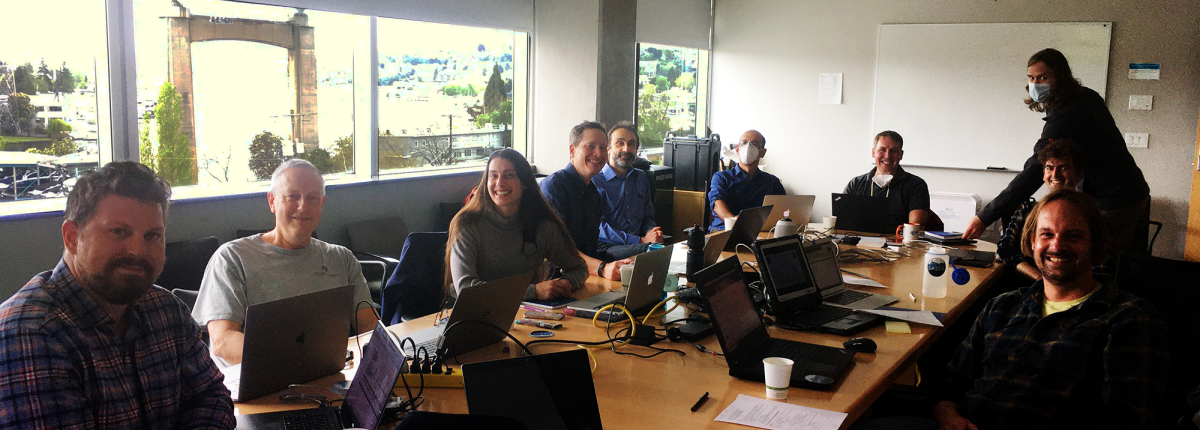
With all of this in mind, more than 20 SASSIE investigators met at the University of Washington (in person and online) during early May 2022. Participants included several veterans of Arctic oceanographic cruises and salinity-focused campaigns, Salinity Processes in the Upper-ocean Regional Study (SPURS). Their shared "lessons learned" were valuable for cruise planning, as was the direct participation of Scott Hameister (Support Vessels of Alaska, Inc.).
The first day was dedicated to learning about the full suite of SASSIE instruments, including detailed capabilities and requirements. This information led the group to formulate a set of deployment and survey options in the form of a "playbook" on the second day of the meeting. Any given "play" might last from a day to a week or longer and could target a feature or condition. A detailed version of the playbook includes specific instruments, collection patterns, timing and measurement scales, etc. The playbook will continue to be updated prior to and during the campaign.
On the third day, the team conducted a "Virtual Cruise" exercise. This was designed to give the SASSIE team practice in optimizing science returns under changing environmental conditions. Much of the conversation focused on practical factors affecting sampling such as ship speed (10 knots or 11.5 mph in ice-free conditions) and potential reach of the NASA airplane, which flies at 250 km (~155 mi) per hour but must transit back to its base (TBD location in Alaska) each evening.
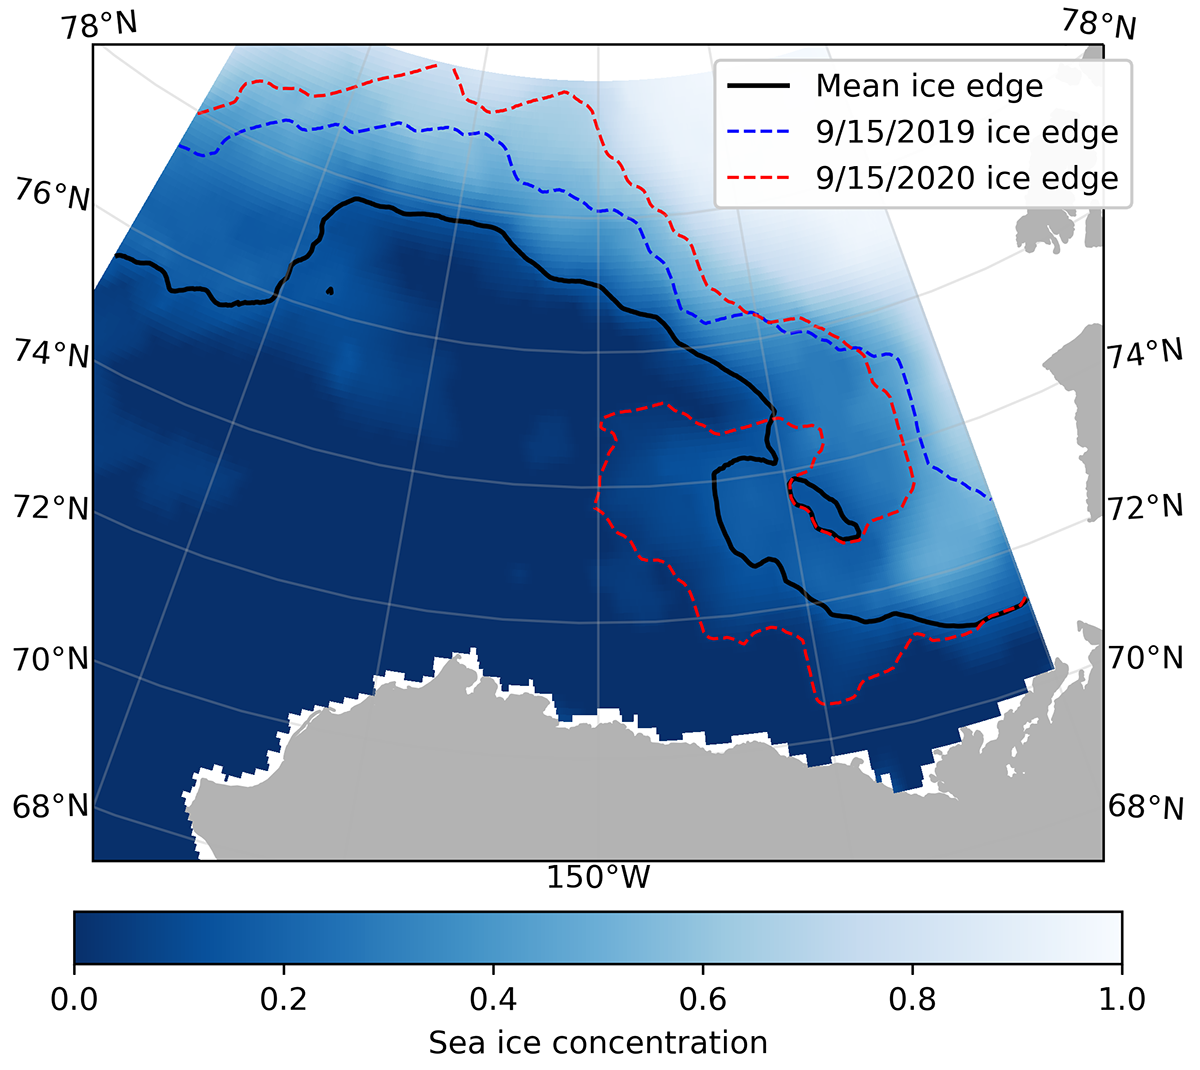
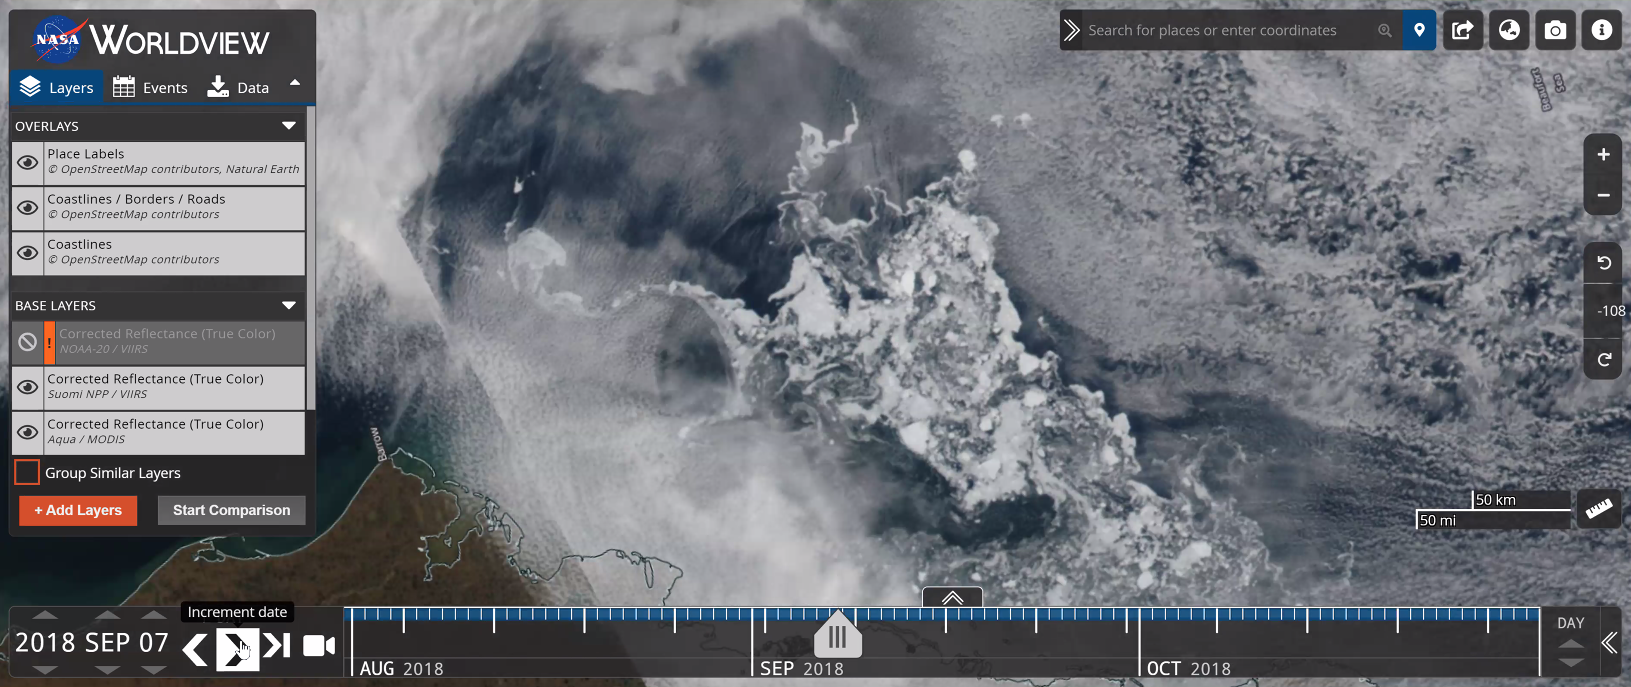
For the ships and ocean-borne SASSIE instruments, the most important factor is the extent and thickness of sea ice. What makes this particularly tricky is that the team wants to find where ice has recently melted – or is about to refreeze – without getting stuck in it if conditions change… which can happen quickly in the Beaufort Sea! This point was made clear when the day-to-day conditions from mid-August to early October 2018 were used as the framework for the "Virtual Cruise." SASSIE scientists used daily environmental products from this time period - e.g., daily sea ice charts from the US National Ice Center and NASA Worldview imagery - to draft a high-level schedule. The schedule takes into account deploying and recovering various SASSIE instruments, surveying the field area, transiting to/from sampling sites, etc. But perhaps more important, developing the schedule helped the team hone the planning skills that will be used to optimize SASSIE's science impact!
| High-level Schedule Based on "Virtual Cruise" Exercise | |||||
|---|---|---|---|---|---|
| Prudhoe Bay, AK | Nome, AK | Transit | Ice Bay & TBD Ice Edge Locations | Asset Recovery | Transit to Nome, AK |
| Deploy Wave Gliders from R/V Ukpik | R/V Woldstad depart | Touch base with whalers, start underway CTD | Deploy drifters, buoys, SWIFTs and Under Ice Float. Survey with ship-based sensors, Jet-SSP and drones. Conduct four aircraft surveys. Collect data for calibration/ validation. Choose sampling strategy following the playbook and based on local conditions. | Recover Wave Gliders & Under Ice Float | |