- HOME
- SCIENCE
- HIGHLIGHTS
- DATA & MAPS
- DATA FOR YOU
- MEETINGS

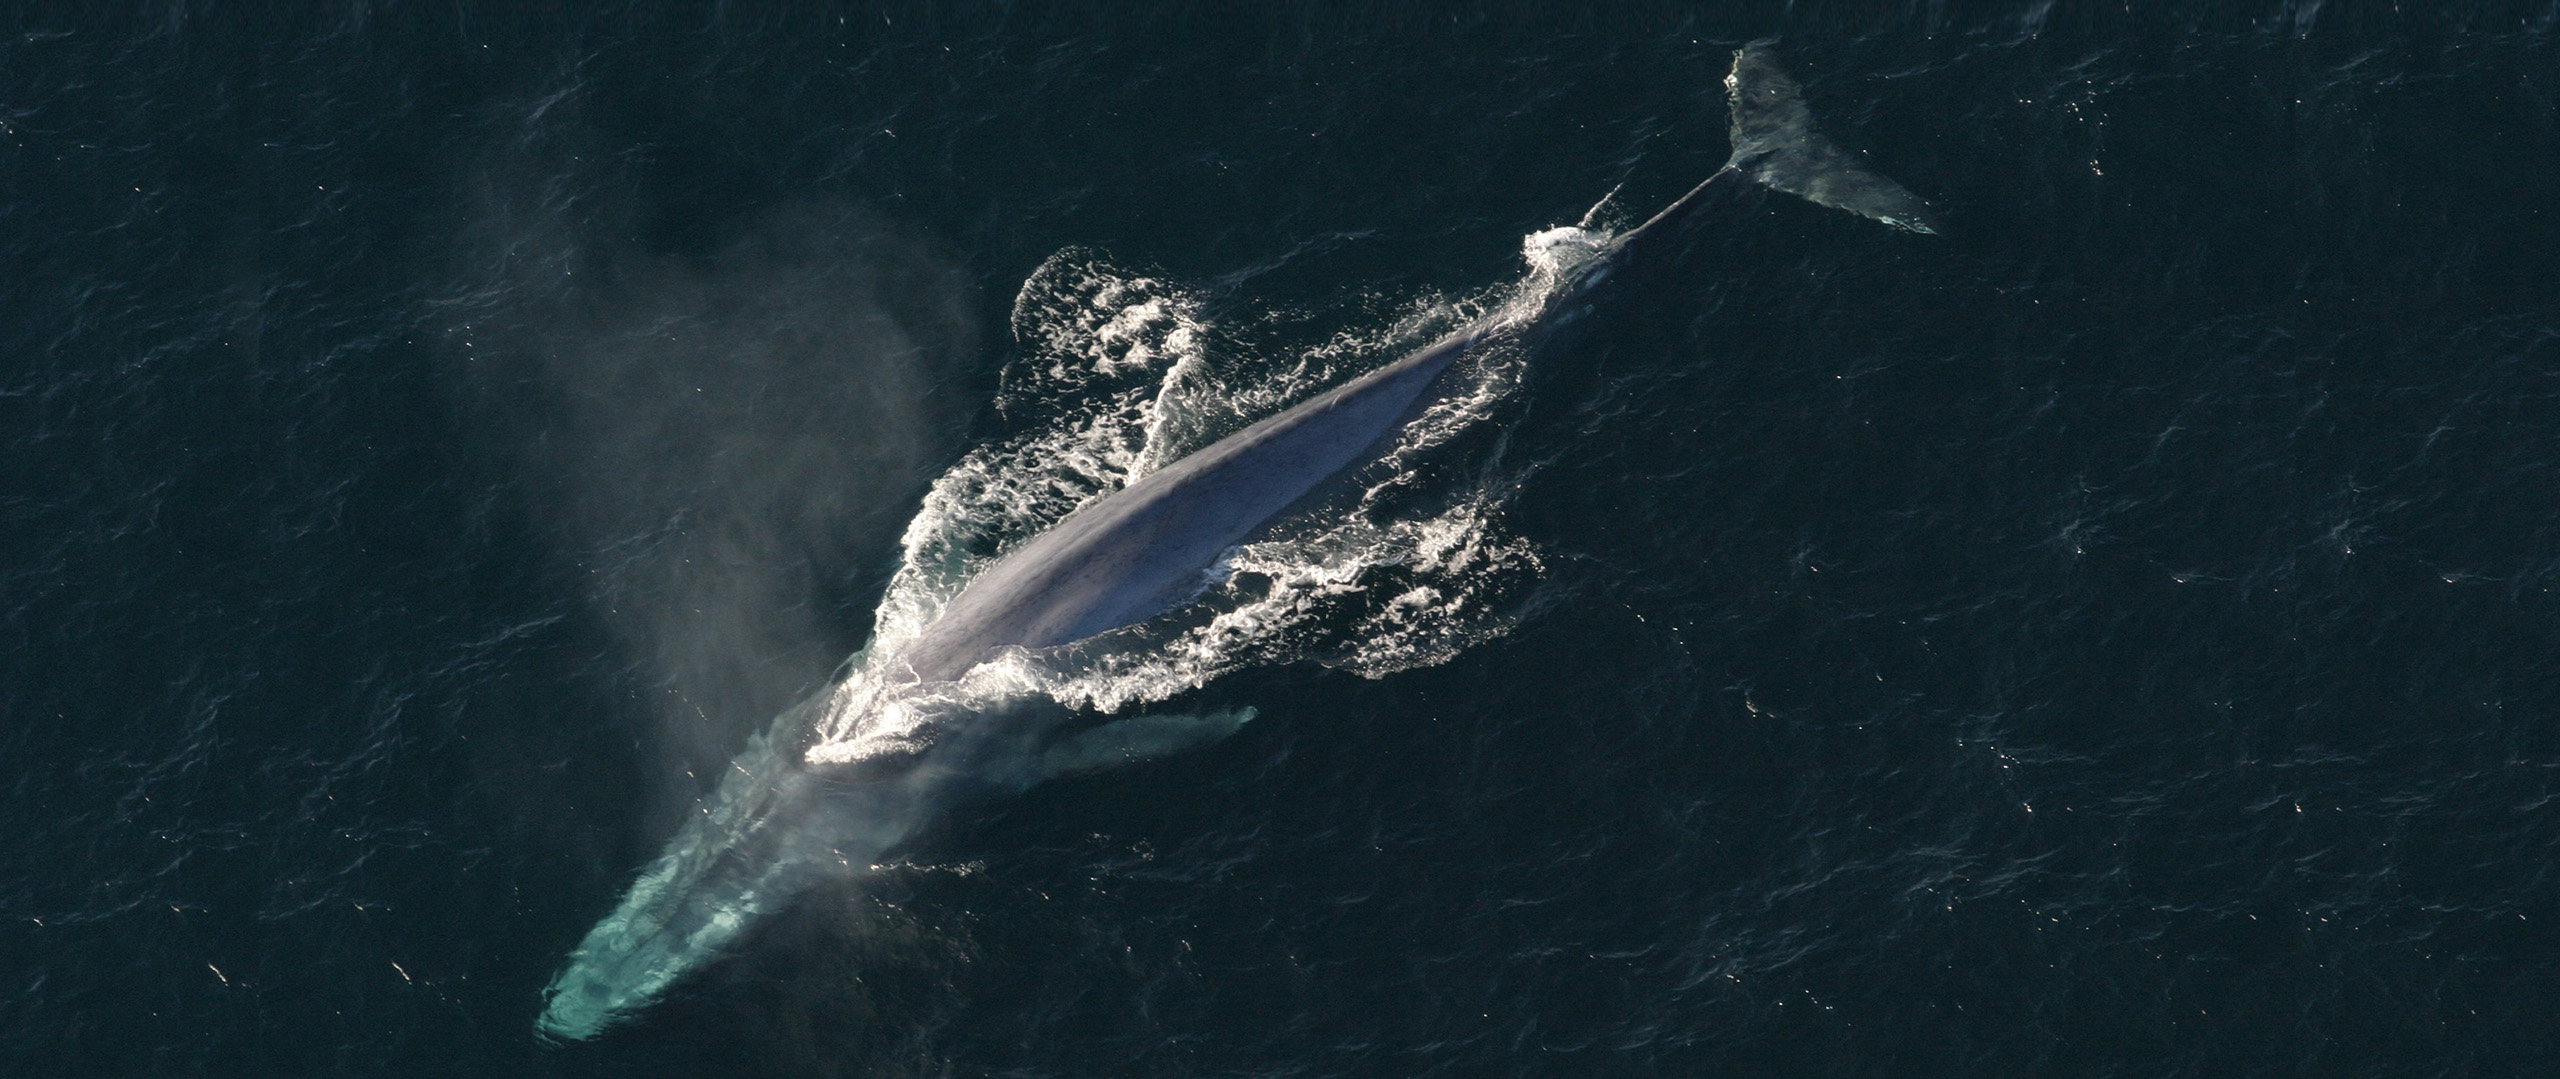
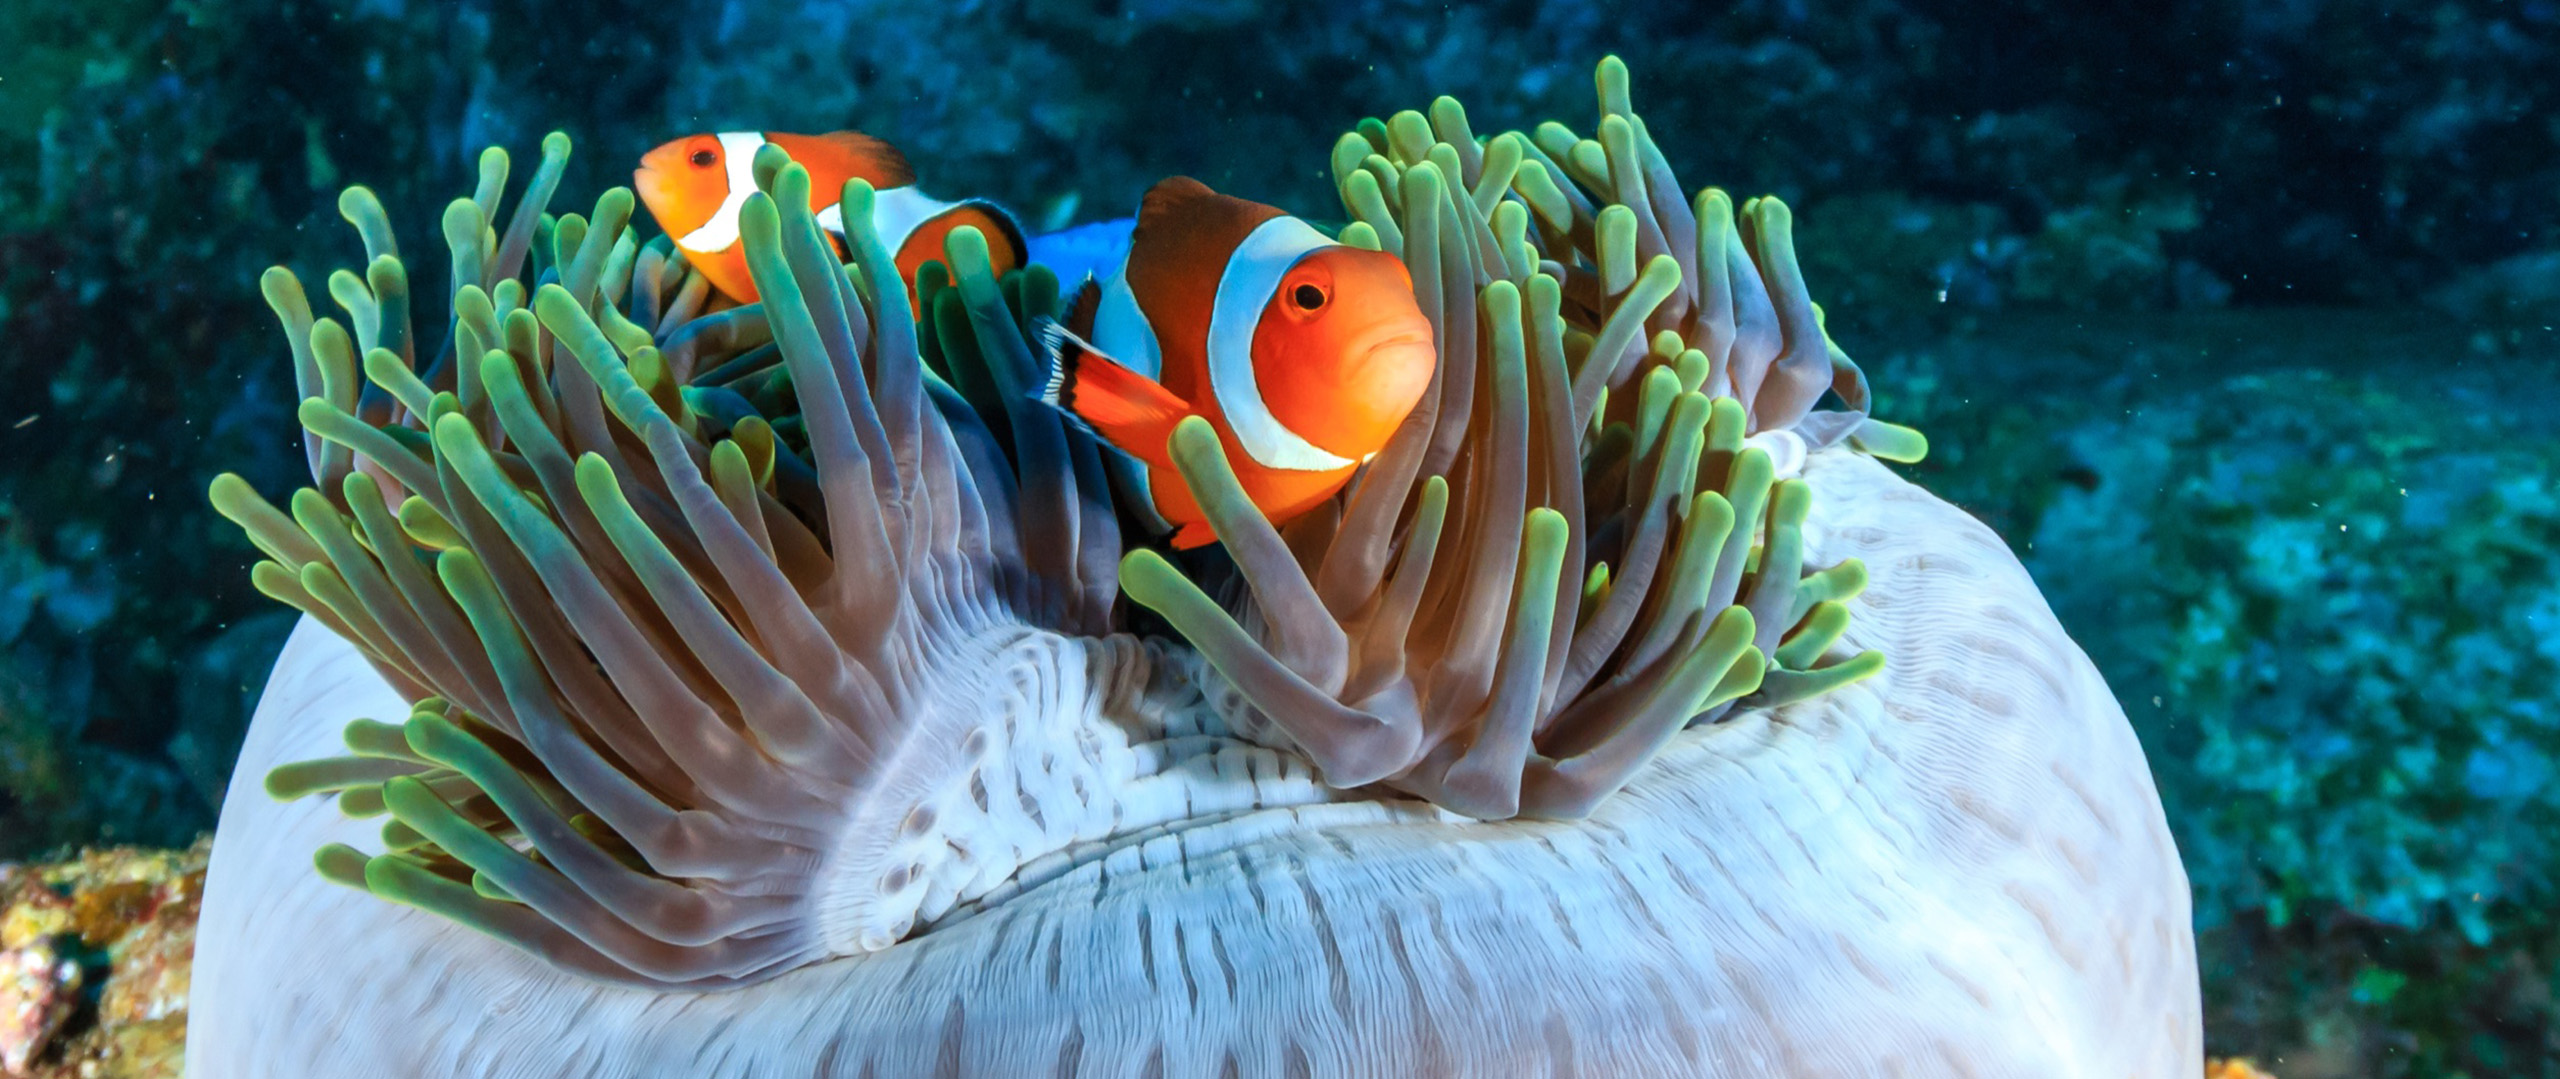
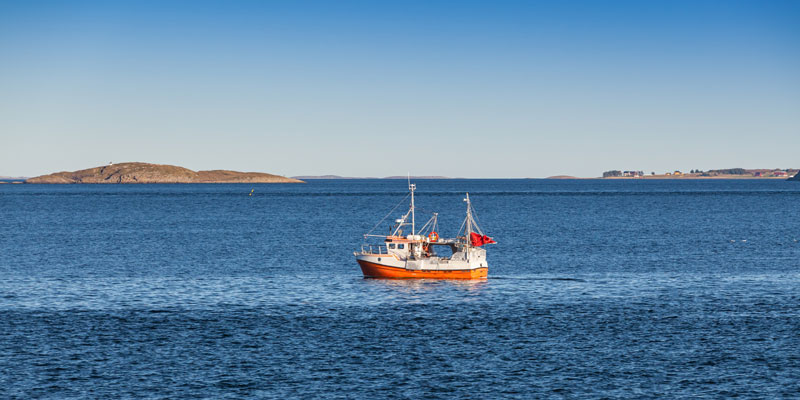
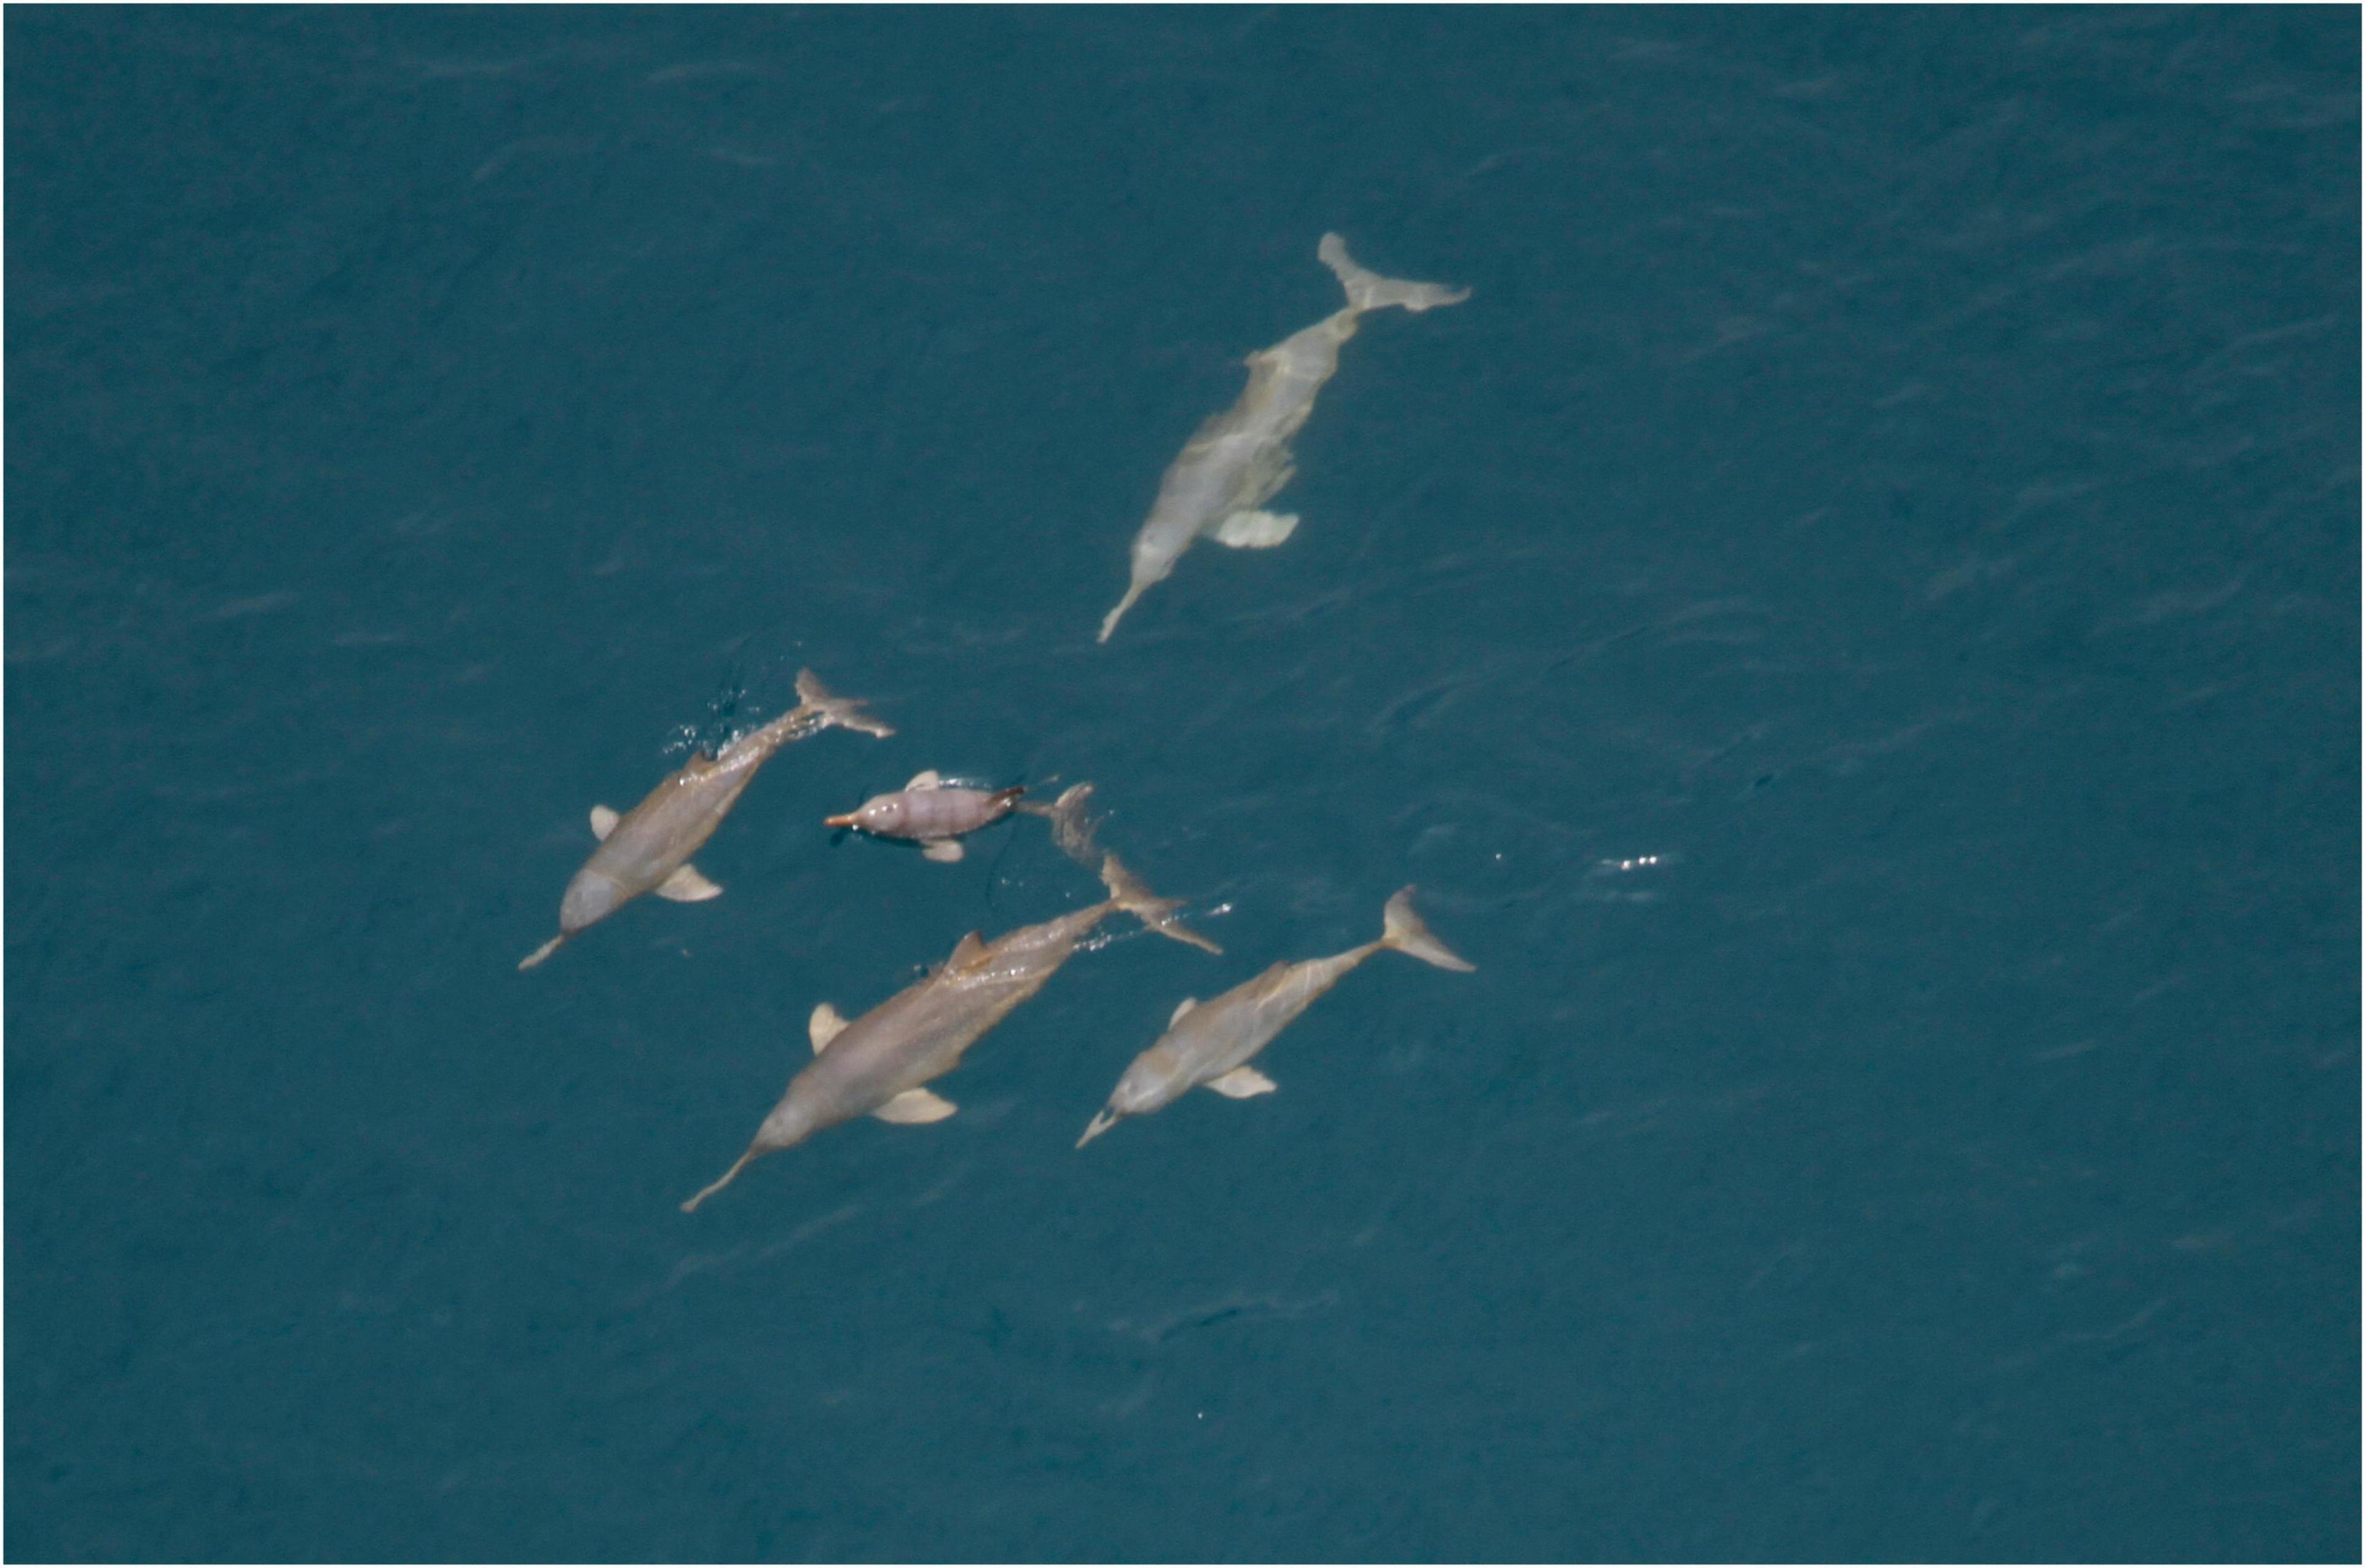
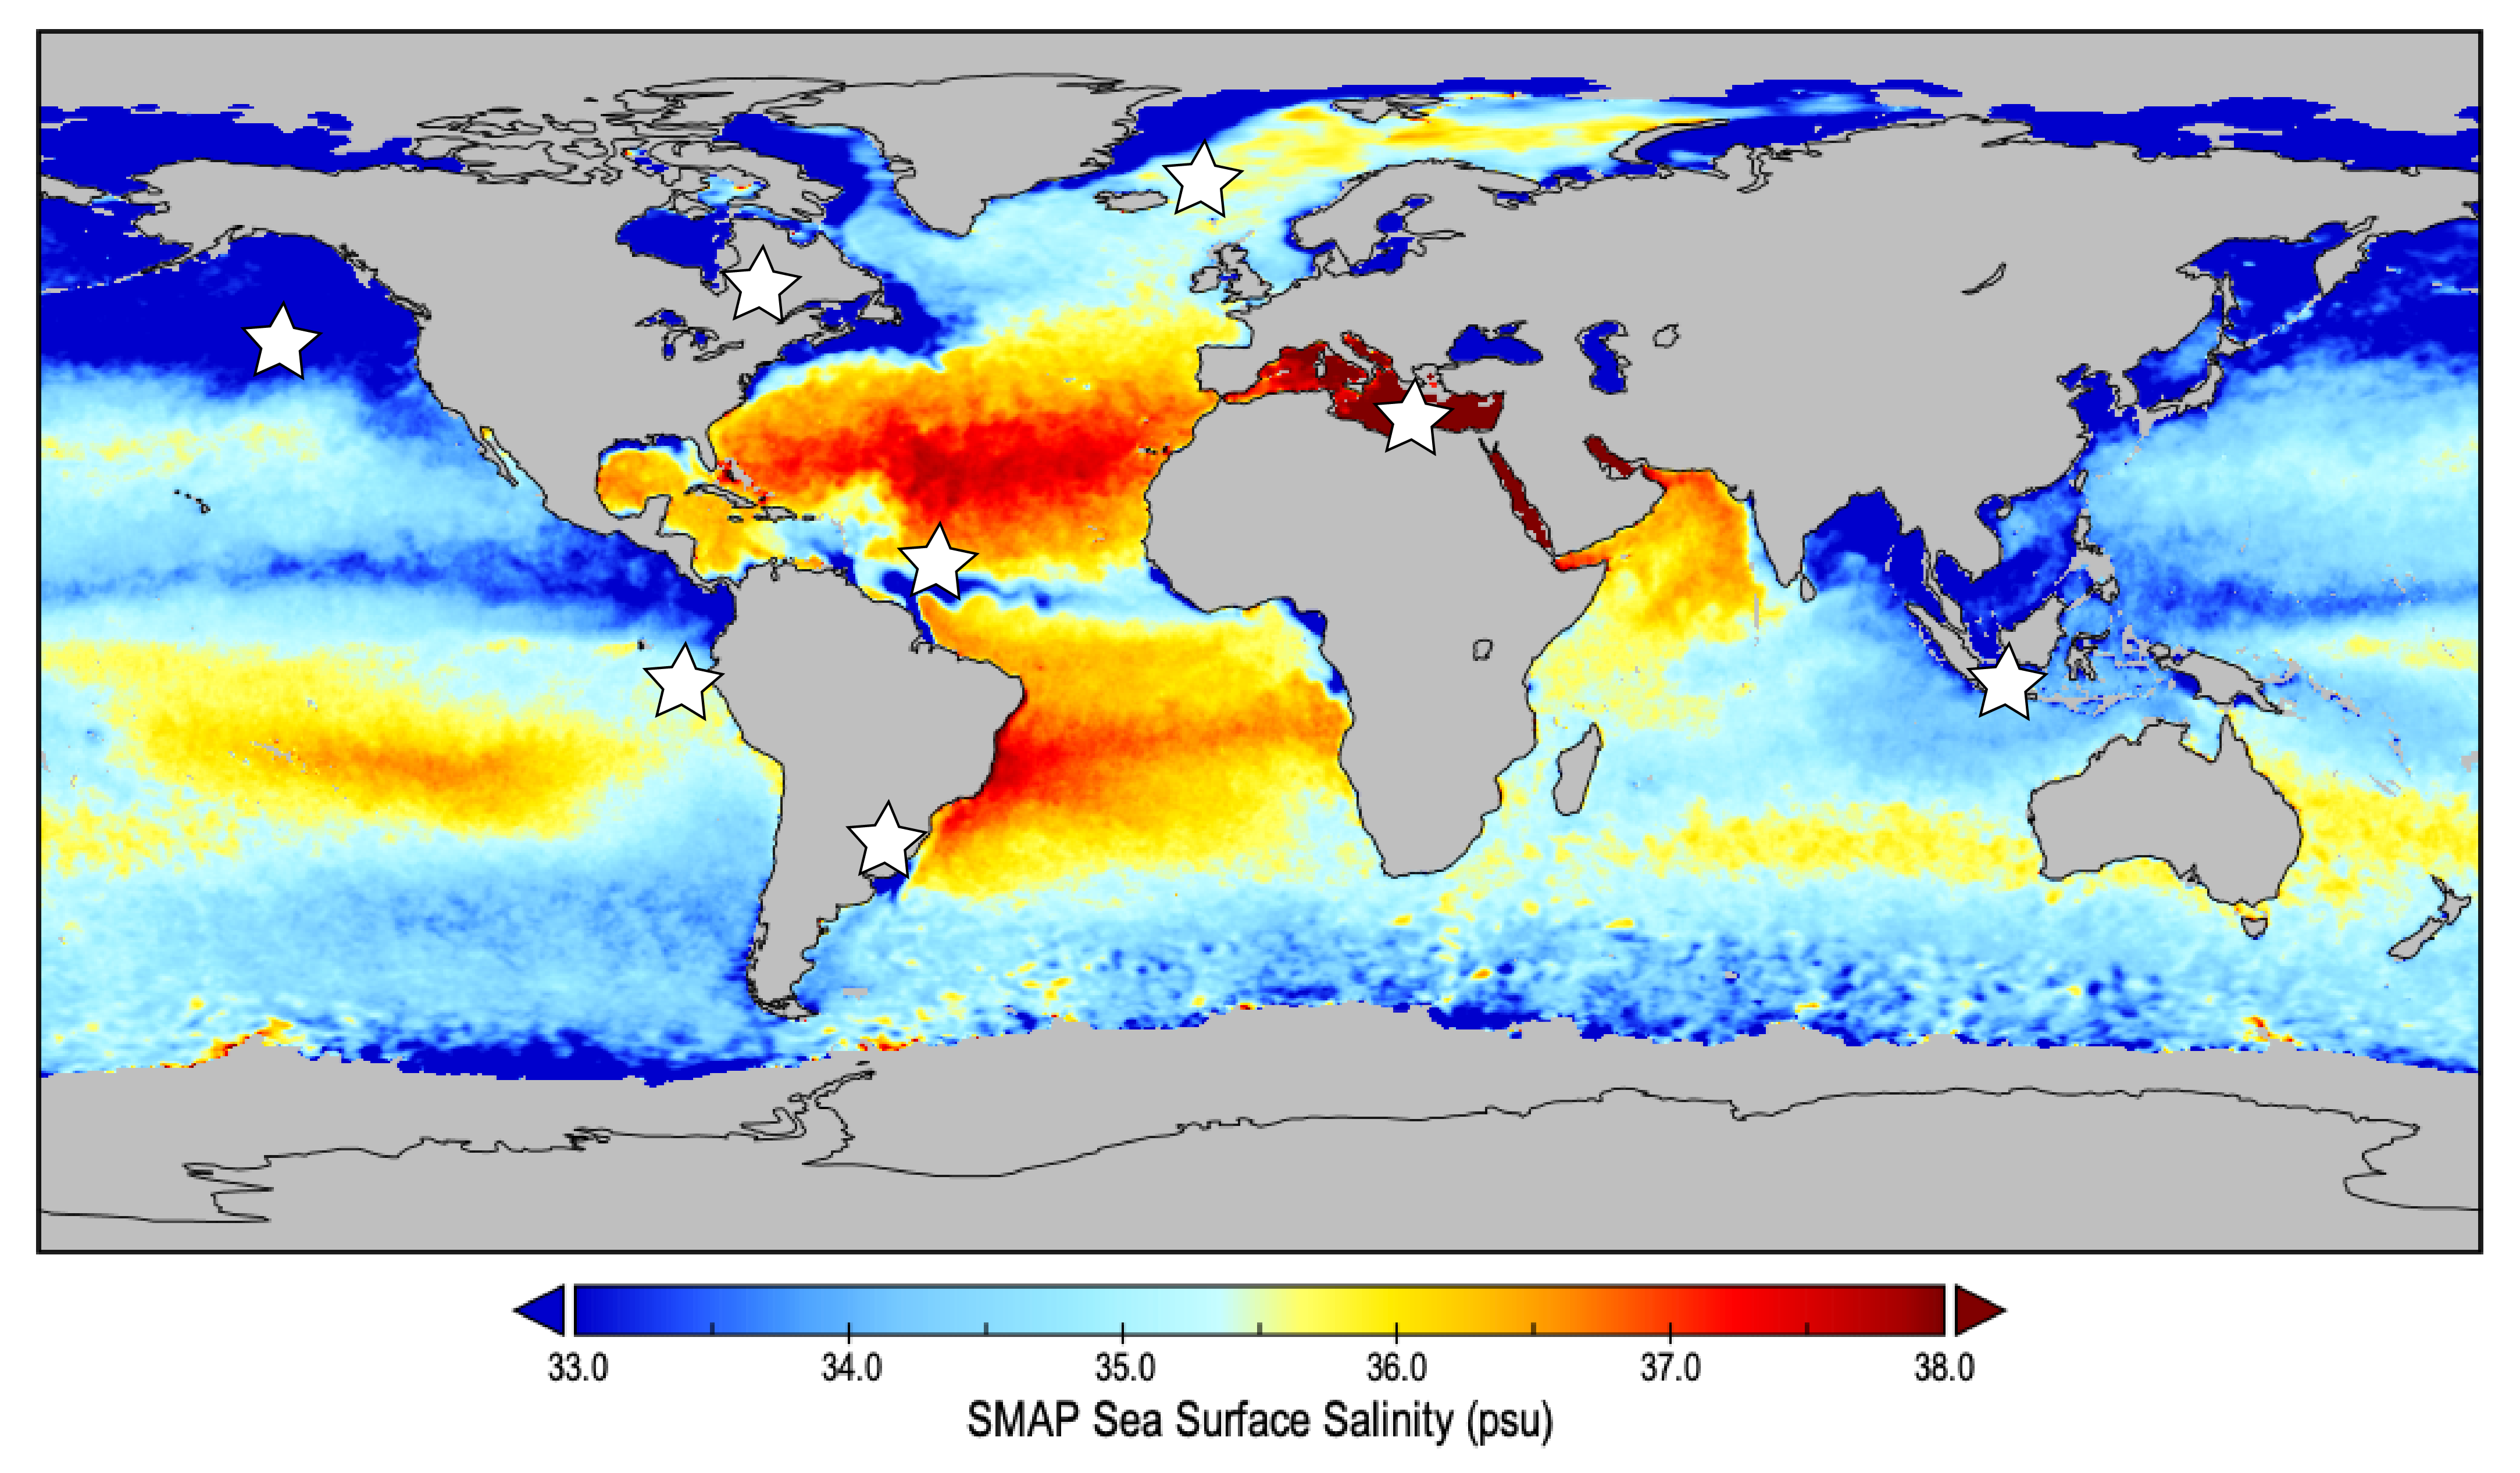
The ocean is vast, so finding specific organisms is vastly challenging. We can use environmental clues to hone in on areas where organisms might live. For example, searching for fish by watching for flocks of diving seabirds. But what if you need to look over a broader area? That’s where satellite data can come in handy!
Many environmental factors influence where specific types of organisms live in our ocean, including salinity. Salinities at the margins or outside the tolerance range of a particular species are “stressors.” Stressors can prevent a species occurrence, change their behavior, or limit reproduction… thus reducing their fitness for survival in that environment. In other words, you probably won’t find that species where such stressors exist.
There are many reasons we want to know where organisms live. We can identify target areas for maximum harvest. Conversely, we can use such information to protect them through targeted conservation efforts.
Click the stars on the map below to learn more about how researchers are using salinity data to find out where organisms live.
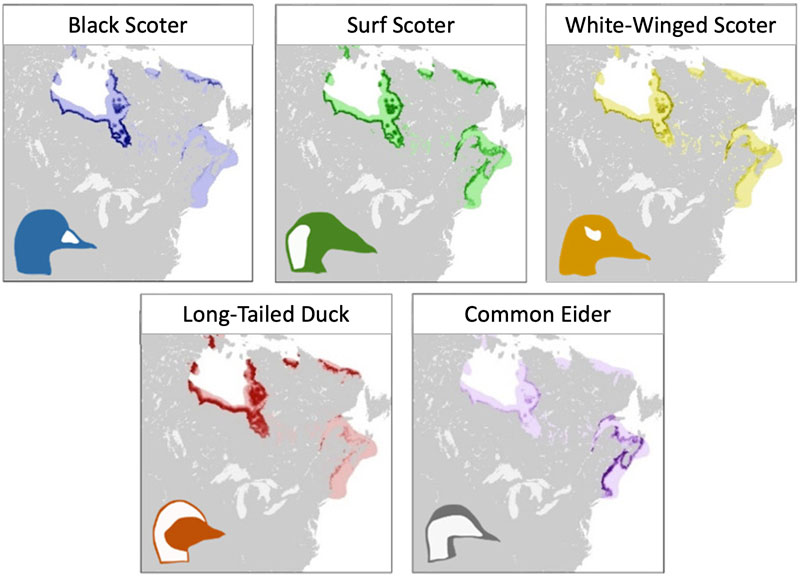
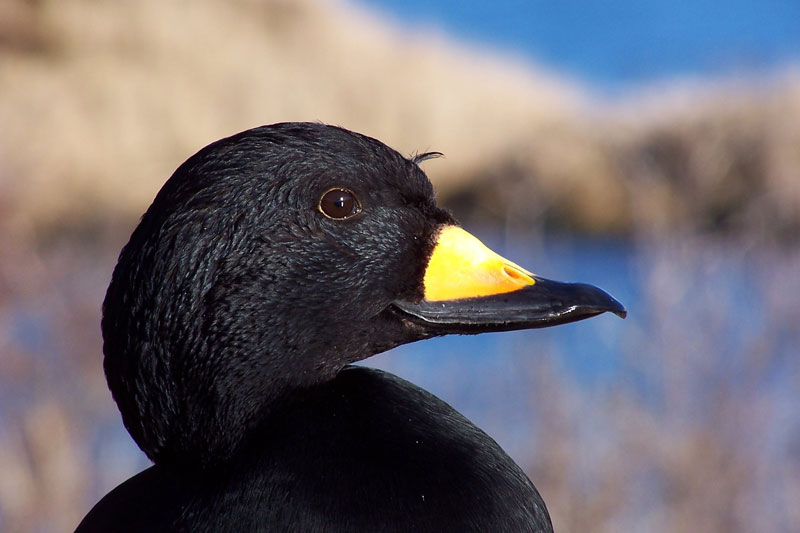
Conserving key habitats for wildlife conservation can be challenging. Conserving key habitats for species that move to different places throughout the year is extra challenging. This study presents a multi-species assessment of year-round habitat patterns for five species of sea ducks in eastern North America as they migrate from boreal/arctic terrestrial breeding sites to coastal, aquatic non-breeding habitats. By examining multiple species of ducks across their annual migration, researchers identified key habitat features (including surface salinity) and periods of vulnerability to create an annual cycle conservation strategy.
Reference
Lamb, J.S., Paton, P.W.C., Osenkowski, J.E., Badzinski, S.S., Berlin, A.M., Bowman, T., et al. 2020. View the full paper.
Figure Caption
Maps of habitat suitability scores for five species of sea ducks during the fall, post-breeding period. Darker colors indicate higher suitability of the habitat.
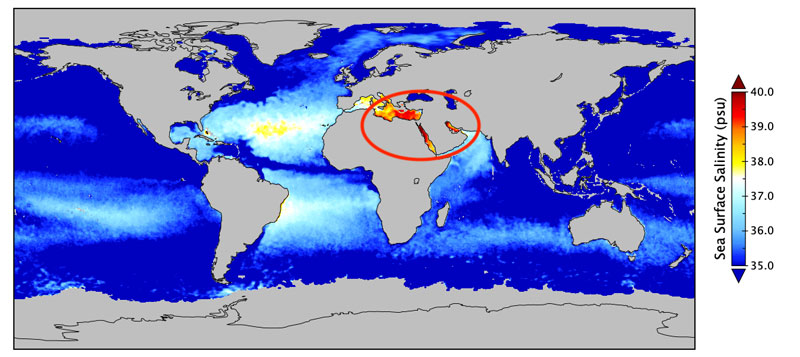
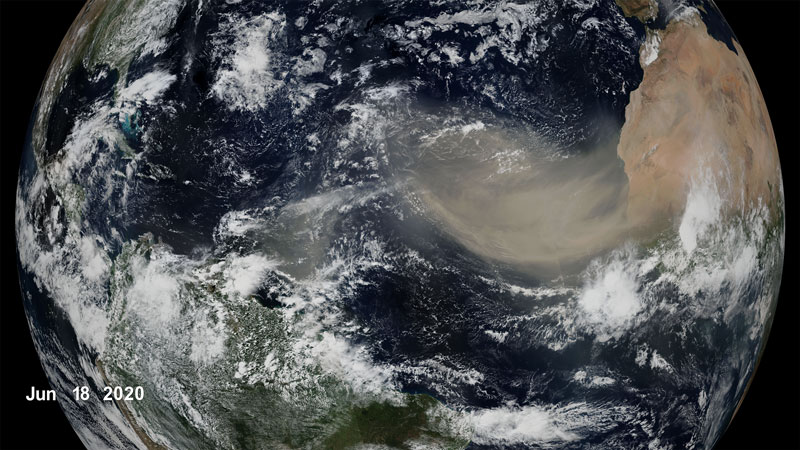
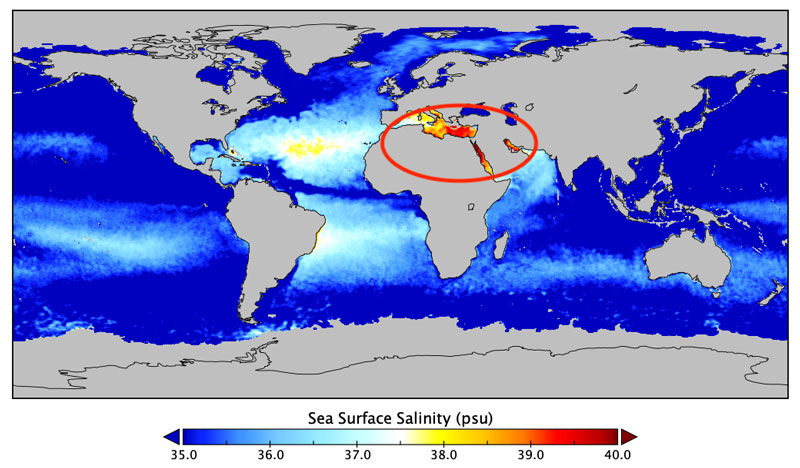
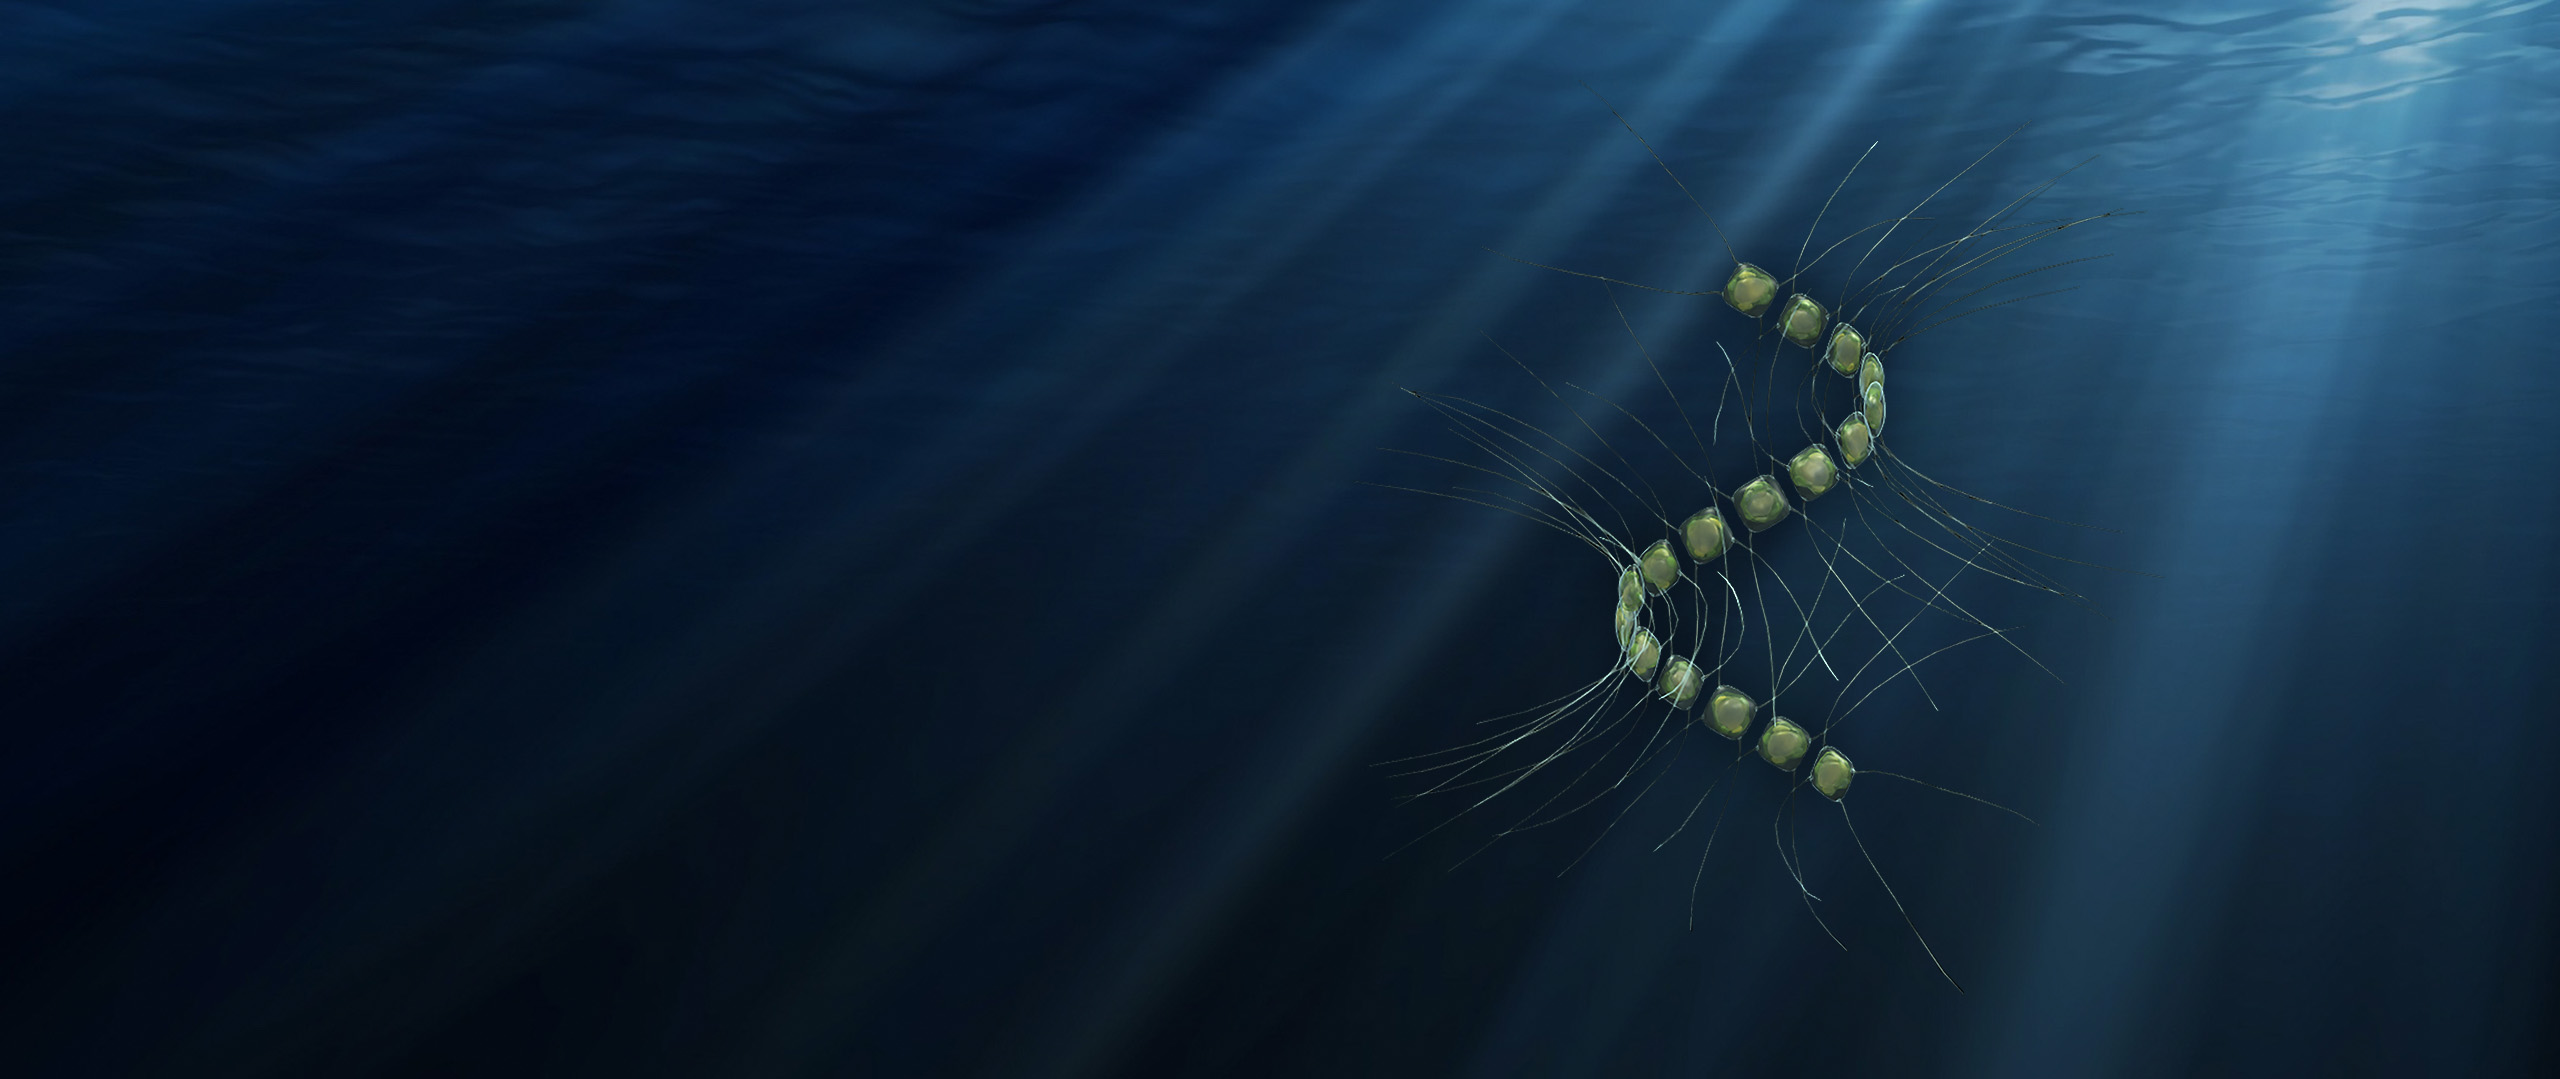
Extremophiles are organisms that thrive in the harshest environments on earth, such as extreme heat, salinity, radiation, pollutants, pH, or pressure. These microorganisms and the enzymes they produce to survive these extreme conditions are a key resource in the development of biofuels, bioremediation, and biotechnology. Finding these organisms, however, can be a challenge. In this study, researchers use satellite salinity data to hone in on areas to look for halophiles - extremophiles that thrive in high salinity environments.
Reference
Donato, P.D., Buono, A., Poli, A., Finore, I., Abbamondi, G.R., Nicolaus B., and Lama, L. 2018. View the full paper.
Figure Caption
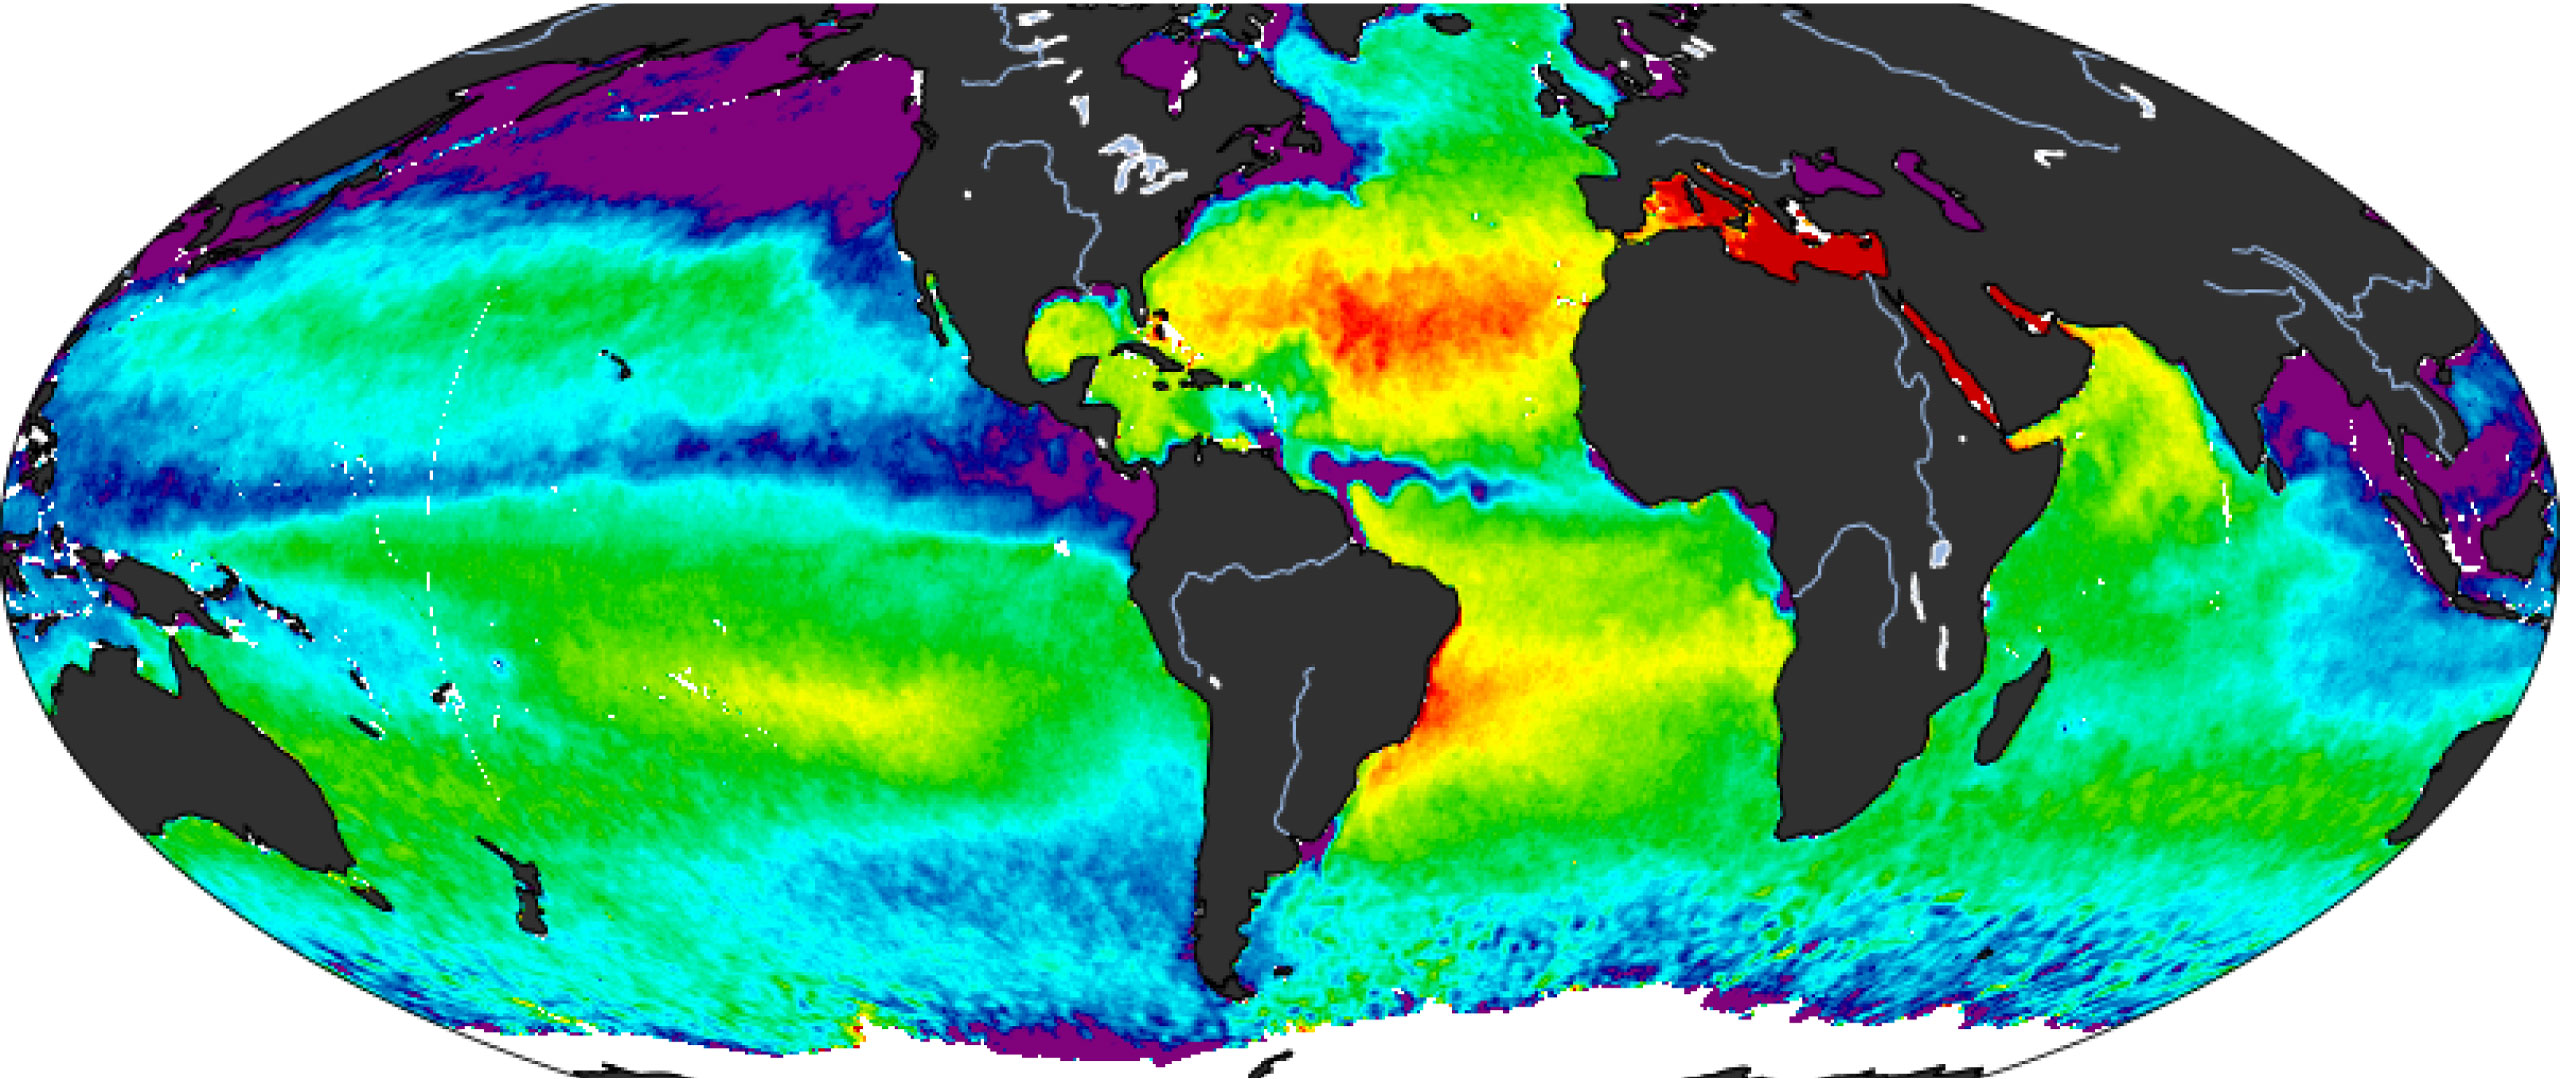
Monthly average global sea surface salinity. Areas with salinity over 38 psu (orange to red) are likely areas to find extremophiles. Source: SMAP JPL CAP Monthly Data, September 2021.
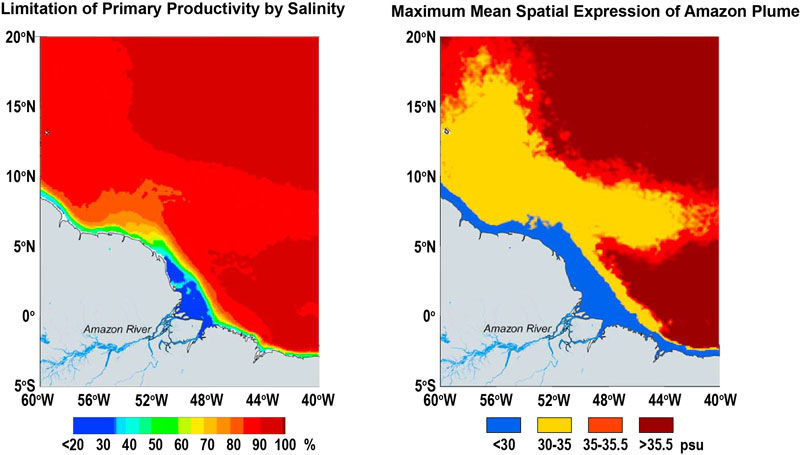
The Amazon River pours 5 trillion cubic meters into the Atlantic Ocean every year. That’s more than enough water to fill the Grand Canyon to the brim. As this freshwater mixes with seawater and becomes entrained into ocean currents, it influences the growth of phytoplankton. In this study, researchers developed a model to determine the extent to which salinity “explained” – i.e., influenced, limited, determined – how much primary production occurred in a given area.
Reference
Gouveia, N.A., Gherardi, D.F.M., Wagner, F.H., Paes, E.T., Coles, V.J., and Aragão, L.E.O.C. 2019. View full the paper.
Figure Caption
Spatial limitation of primary production as a result of the Amazon River Plume. LEFT: Model results depicting the level to which salinity influences primary production. Blues indicate areas where production was less influenced by salinity and reds indicate areas that were more influenced. RIGHT: Location of the Amazon River plume waters, delineated by salinity.