- HOME
- SCIENCE
- HIGHLIGHTS
- DATA & MAPS
- DATA FOR YOU
- MEETINGS
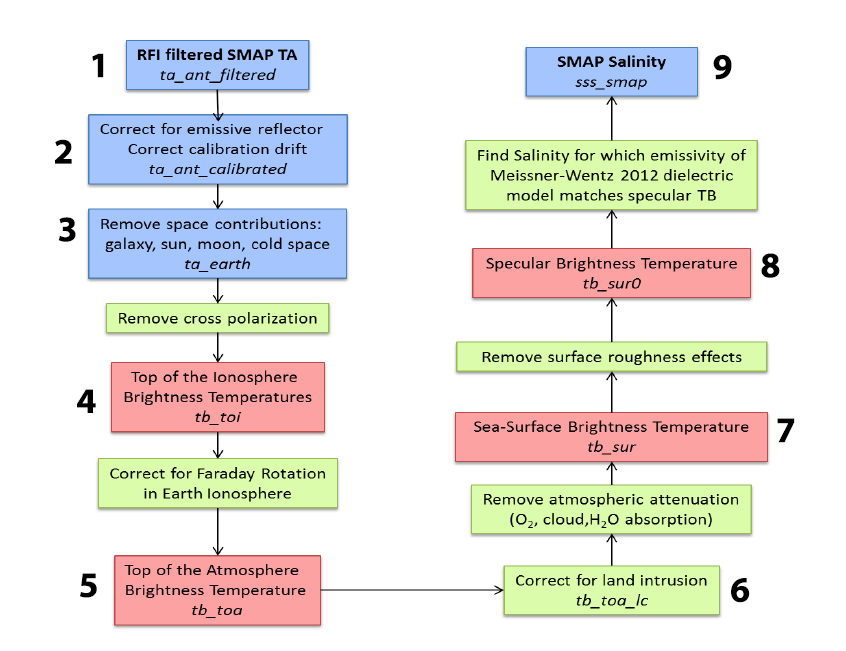
The RSS processing approach is based on understanding – and correcting for – the antenna temperatures and variables in the geophysical environment that affect the salinity signal retrieval. The empirical calibration steps are outlined in the figure at right. Numbers correspond to Level 2 data fields, which are shown in detail in the Appendix. Visit the SMAP SSS Products Overview and Ancillary Data Sources section to learn more about how RSS and JPL process SMAP data.
Working with the science community we see where our product has problems. An example is when we produced the Version 4 SSS update's land correction, which we changed from Version 3. It took quite a bit of effort to do it but what we learned from the science community is that our product near land had clear issues. Jorge Vazquez (JPL) had Saildrone data from the coast of Baja California which showed problems. Semyon Grodsky (Univ. of Maryland) had data from buoys in the Gulf of Maine that showed clear biases in SSS data, which were clearly related to being close to land. These studies told us unambiguously that our Version 3 land correction was not adequate. Based on their findings, we went back and revised everything for Version 4. They checked our new product against their data and made sure that it has a clear improvement. I think finding out the shortcomings of your product – by comparing with actual observations – is crucial for product development.
The two processing algorithms can learn from each other. The shortcomings from one algorithm shed light on the other and vice versa. In general, cross checking different results leads to better diagnosis of the algorithms and exhibit shortcomings, rather than just looking at one data product. Also, we have different types of data products (e.g., JPL's near-real-time product), which might appeal to different users.
We have considered creating a near-real-time SSS product but are looking at the level of demand by users. If you decrease the latency of a data product, then you have to decrease the amount of ancillary data quite a bit. You would also need to use degraded ancillary data which, in turn, decreases the quality of the SSS. This, of course, would only apply to Level-2 products since we average Level-3 data (e.g., over 8 days) to help decrease noise.
We already have a near-real-time SMAP wind speed product. SMAP can measure wind speeds associated with tropical cyclones and this is very interesting for forecasters.
RSS takes the Level 1B file and corrects the data at a lower level than JPL. We basically take the antenna temperature (i.e., based on radiometer counts) and then we do our own calibration. In other words, we grab the data at an earlier stage and then do our own emissivity correction, and so on. This is one reason why the RSS and JPL data sets can appear to be different.
The order of the steps used by RSS to handle "spurious signals" is described in the empirical calibration figure (see Fig. 1). The idea for RSS calibration is that you take out spurious signals in the reverse order that they occur in nature: the signal comes from the Earth (#9) and into the instrument (#1). The "forward model" goes from the Earth to the instrument and the algorithm basically inverts this process step by step.
Yes, SMAP has an elaborate RFI filter in its Level 1 processing. We are taking advantage of this. Also, we haven't seen much RFI over the ocean with SMAP, as opposed to Aquarius. So, other than using the already-filtered data, we are not really doing much RFI flagging for SMAP data... at least for the time being.
We have flags for rain, sea ice and land contamination. "Strong" or "severe" flags are used in instances when the data are clearly not usable anymore; we produce the data but it should not be used. Assigning flags to be "light," or "moderate" is somewhat arbitrary, however. It's more a matter of taste and it's hard to give an exact answer as to why we use one or the other. If it's "light," the data can probably be used for scientific applications but you can expect some small degradation. "Moderate" is in between... and it's up to the user to decide whether he or she wants to use the data.
A typical example is land contamination when you get close the coast: the closer you get, the higher the error. It's the same thing for sea ice. If the signal you are interested in is very strong – e.g., Amazon outflow or Bay of Bengal where you have 10 psu signals – then maybe a degradation of 0.5 or 1 psu is not a big issue. So, it's up to the user to decide if they want to use the SMAP SSS product.
My personal opinion is that flagging is somewhat superficial. We do it because users like flags but what users should look at is the error bars or uncertainty estimates. That's really the important quantity. You should use the uncertainty estimates to decide whether or not to use those data or not. It depends on individual user's requirements. For example, open ocean accuracy requirements are often around 0.2 psu and the error bars are around 0.1 psu, so you can definitely use that data. Near land, however, error bars can be around 0.5 psu but if you have a strong signal, then you can make your own decision. Overall, the error bars or uncertainty estimates should be the determining factor for whether or not you use specific data.
First of all, both RSS and JPL are doing corrections for land contamination, both of which are pretty reasonable to a first order. Currently, neither RSS or JPL do any sea ice mitigation like we do for land. So, sea ice is just there... we don't correct for it. RSS and JPL have different sea ice masks. The problem is getting a good sea ice mask is not easy. All sea ice masks have their issues. RSS has a very conservative sea ice flagging for V4 when compared to JPL (4.2). So, we are throwing out quite a bit of data at the moment because of the sea ice mask... we're trying to see if we can keep more data in the future.
We use external wind speeds to retrieve salinity (i.e., CCMP; see Ancillary Data Sources). Unlike JPL, we purposefully keep SSS and wind data separate (documentation is available at RSS). This is because salinity is easily averaged such as our 8-day averaged product. Averaging doesn't make a lot of sense for wind data. We also believe that the wind speed data from SMAP are primarily good for high winds - for example looking at tropical cyclones – which you don't get with other instruments. To make a long story short, we keep salinity and wind speed completely separate in our products.
The major thing we are looking at is improving SSS retrievals from high latitudes. SMAP data are already good from 60° South to 60° North but there are issues as you go higher in latitude. We are analyzing data but it is challenging because there is very little in-situ data in these regions. Also, sensitivity in SSS retrievals decreases in cold water... so we want to try and improve that. Also, we'd like to get data from closer to edges of sea ice rather than throwing out some of the data, which is what we do right now (Version 4).
Another thing we're actively working on is improving our uncertainty estimates or error bars.
Lastly, because the SMAP radar doesn't work, we have to use external wind speeds. We use ancillary data from CCMP; however, it isn't as good as measuring wind speed directly like we did with Aquarius. We are trying to improve ancillary winds but I'm not sure that's possible.
The major issue to is to get a continuing mission for L-band since there's nothing on the horizon after SMAP. The European Space Agency is hoping to go forward with CIMR (Copernicus Imaging Microwave Radiometer). It would be a multi-frequency instrument and would will likely include L-band (the frequency used by SMOS, Aquarius, and SMAP). It's an exciting instrument but wouldn't be launched until 2025 or so.