

- HOME
- SCIENCE
- HIGHLIGHTS
- DATA & MAPS
- DATA FOR YOU
- MEETINGS
An example of the Level 4 product is the Optimum Interpolation Sea Surface Salinity (OISSS) analysis which combines Level 2 observations from NASA's Aquarius/SAC-D and SMAP satellite missions into a continuous and consistent, gridded sea surface salinity dataset. Measurements from ESA's SMOS satellite are used to fill in gaps when SMAP is unable to deliver scientific data. The OISSS analysis also uses a dedicated bias-correction algorithm to correct the satellite retrievals for large-scale biases with respect to in-situ data. | OISSS maps | OISSS Climatology maps | OISSS Anomaly maps |
It can be useful to "dive deeper" and be aware of the types of documents describing how the data are acquired, validated, calibrated, processed and distributed.
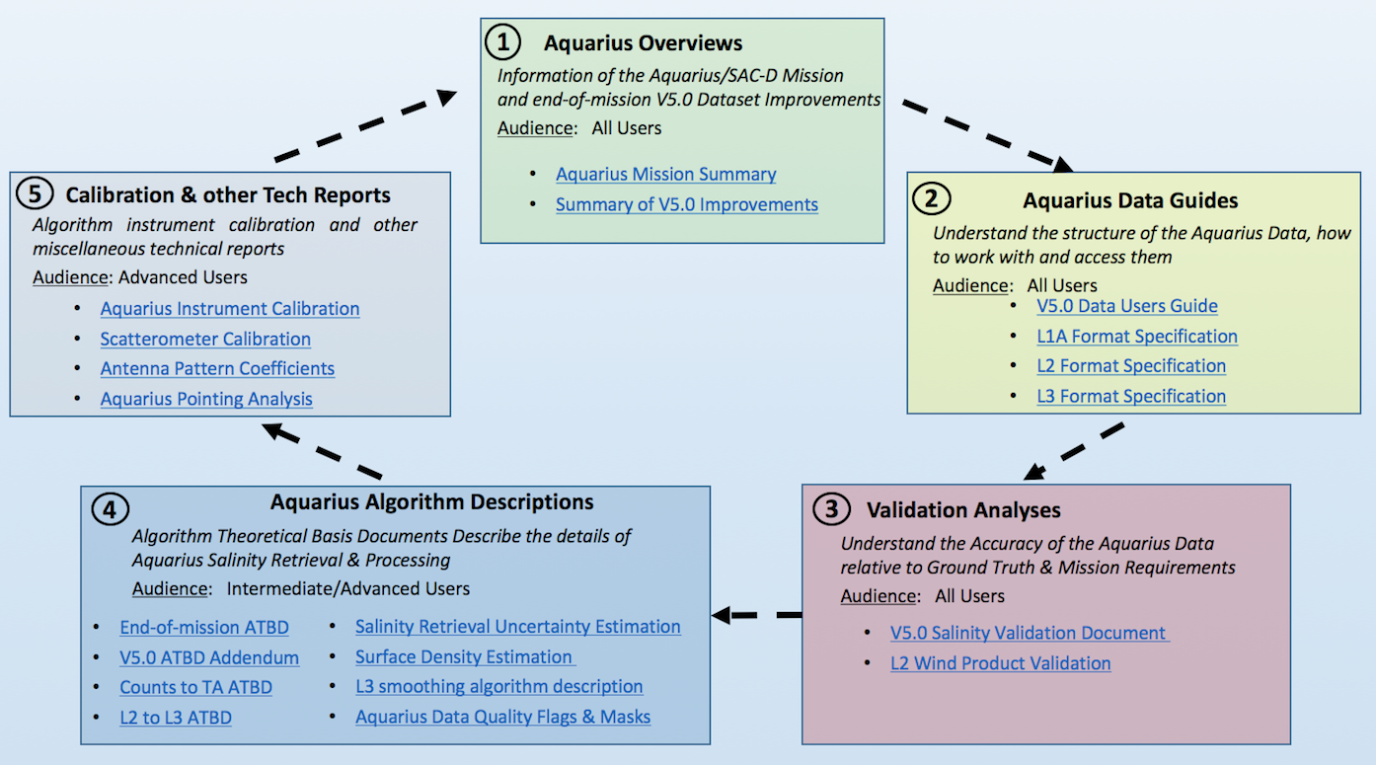
The complexity behind SSS data has been captured in the PO.DAAC's Aquarius Documentation Roadmap. In addition to User Guides, there are Validation Analyses, Algorithm Descriptions, Calibration and other Technical Reports. The PO.DAAC also offers similar documentation for SMAP SSS processing.
There are differences among the retrieval algorithms used to generate satellite SSS data. Not only that, the algorithms used to process various missions' data evolve over time. So, the information below is meant to provide an overview of the types of variations among data products.
The variation among SSS data products falls into these general categories:
The specific application of corrections, flags, filters, and masks – along with approaches to estimating errors or uncertainties – are described in each product's User Guide and other literature.
Another consideration: Some data are processed by multiple institutions. SMAP SSS data, for example, are processed by both RSS and the NASA Jet Propulsion Laboratory (JPL). In the next section, we focus on similarities and differences in how these SMAP data products are processed.
A potentially confusing aspect is that there can be overlap between items in these categories. For example, RSS uses an ancillary "land mask" as an input to its SSS processing. Land corrections are applied to ensure the quality of coastal SSS data. RSS products also include land-related quality flags ranging from "light contamination" (i.e., removed from averaging in smoothed products) to "strong contamination" (i.e., masked altogether). Finally, RSS includes systematic errors from land contamination in its empirical uncertainty estimates.

It is not uncommon for months (or years) to pass between gathering data, analyzing it, writing a manuscript, and publishing your results. In parallel, the SSS data processing community is working to update algorithms and improve its products.
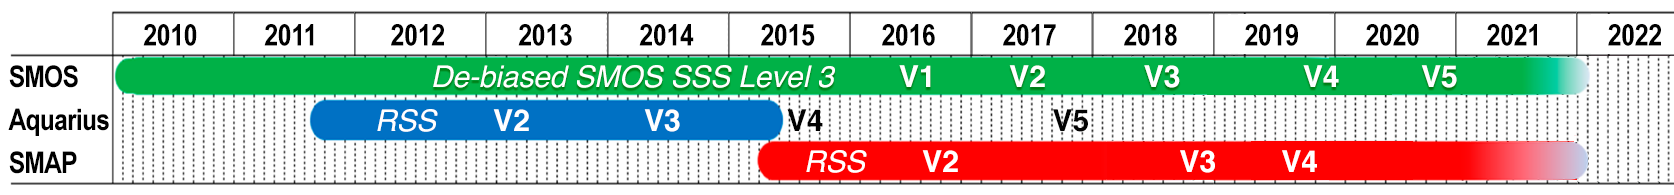
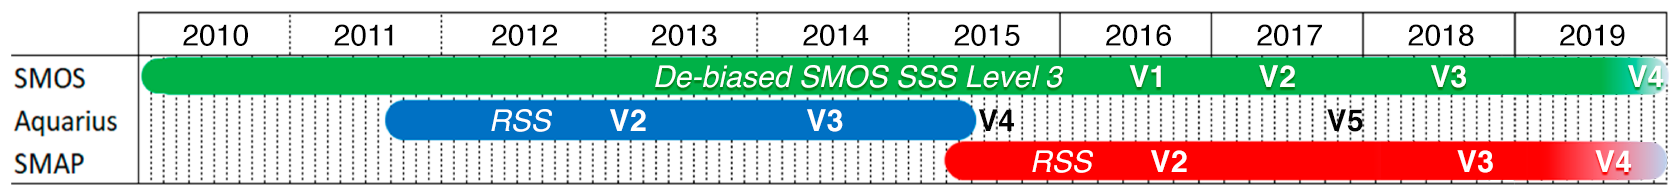
New releases of SSS data products are accompanied by changes in version numbers. This timeline shows major release dates of three examples of SSS data products (i.e., De-biased SMOS Level 3, Aquarius RSS, and SMAP RSS). Interestingly, two versions of Aquarius data (V4, V5) were released after the satellite stopped operating on 07-Jun-15.
It is important know which data version number(s) you are working with and be cognizant of new data releases that may occur while your manuscript is being reviewed. Even though the new data product will be better in quality, it may affect your results. Consider contacting the data providers (e.g., PO.DAAC for NASA SSS data) about the timing of data release updates.
The accuracy of satellite-derived SSS measurements is largely validated by data from in-water sensors. Nonetheless, comparing the two is challenging for many reasons.
Timing is a challenge: Satellite observations need to be "matched up" with in-water data that has been collected at or near the sea surface within a few days of the satellite retrieval.
Spatial mismatch is another challenge. Satellite footprints cover tens of kilometers. Thus, a single satellite footprint may sample an area with non-uniform salinity (e.g., region with discrete patches of low salinity caused by recent rainfall). In-water salinity instruments, on the other hand, provide discrete "pinpoints" of salinity data.
Horizontal mismatches are only one part of the story. There are also differences in the depths where salinity is being measured. Satellite sensors retrieve from the very top of the ocean while in-water instruments measure salinity at greater depths.
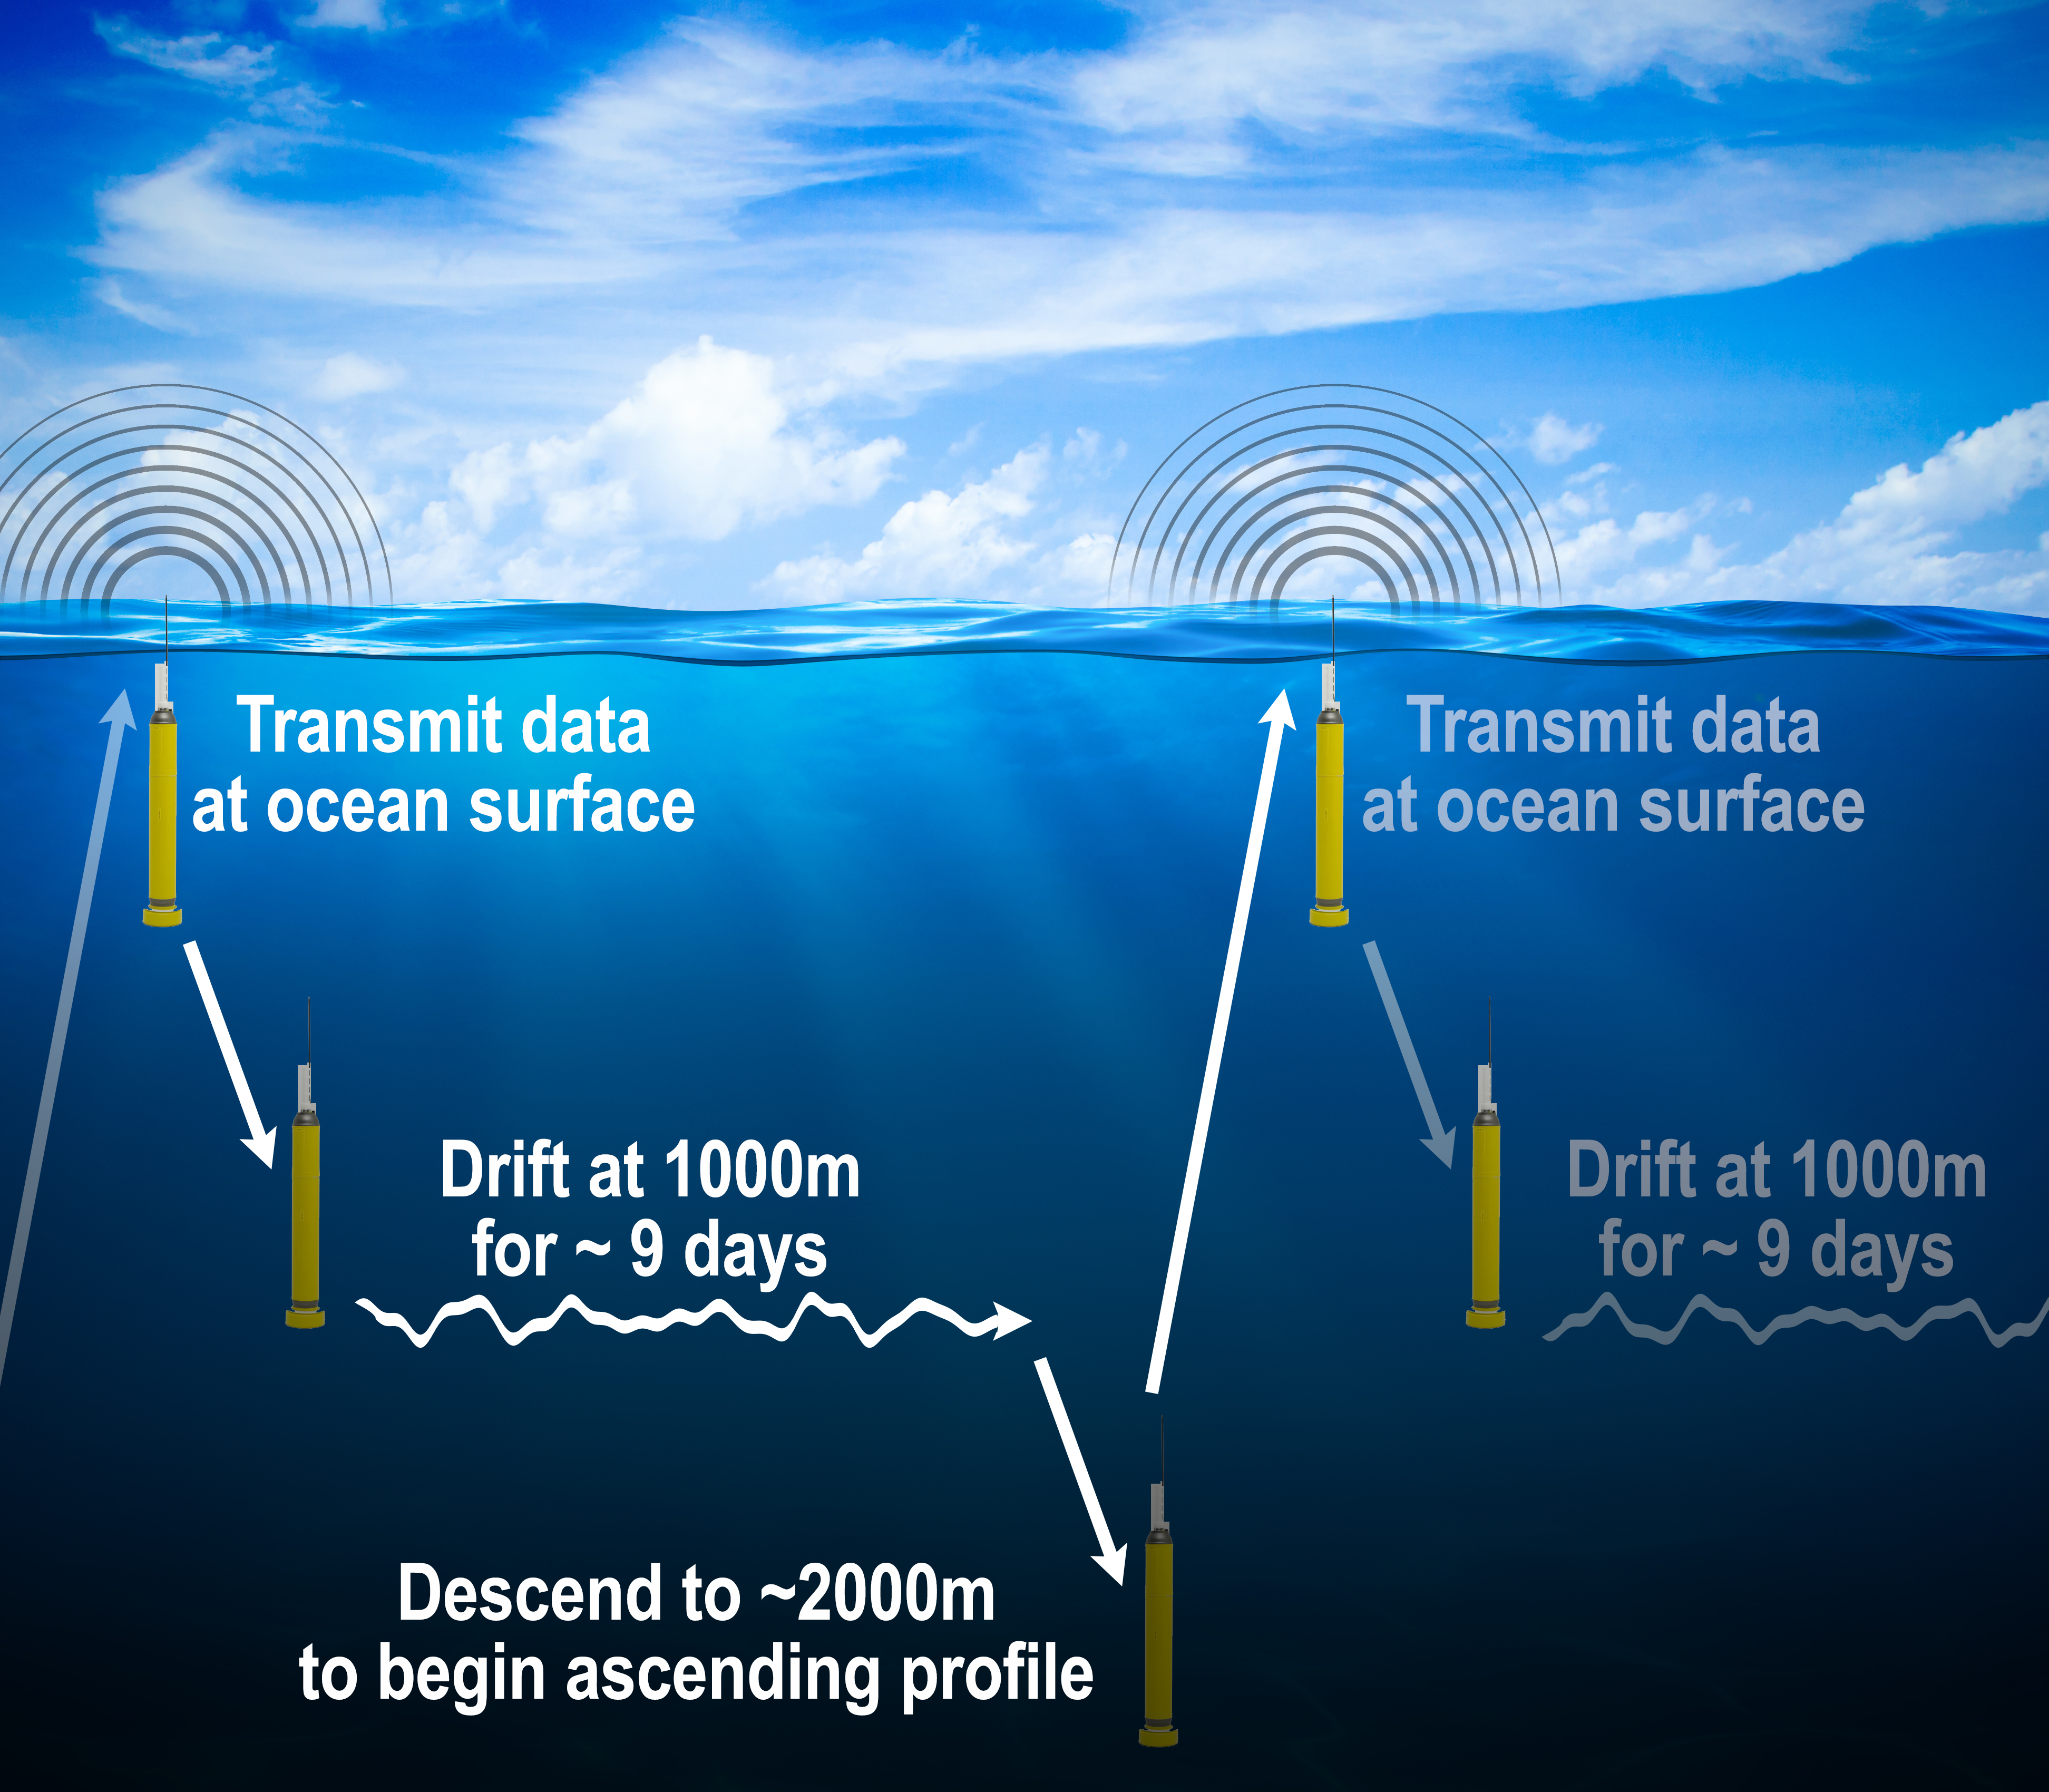
Systematic sampling differences between satellite and in-water SSS data are sometimes referred to as "biases." However, these sampling differences do not necessarily equate to errors in satellite SSS. There can be physical reasons for the differences; for example, thin layers of low-salinity water that "float" on the ocean surface. These conditions would be detected by satellites, which measure TB in the top centimeter of the ocean, but missed by sensors such as Argo profiling floats (Fig. 1) that generally do not detect salinity shallower than 3 – 5 meters.
SSS validation is being aided by a relatively new technology, Saildrone (Fig. 2). This instrument acquires salinity at a depth of 0.6 m, closer to the sea surface and thus more indicative of conditions detected by satellites. Other novel SSS-measuring technologies have been employed in conjunction with the SPURS campaigns. These instruments are key to understanding discrepancies between "sea truth" data and satellites' SSS retrievals, which are fed back into processing algorithms to improve SSS data products.