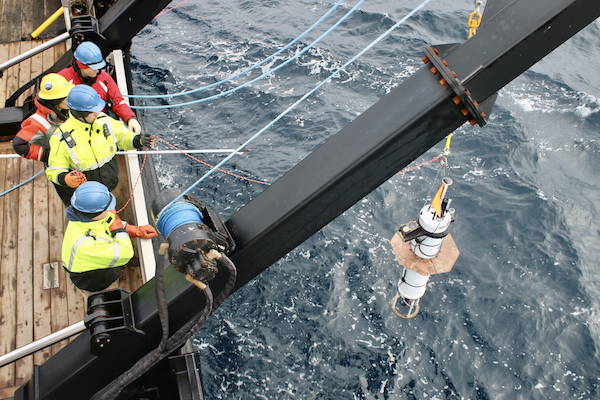
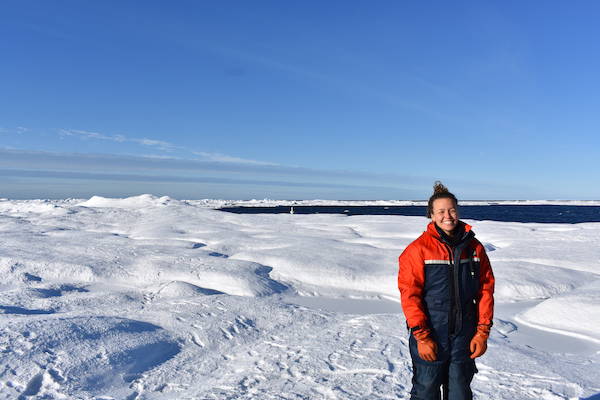
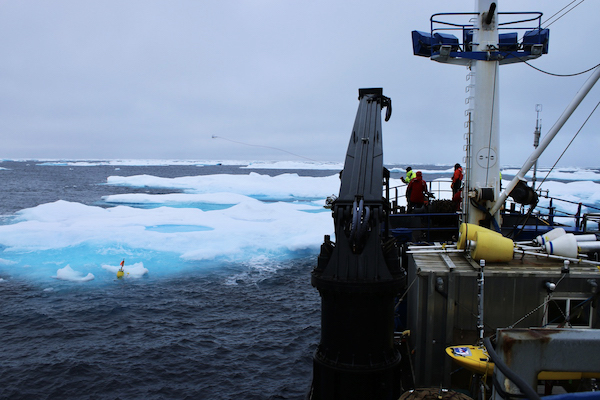
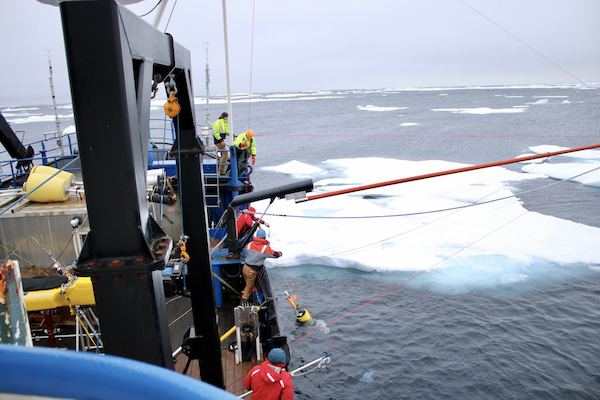
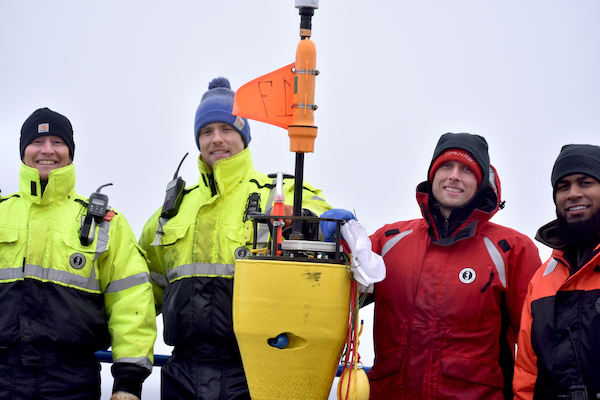
Deploying the Under Ice Float from the Research Vessel (R/V) Woldstadt. [photo credit: Carlyn Schmidgall]
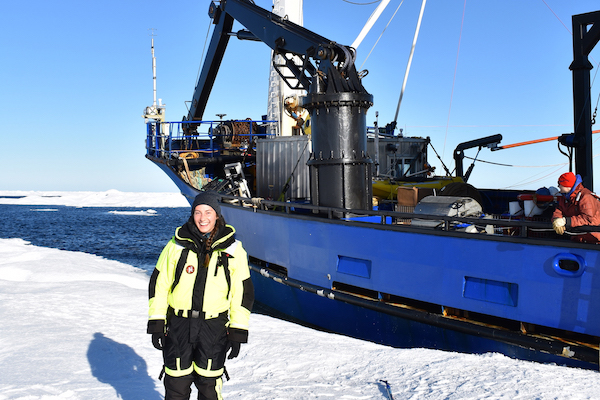
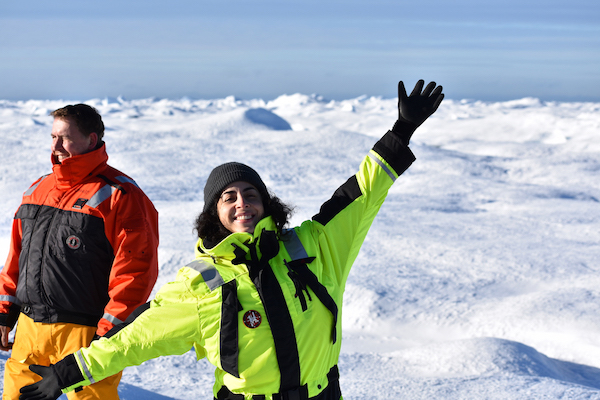
Who took the previous photo? Carlyn Schmidgall who looks quite happy to be on solid ice. [photo credit: Jim Thomson]
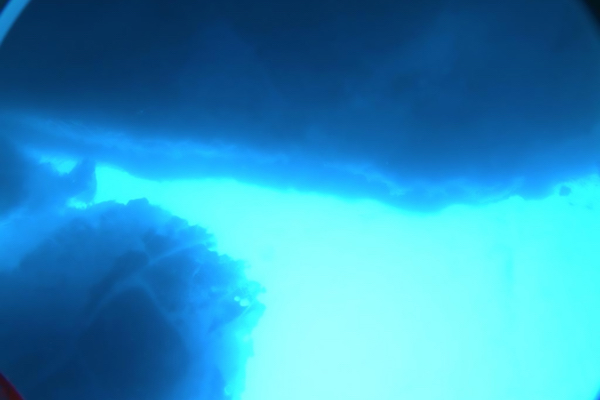
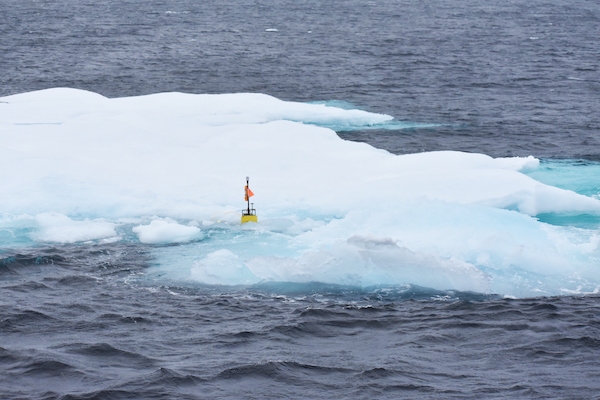
The Under Ice Float doing its job: observing conditions underneath Bering Sea ice. [photo credit: Andrey Shcherbina]

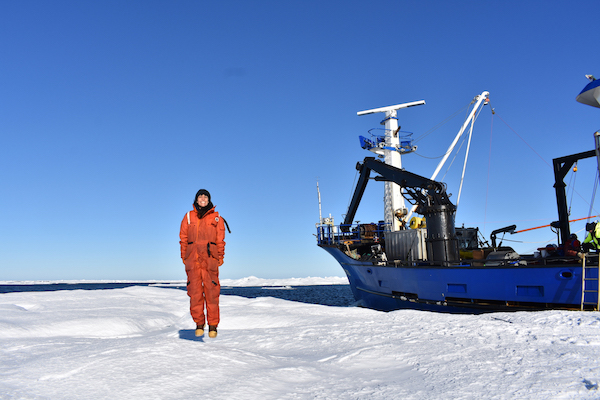
Drone photo shows the R/V Woldstad alongside sea ice. [photo credit: Peter Gaube]
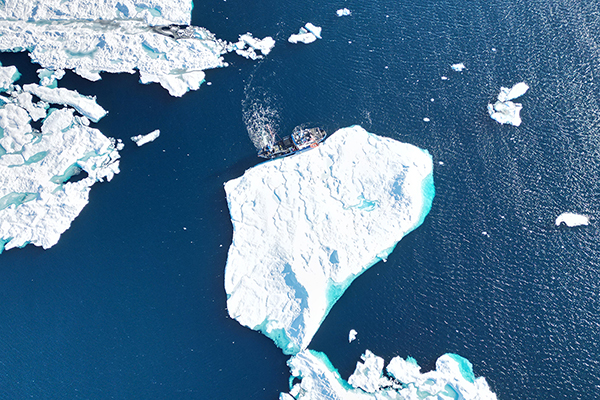
Bird's eye view of the R/V Woldstad. [photo credit: Peter Gaube]
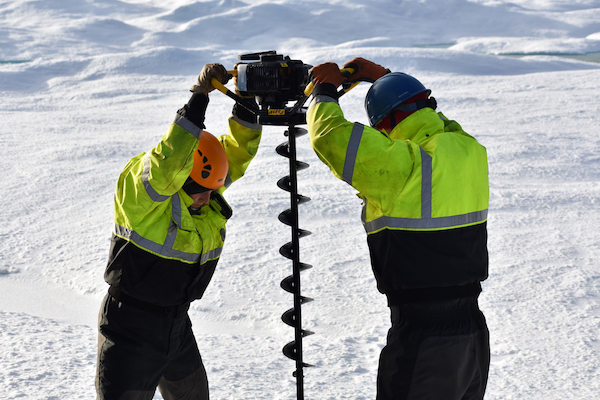
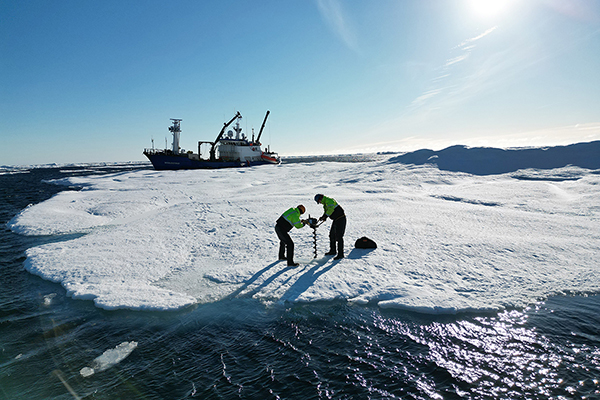
Another way to measure ice properties? Drill a hole in it! The SASSIE team prepares to deploy the Ice Mass Balance Buoy. [photo credit: EJ Rainville]
Drone photo shows the ice drilling process from a different perspective. [photo credit: Peter Gaube]
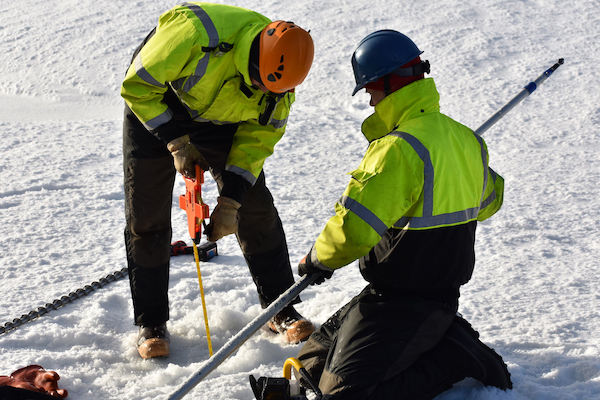
Are we there yet? Measuring ice thickness is a key step in deploying the Ice Mass Balance Buoy. [photo credit: EJ Rainville]
Ice Mass Balance Buoy after being successfully deployed. [photo credit: EJ Rainville]
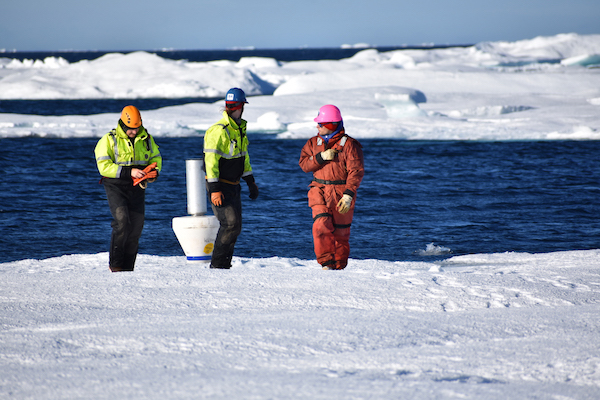
Laetitia Parc enjoying a moment with the Ice Mass Balance Buoy in the background. [photo credit: Jim Thomson]
Think Laetitia looked happy? SASSIE Principal Investigator Kyla Drushka jumped for joy! [photo credit: Jim Thomson]
More smiling SASSIE scientists: Jaynise Pérez (right) and Julian Schanze (left). [photo credit: Jim Thomson]
Julian designed the innovative "Salinity Snake," which measures saltiness at the very top of the ocean. He's also quite the photographer! [photo credit: Julian Schanze]
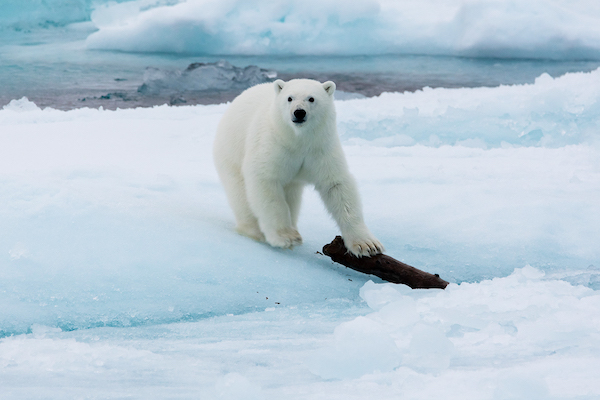
Earlier in the cruise, he captured a photo of this polar bear on a sea ice floe... [photo credit: Julian Schanze]
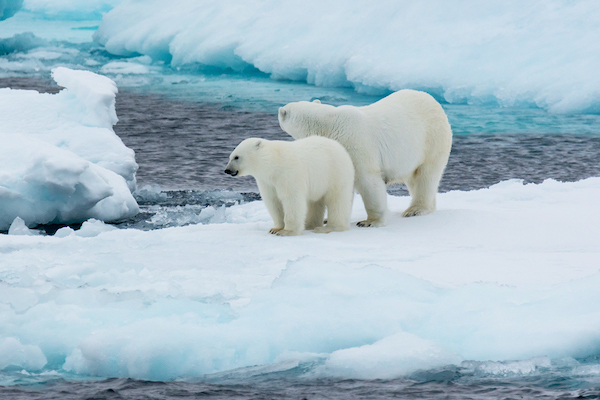
... and these two polar bears, as well. [photo credit: Julian Schanze]
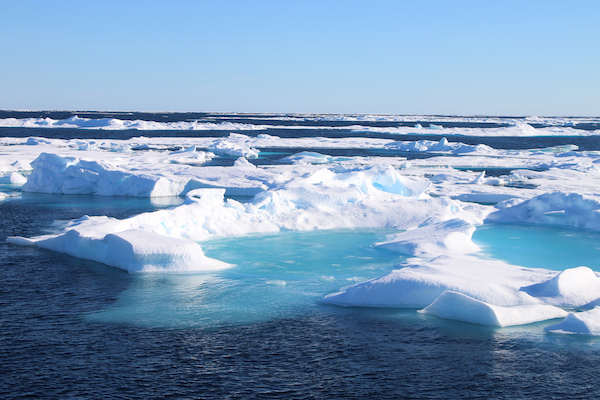
Ice is nice but there's a lot to see – and sample – in open water. [photo credit: Carlyn Schmidgall]
Ice-free conditions allow SASSIE scientists to collect seawater samples. [photo credit: Carlyn Schmidgall]
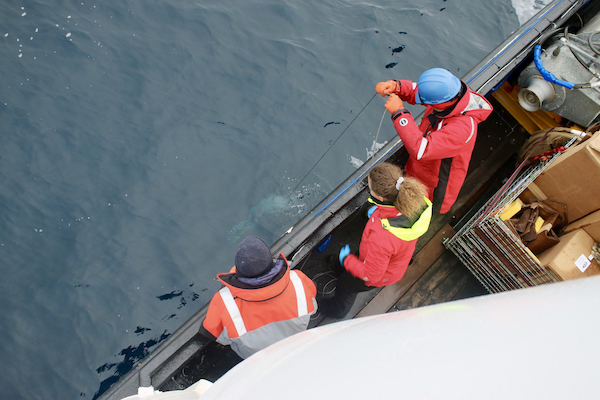
Hurling a grappling hook (yikes!) to recover a SWIFT drifter. These buoys measure conditions below and above the water line. [photo credit: Carlyn Schmidgall]
SWIFT drifter being hauled onboard the ship. Note the orange boom and lines associated with the Salinity Snake. [photo credit: Carlyn Schmidgall]
Got it! One of the SWIFT drifters after successful recovery. [photo credit: EJ Rainville]
Some SWIFT drifters will sample freeze-up conditions toward the end of the SASSIE cruise. [photo credit: EJ Rainville]
Prepping the Jet Surface Salinity Profiler. It's basically a jet-powered, remote-controlled kayak. How fun is that? [photo credit: Carlyn Schmidgall]
The Jet Surface Salinity Profiler heading away from the R/V Woldstad to collect salinity and temperature data in the top meter of the ocean. [photo credit: Carlyn Schmidgall]
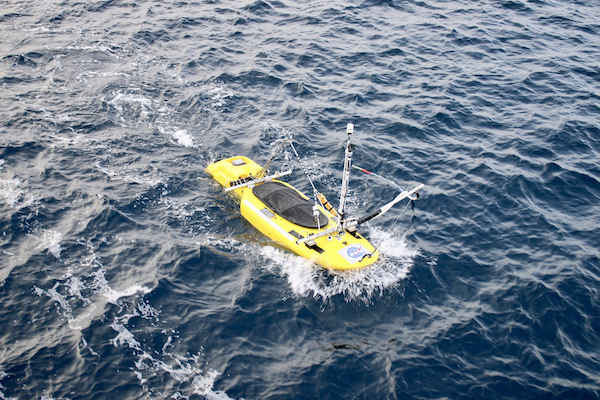
The Jet Surface Salinity Profiler in action... woo hoo! [photo credit: Carlyn Schmidgall]
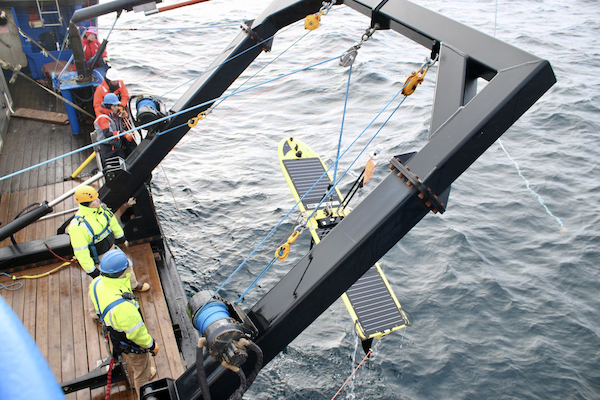
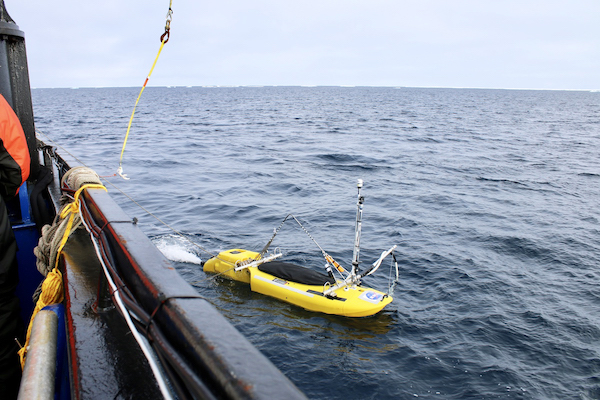
After a month of exploring the Beaufort Sea, a Wave Glider is recovered for maintenance prior to re-joining the rest of the "fleet." [photo credit: Carlyn Schmidgall]
Sea ice extent in the Arctic Ocean has declined dramatically over the past decades. Autumn ice advance is slower and occurs later, while summer ice retreat is faster and occurs earlier. The result is a lengthening open-water period each year, leading to changes in air-sea heat and momentum fluxes, the freshwater cycle, surface albedo feedbacks, primary production, and regional and global climate as well as human and ecological health.
Our experiment examines how summer ice melt evolves into and is inexorably linked with autumn sea ice advance. A major SASSIE milestone was completed in September 2022: a monthlong scientific cruise in the Beaufort Sea aboard the R/V Woldstad.
Overview of SASSIEHow did the cruise "play out"? During the Cruise Planning meeting, the SASSIE team drew up a series of "plays" that would be chosen based on sea ice, ocean, and weather conditions. They executed a total of five plays during the cruise:
PLAY 1: Ice edge / ice survey – Bad weather prevented the ship from going into open water, so the team carried out a survey through the sea ice; Strong salinity and temperature gradients were observed near the ice edge [Sep. 8-14]
PLAY 2: Zig-zag open water survey – The ship emerged from the sea ice and headed east to map the open water south of the ice edge; Each southeast tack ("zig") entered warmer water while each northeast ("zag") entered colder water [Sep. 14-16]
PLAY 3: Ice survey – Typhoon Merbok hit the Bering Strait so the ship headed northeast into the sea ice to avoid the rough seas; The team surveyed around several drifters and assets within the sea ice [Sep. 16-18]
PLAY 4: Drifter-following survey – Drifters were deployed on both sides of a strong salinity gradient; The ship then carried out four survey "boxes" around these assets as they drifted northwest, collecting continous underway CTD measurements to capture the upper ocean structure including during low-wind conditions when significant stratification was present [Sep. 19-24]
PLAY 5: Repeated ice-open water survey – The ship made 14 transects from open water to sea ice across a 1 psu salinity gradient to capture the evolution of the upper ocean during the approach to freeze-up; Strong surface signals were observed at the north end of the line and an eddy was observed in the south [Sep. 24-28]
What Types of Tools Were Used in Each Play? ["SASSIE Tools" page]

|

|

|

|
|
| PLAY #1 | Recovered, charged & redeployed Wave Gilders (WG); Conducted JetSSP surveys; PALS first flight | uCTD survey (& CTD casts in ice) along 150°W | Deployed Under Ice Float, ALAMO, and 4 ALTOs | Deployed & recovered a line of SWIFTs; Deployed SVP-S2, 2 UpTempOs, and 2 Ice Mass Balance buoys (IMBs) in ice |
| PLAY #2 | PALS flight above ship's zig-zag pattern | Continuous uCTD (& several CTD casts in heavy seas or ice) | ALAMO float deployed at furthest east point of survey | SVP drifter deployed at furthest east point of survey |
| PLAY #3 | JetSSP survey beside SWIFTs; PALS survey flights continued | CTD casts in ice | SVP-S and IMB deployed in moderate ice cover; Two SWIFTs deployed & recovered | |
| PLAY #4 | WGs recovered, recharged & redeployed two WGs; JetSSP deployments | Continous uCTD around drifters | ALAMO deployed at south end of survey area | SVP-S, SWIFTs, and UpTempO deployed; SWIFTs recovered |
| PLAY #5 | Recovered, recharged & redeployed 2 WGs; JetSSP deployments; All WGs recovered | Continuous uCTD | ALAMO deployed | Two SVP-S drifters and 3 SWIFTs deployed; All SWIFTs recovered; IMB deployed in water |
How are we testing our hypothesis?
Analyzing data from the September 2022 cruise:
The primary aim of the field campaign was to capture the upper ocean structure during the transition from summer sea ice retreat to autumn sea ice advance. We are quantifying the strength, size, and depth of fresh near-surface anomalies resulting from melting ice; the horizontal and vertical structure of those fresh anomalies as they evolve due to air-sea fluxes and waves, ocean currents and mixing; and the ocean conditions and the presence of sea ice as it begins to form.
| 2022 Field Campaign Overview | |||
|---|---|---|---|
| August | September: Intensive Observing Period (IOP) | October and Beyond | |
| Platforms | Small vessels deployed instruments ahead of the IOP | Large vessel (Woldstad), Unmanned Aerial Systems, Aircraft with salinity and other sensors | Some instruments will remain behind to measure freeze-up conditions |
| Key instruments [tools page] |
Autonomous Assets – Wave Gliders, Ice Mass Balance buoys |
Ship – Underway CTD, Salinity Snake, Air-sea flux sensors
Piloted and Drifting Assets – Wave Gliders, SWIFT, UIF, Surface Velocity Program Drifters, UpTempO buoys, Jet Surface Salinity Profiler
|
UpTempO buoys, UIF, SWIFT and Surface Velocity Program Drifters |
| Satellite & other data |
Salinity – Soil Moisture Active Passive (SMAP), Soil Moisture Ocean Salinity (SMOS)
Temperature – NOAA Optimum Interpolation Sea Surface Temperature (OISST)
Sea Ice Properties, Motion, and Melt – National Snow and Ice Data Center, ICESat-2, Synthetic Aperture Radar
Air-sea Fluxes – NASA Modern-Era Retrospective analysis for Research and Applications (MERRA), European Centre for Medium-Range Weather Forecast (ECMWF), and others
|
||