Highlights

Air-Sea Interactions: Hurricanes

  • Hurricane Katia
    Hurricane Katia
  • Storm surge
    Storm surge
    Hurricanes intensify as they travel over warm ocean water.
    Hurricanes intensify as they travel over warm ocean water, threatening lives with powerful winds, heavy rainfall, storm surges, and coastal and inland flooding.
  • Around 70% of hurricanes that reached Category 5 crossed the Amazon/Orinoco river plume.
    Around 70% of hurricanes that finally reached Category 5 crossed the Amazon/Orinoco river plume, according to a 2007 study.
  • River plumes can extend thousands of miles offshore.
    These plumes can extend thousands of miles offshore. Their waters are usually fresher, warmer, and carry more dissolved organic matter than the surrounding ocean.
  • Monitoring the Amazon/Orinoco River is an important application of salinity data.
    The Amazon/Orinoco River plume extent changes not only over weeks and months ... but also from year-to-year. Monitoring the plume is an important application of salinity data.
 «» 
1 2 3 4 5

"Even in the middle of a hurricane, the bottom of the sea is calm." - Wayne Muller

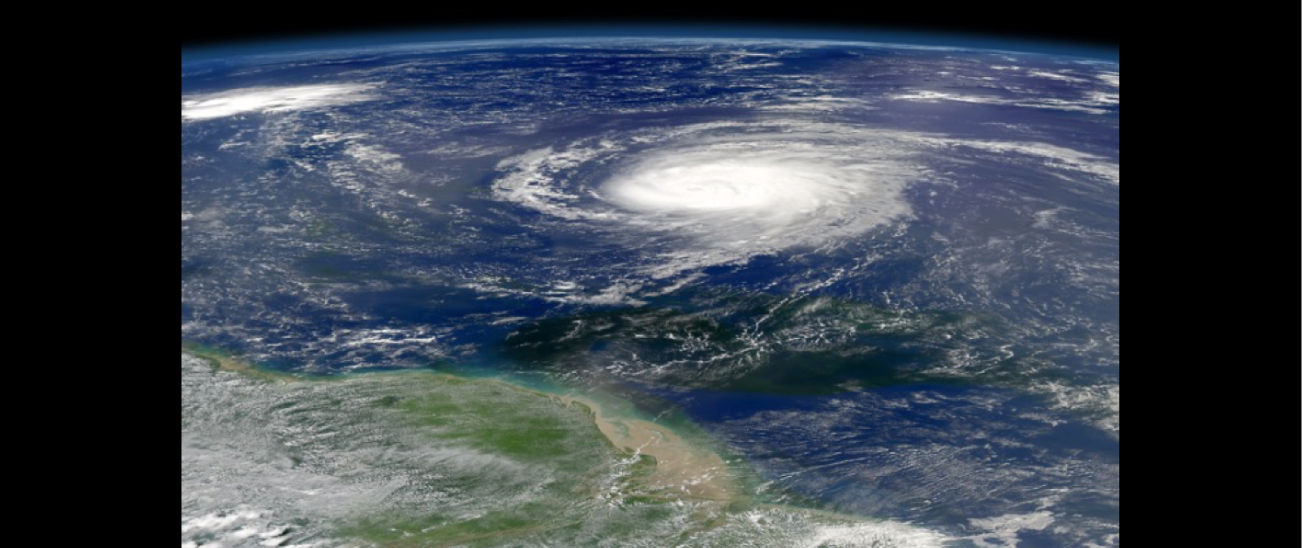
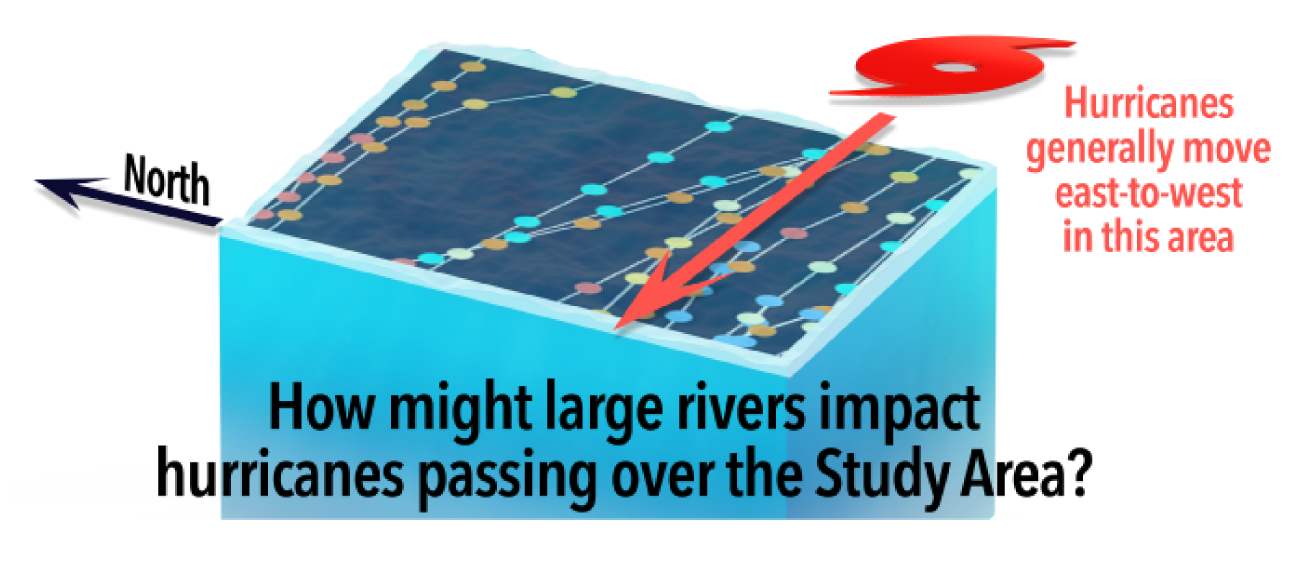
Watching hurricanes slowly creeping toward land can be alarming. However, it is also important to track these storms' path over the ocean, which greatly influences their strength.

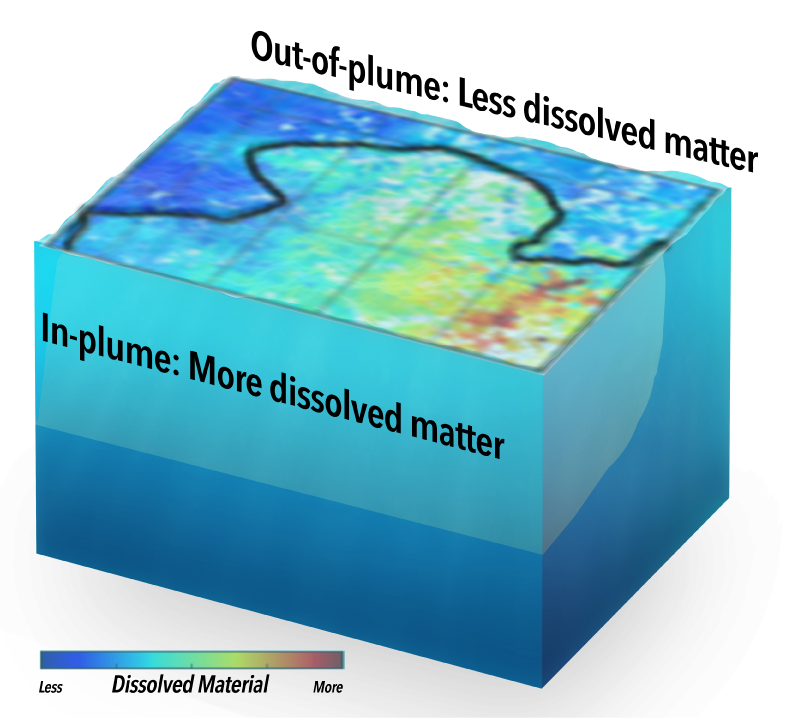
Satellite data such as sea surface temperature and height help scientists understand the ocean heat content available for storm intensification. Current forecasting tools do not include the effects of salinity, but new research shows that low sea surface salinity caused by the outflow of major rivers can have a considerable impact on how storms intensify. Why?

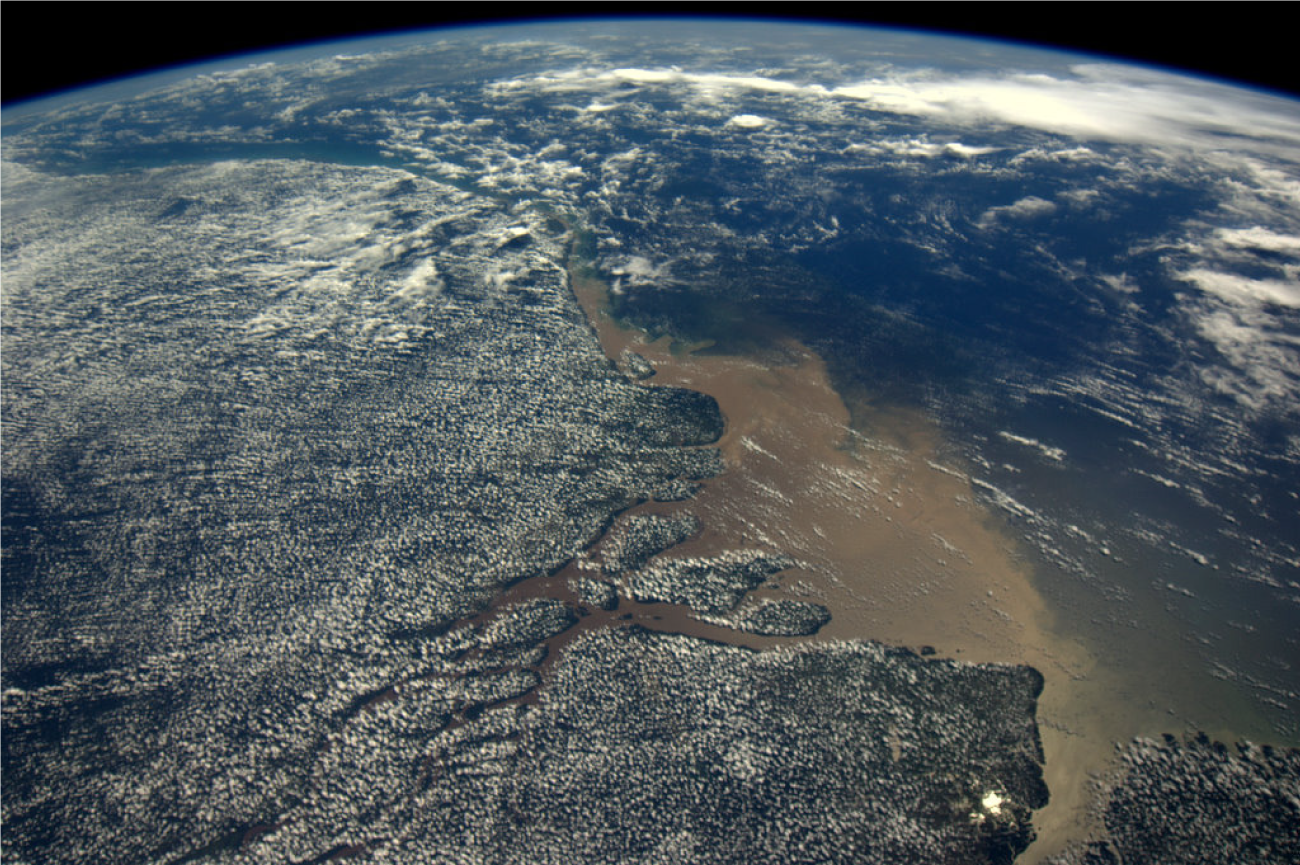
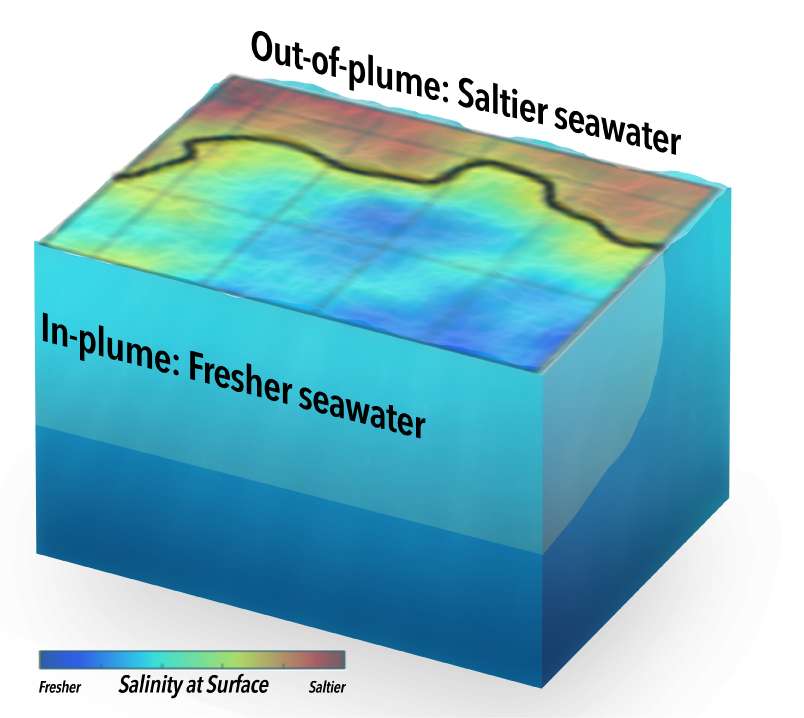
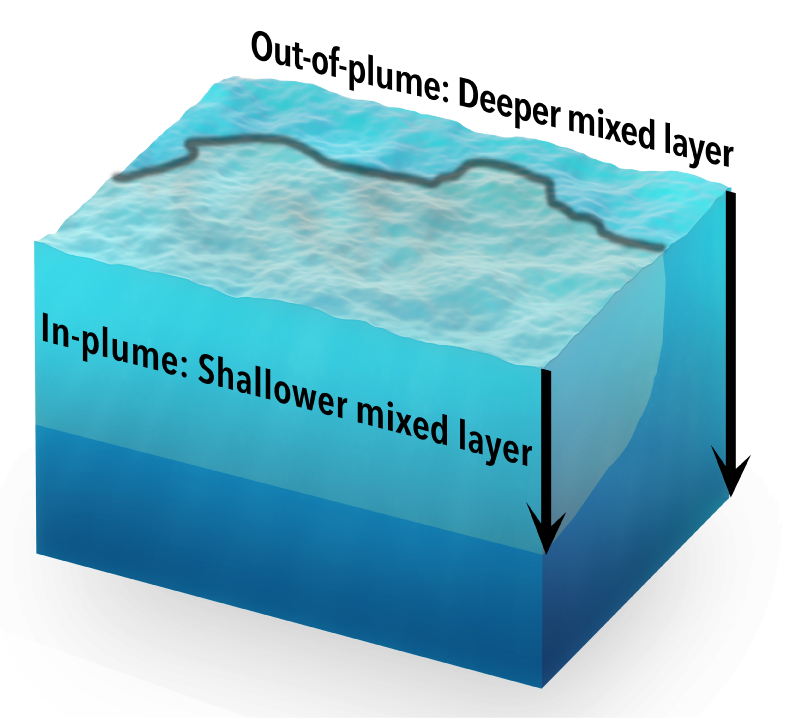
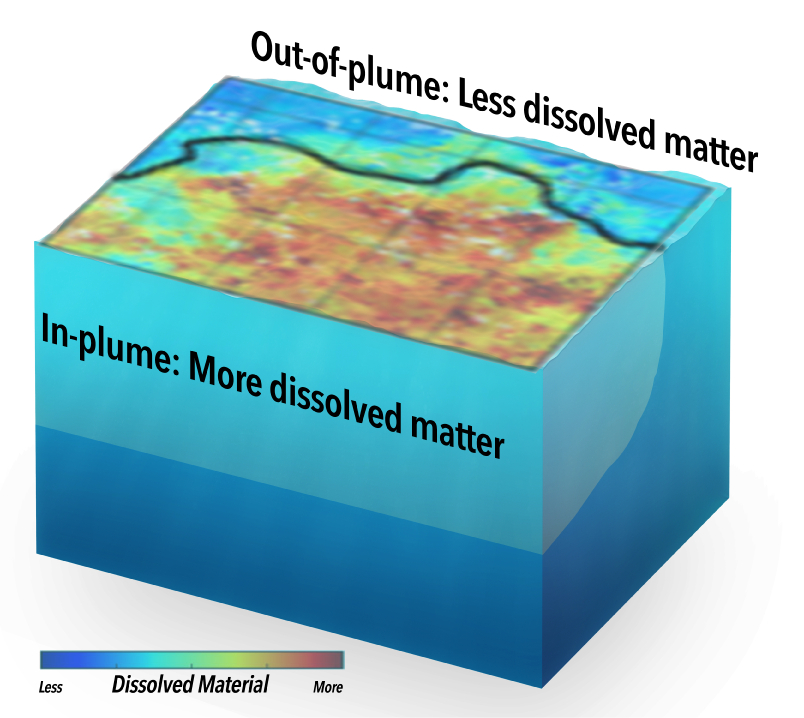
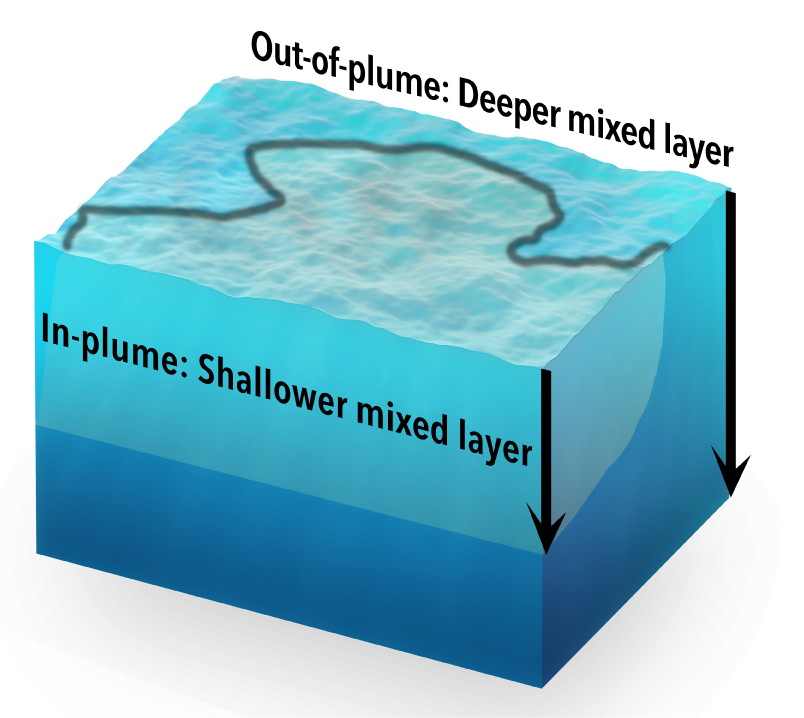
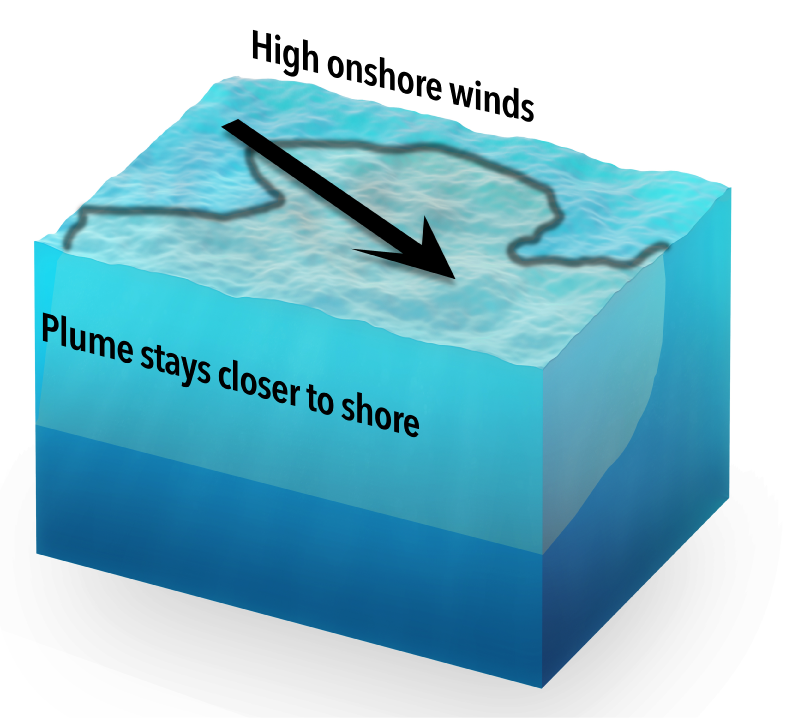
Outflow from rivers can form and maintain thin layers at the sea surface. Underneath, there can be a "barrier layer" where salinity changes dramatically, isolating the upper ocean from water below. This type of stratified water column can intensify passing hurricanes. How?

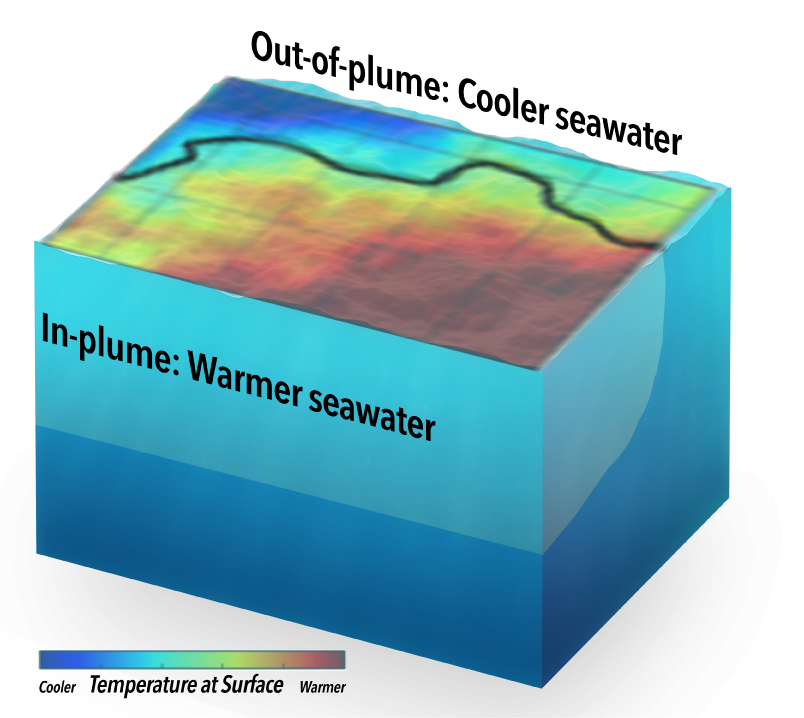
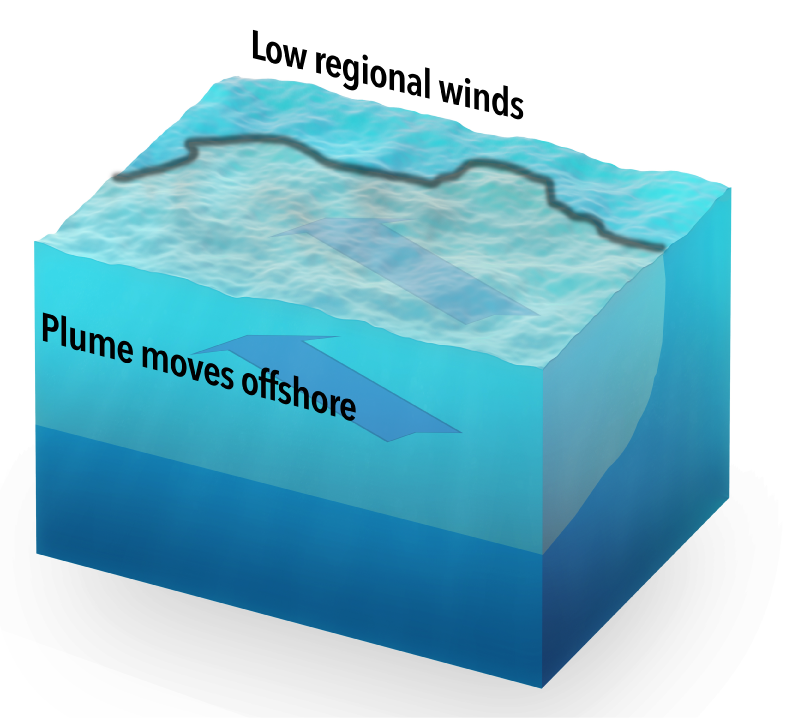
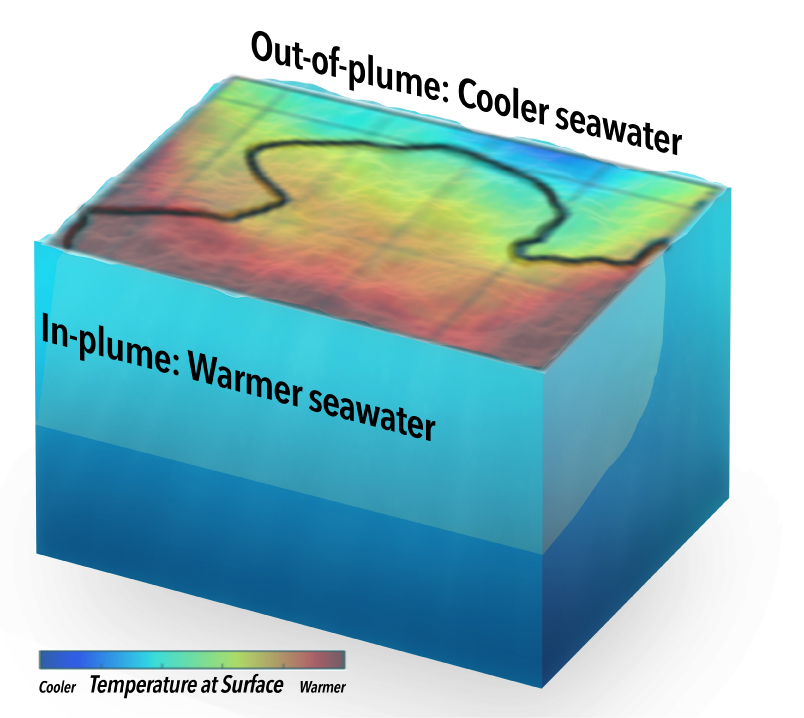
The answer is heat. Thinner surface layers warm up more quickly than surrounding waters. Not only that, the underlying barrier layer makes "stirring up" the water column by hurricanes - which brings up cold water in most places – more difficult. So, monitoring how certain river plumes change over time is key to understanding interactions between the ocean and hurricanes.

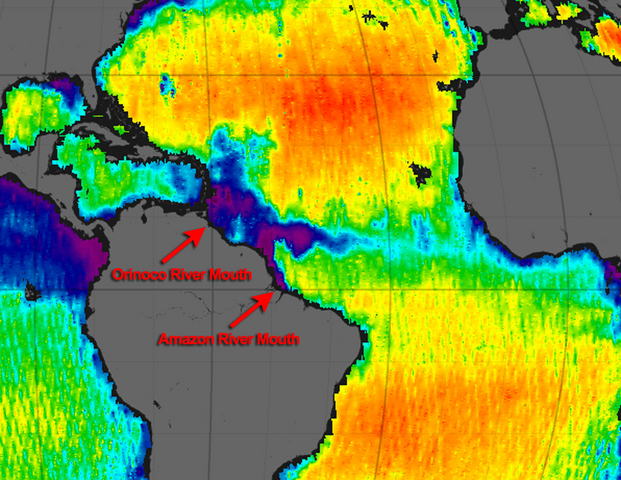
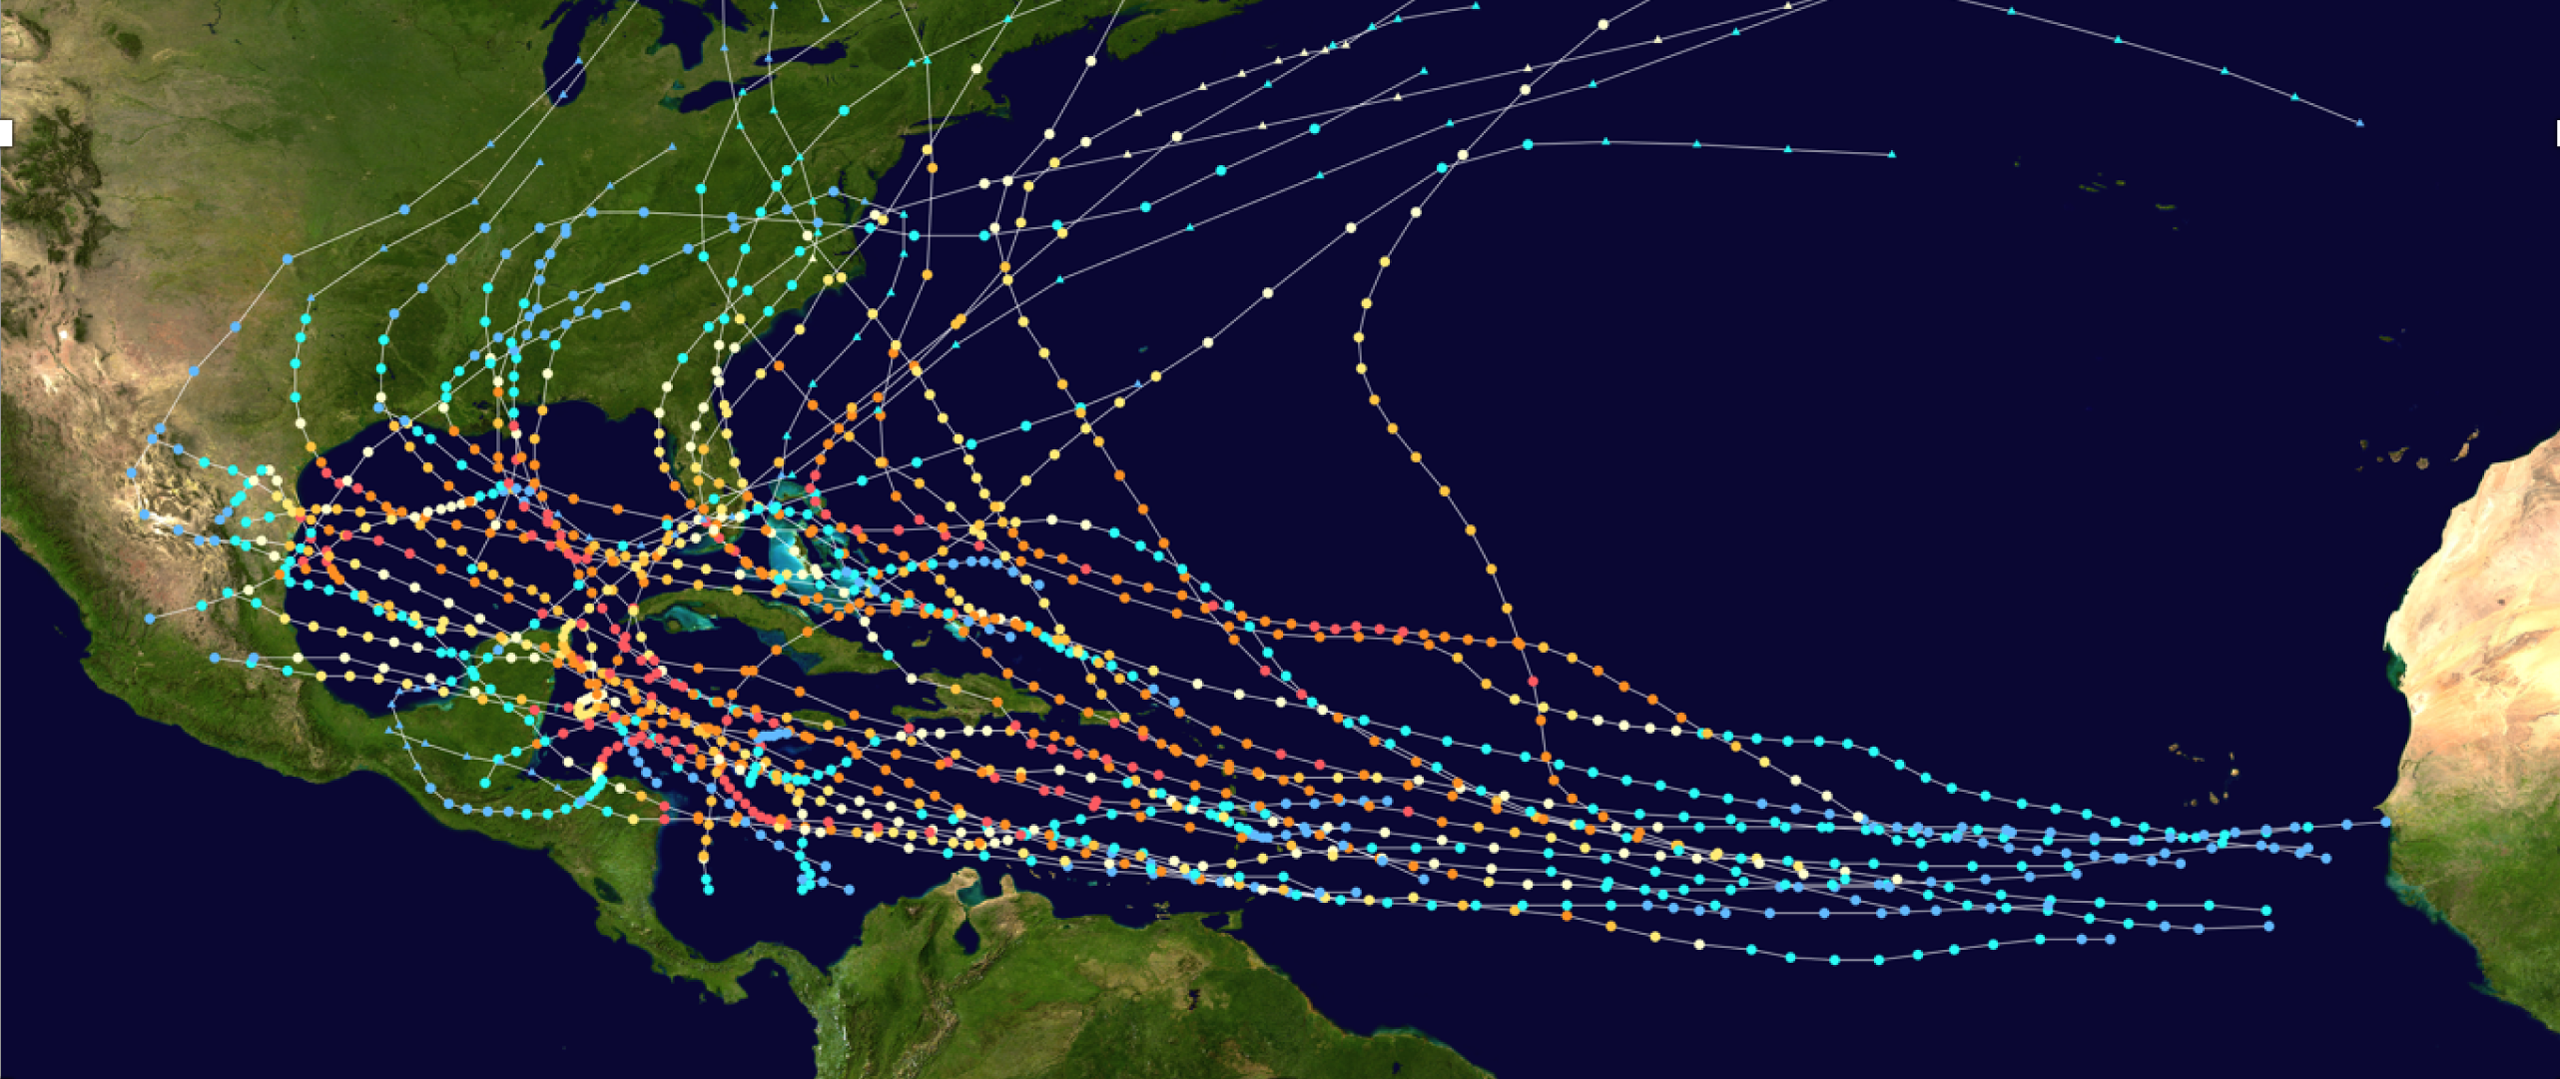
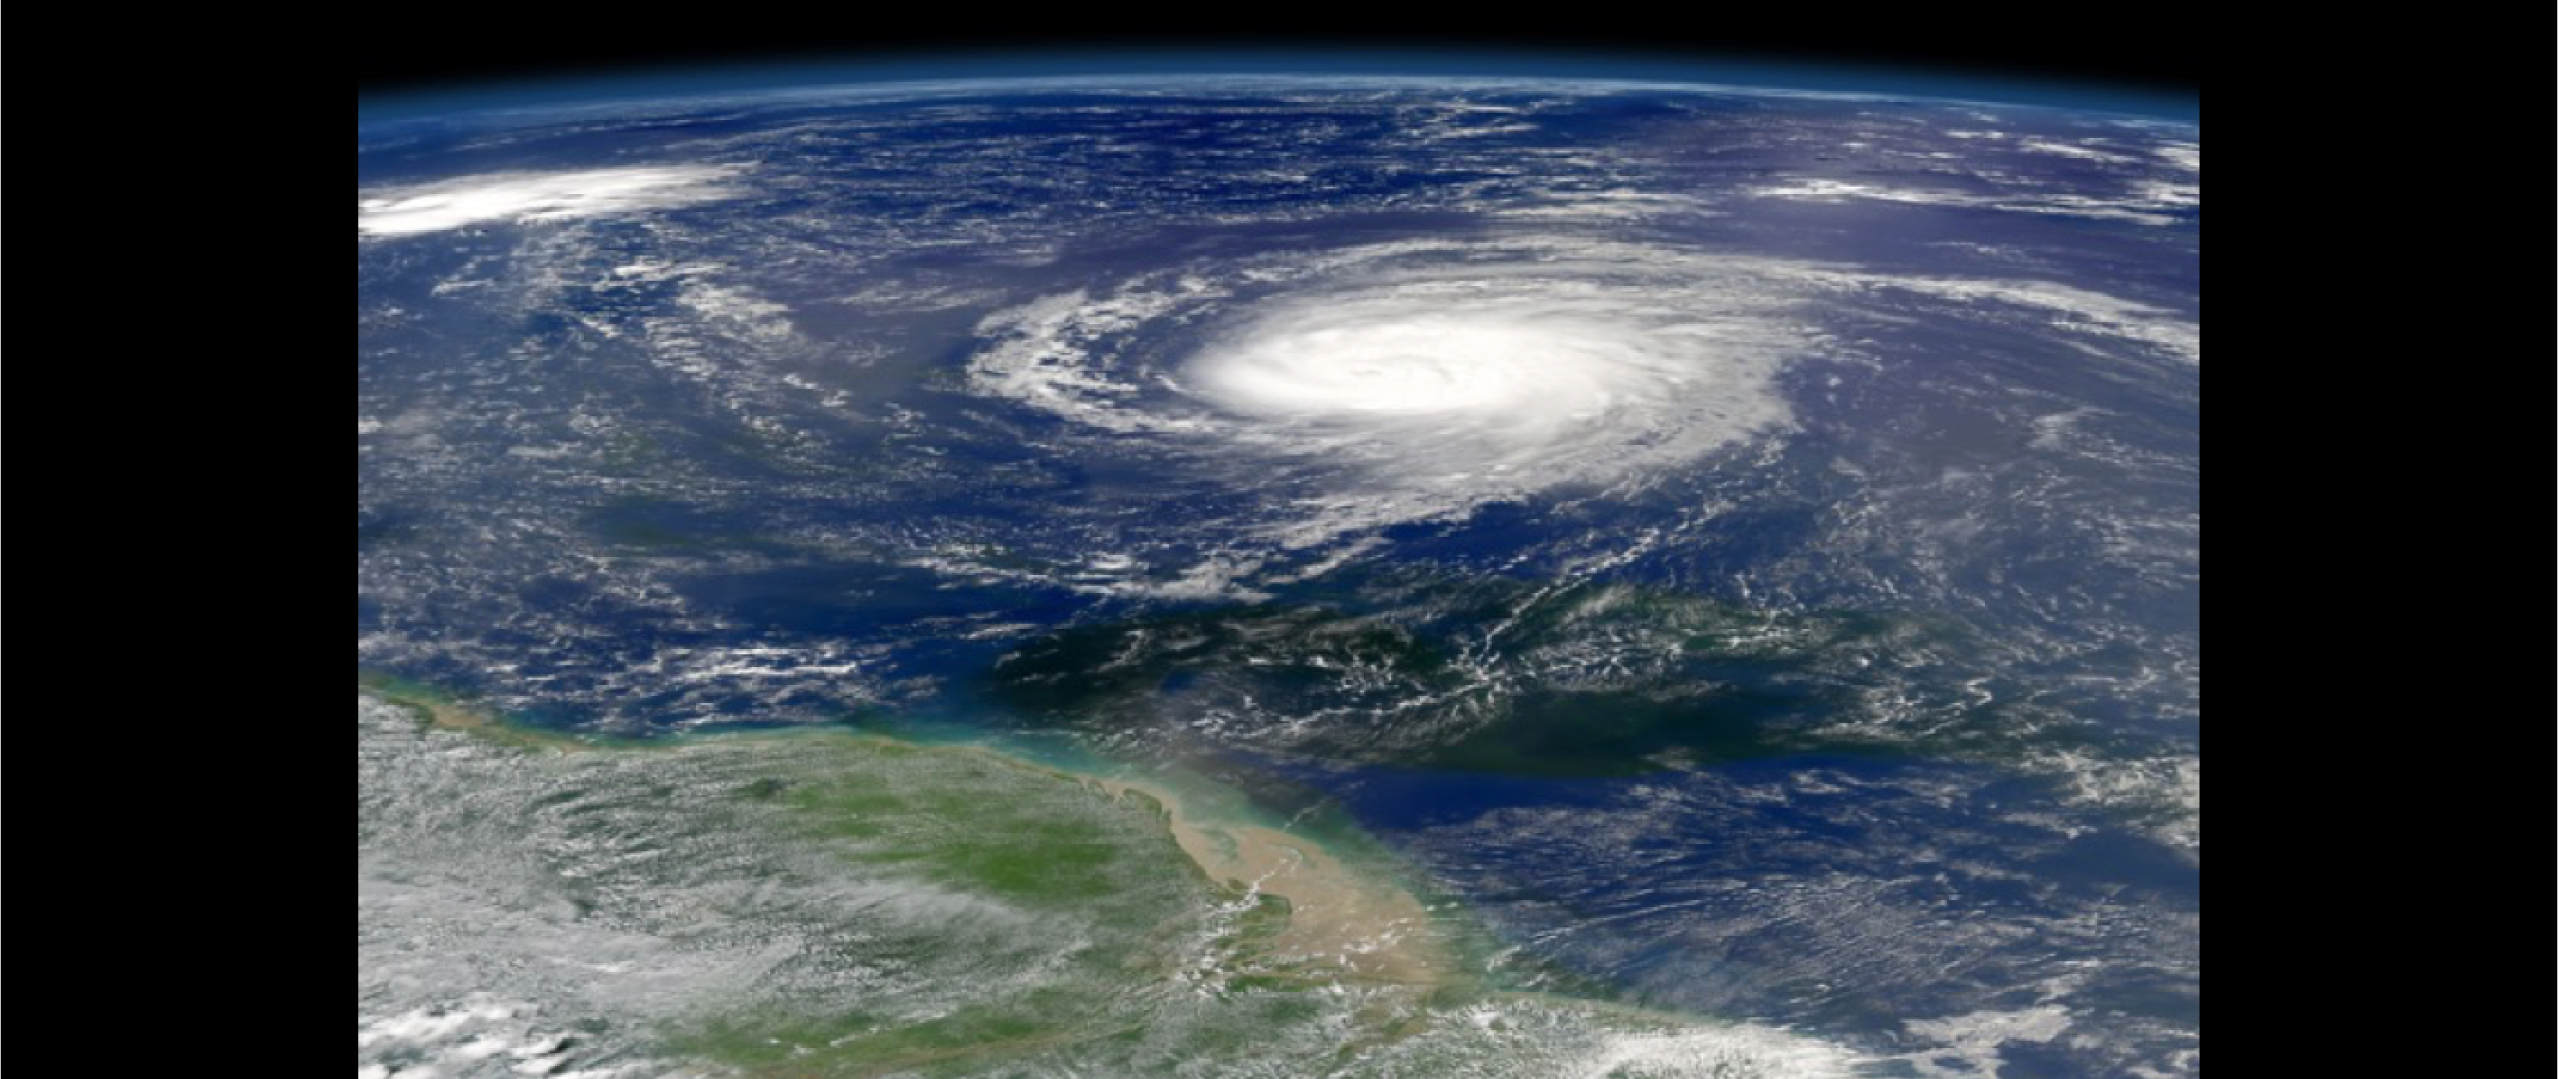
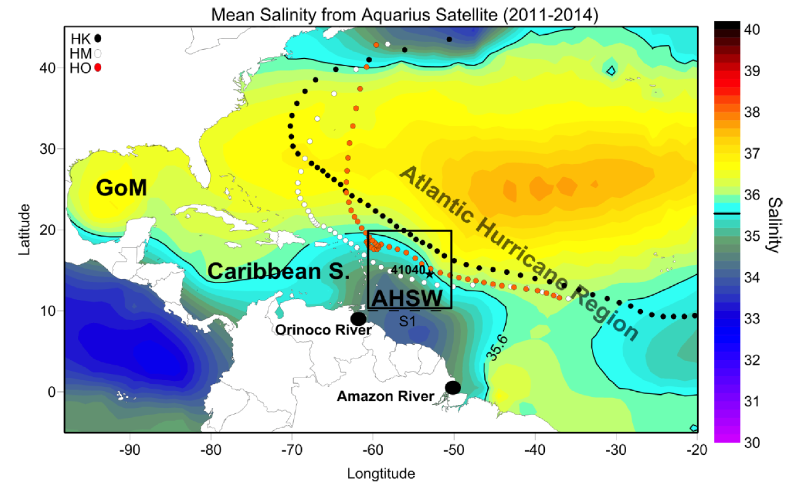
Use the tool below – based on a 5-year study by Fournier et al. (2017) – to investigate the characteristics of the Amazon/Orinoco plume during 2010 and 2014. Located in the eastern Caribbean Sea, the study area has been shown to lie directly in the path of many Atlantic hurricanes. Use the buttons to toggle between years or among data types.

tabs_shortcode2

Related Publications

  • Li, W., Wang, Z., Lee, G., and Huang, H. (2024). Ecological and Sediment Dynamics Response to Typhoons Passing from the East and West Sides of the Changjiang (Yangtze River) Estuary and its Adjacent Sea Area, Mar. Geol., 467, 107188, doi: 10.1016/j.margeo.2023.107188.
  • Zhang, H., Liu, Y., Liu, P., Guan, S., Wang, Q., Zhao, W., and Tian, J. (2023). Enhanced upper ocean response within a warm eddy to Typhoon Nakri (2019) during the sudden-turning stage, Deep Sea Res. Part I Oceanogr. Res. Pap., 104112, doi: 10.1016/j.dsr.2023.104112.
  • Chacko, N. and Jayaram, C. (2022). Response of the Bay of Bengal to super cyclone Amphan examined using synergistic satellite and in-situ observations, Oceanologia, 64(1), 131-144, doi: 10.1016/j.oceano.2021.09.006.
  • Knaff, J., Sampson, C., Kucas, M., Slocum, C., Brennan, M., Meissner, T., Ricciardulli, L., Mouche, A., Reul, N., Morris, M., Chirokova, G., and Caroff, P. (2021). Estimating Tropical Cyclone Surface Winds: Current Status, Emerging Technologies, Historical Evolution, and a Look to the Future, Trop. Cyclone Res. Rev., 10(3), 125-150, doi: 10.1016/j.tcrr.2021.09.002.
  • Nyadjro, E.S., Wang, Z., Reagan, J., Cebrian, J., and Shriver, J.F. (2021). Bio-Physical Changes in the Gulf of Mexico During the 2018 Hurricane Michael, IEEE Geosci. Remote Sens. Lett., doi: 10.1109/LGRS.2021.3068600.
To view all salinity publications, visit the publications page.
Difference in salinity after the hurricane passed over the plume Difference in temperature after the hurricane passed over the plume
Use the slider to compare changes in salinity and temperature of the Amazon River plume, outlined in black. For both images, crosses (+) show daily locations of Hurricane Katia in late August and early September 2011. The size of each cross indicates strength of sustained winds on that day. Colors indicate differences in conditions after the hurricane passed over the plume. For example, red areas of salinity got saltier and blue areas of temperature cooled down, indicating erosion of the surface barrier layer by the storm. Later hurricanes (Maria and Ophelia) did not intensify as the eroded barrier layer (due to Katia passage) allowed an increase in upper ocean cooling (Androulidakis, et al., 2016).

Featured Publications

Five years of summertime storm tracks for North Atlantic tropical cyclones within a 2 month period between 15 July and 15 September in the years 2010–2014

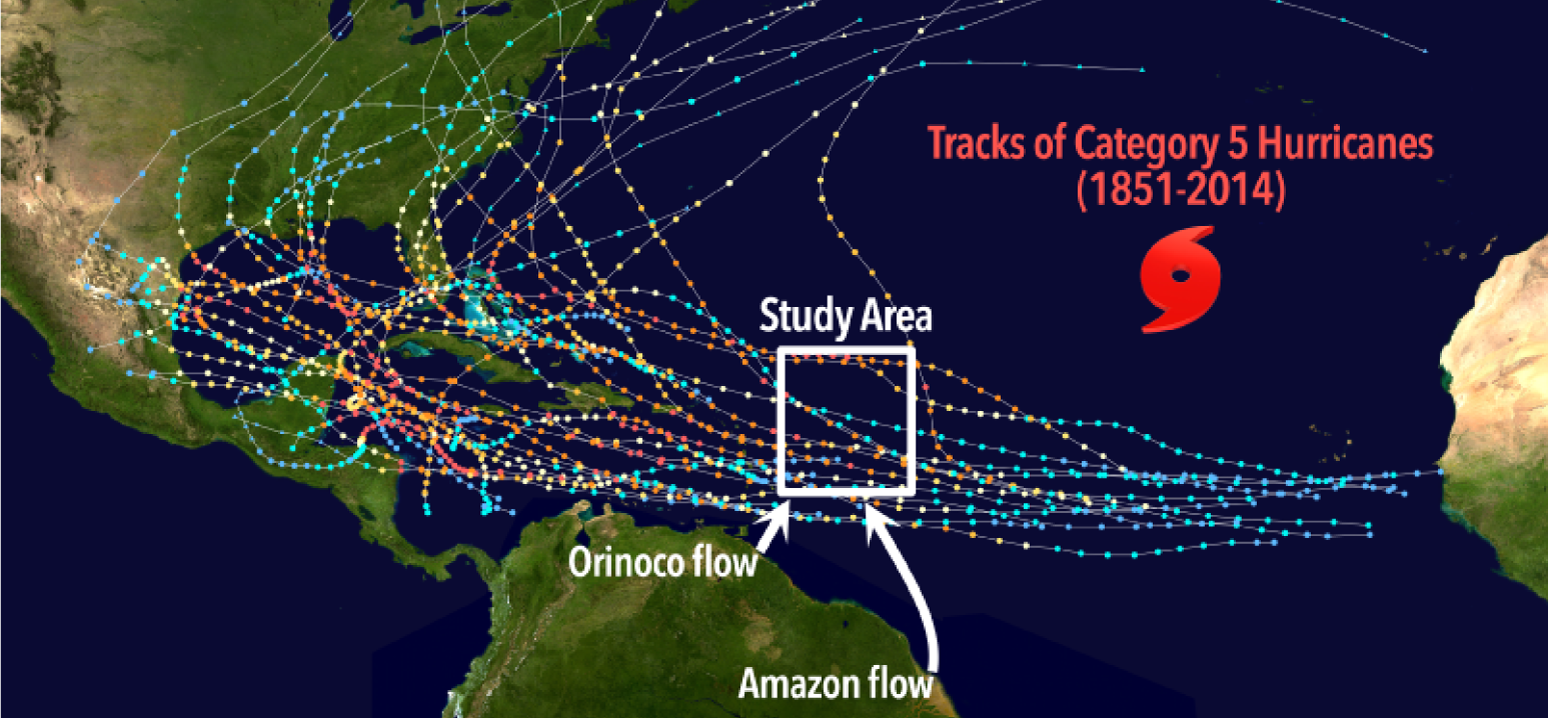
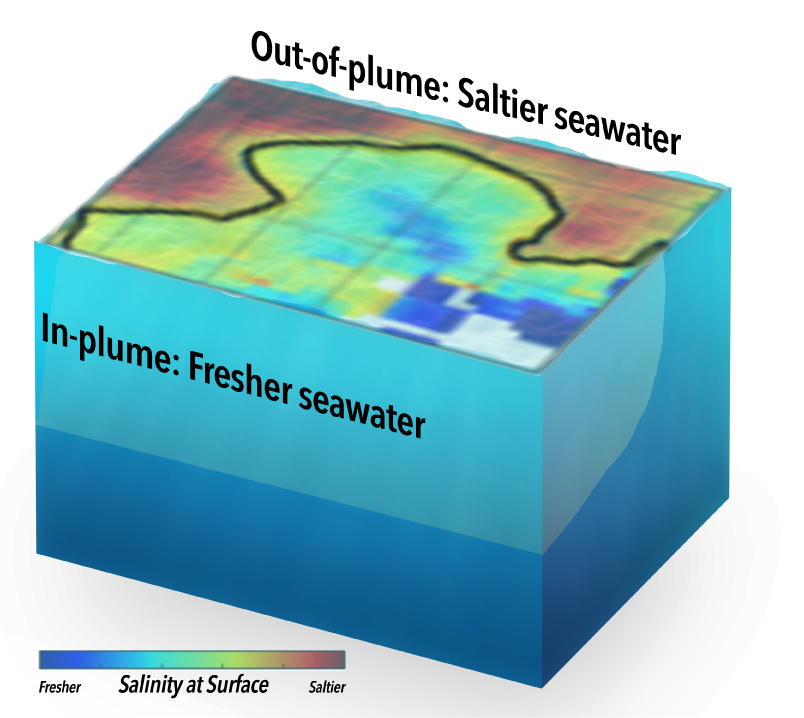
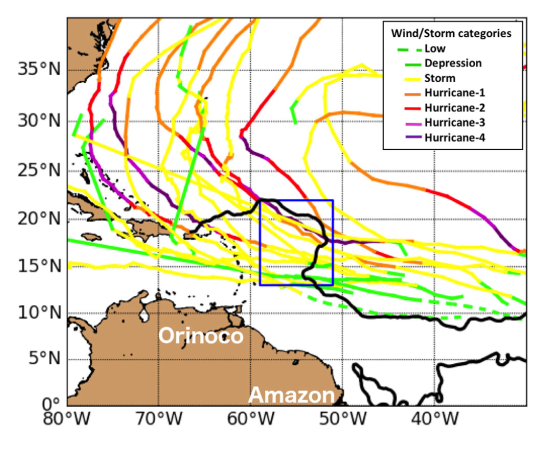
This study investigates sea surface salinity and sea surface temperature variations in the tropical Atlantic east of the Lesser Antilles, a region where freshwater advection from the Amazon and Orinoco Rivers - the Amazon-Orinoco Plume - may potentially impact air-sea interaction. Persistent sea surface temperature gradients are often found near the plume edge, which may have implications for ocean-atmosphere coupling associated with atmospheric convection.

Reference

Fournier, S., Vandemark, D., Gautier, L., Lee, T., Jonsson, B., and Gierach, M.M. (2017). Read the full paper.

Salinity distribution over the river plume area formed by the Amazon and Orinoco River outflows

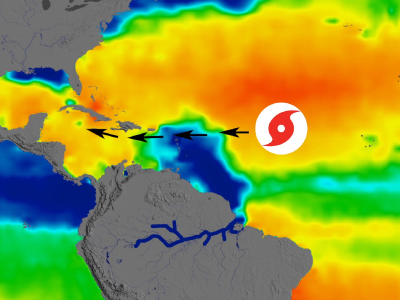
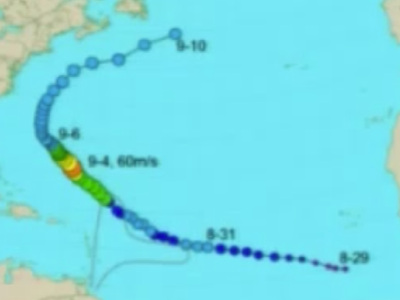
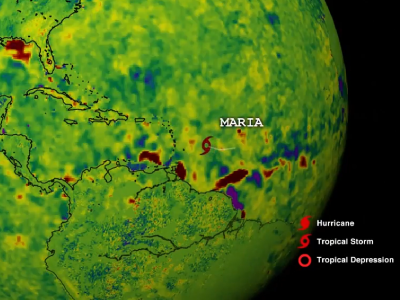
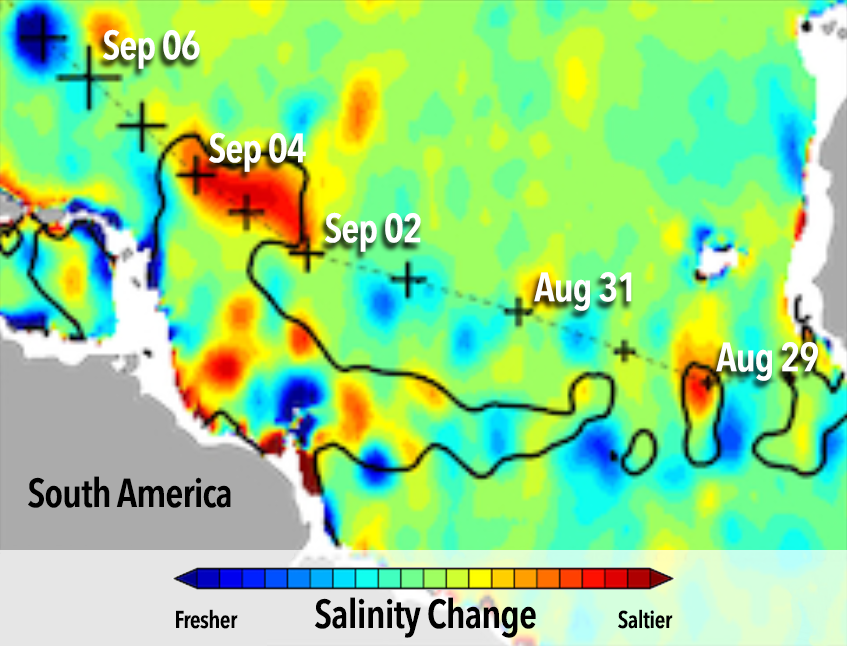
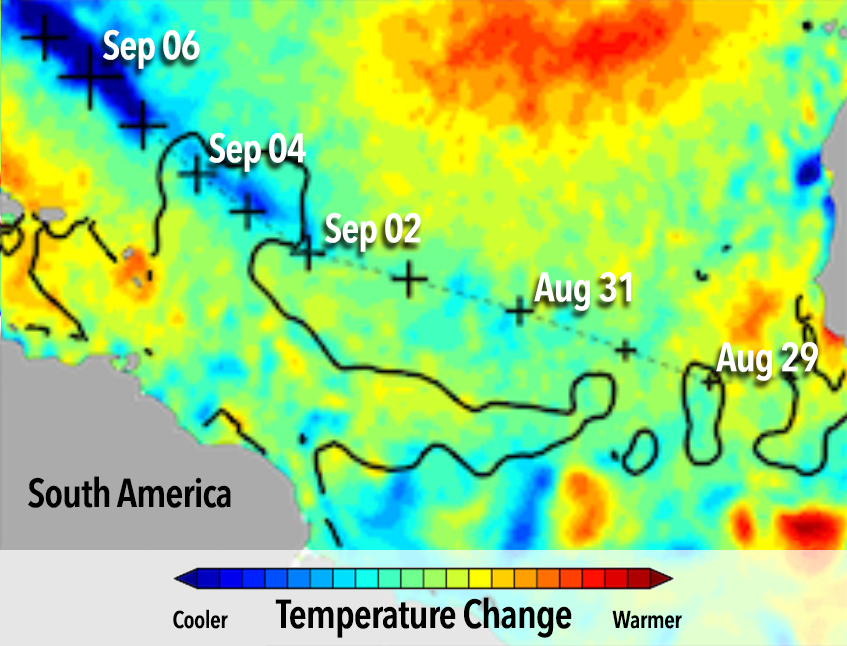
The evolution of three successive hurricanes (Katia, Maria, and Ophelia) is investigated over the river plume area formed by the Amazon and Orinoco river outflows during September of 2011. The study focuses on hurricane impacts on the ocean structure and the ocean feedback influencing hurricane intensification.

Reference

Androulidakis, Y., Kourafalou, V., Halliwell, G., Le Hénaff, M., Kang, H., Mehari, M., Atlas, R. (2016). Read the full paper.

Aquarius SSS difference between after (5–10 SEP/2011) minus before (25AUG–1SEP/2011) the passage of Katia

At its seasonal peak the Amazon/Orinoco plume covers a region of 106 km2 in the western tropical Atlantic with more than 1m of extra freshwater, creating a near‐surface barrier layer that inhibits mixing and warms the sea surface temperature to >29°C. Here new sea surface salinity observations from the Aquarius/SAC-D and SMOS satellites help elucidate the ocean response to hurricane Katia, which crossed the plume in early fall, 2011.

Reference

Grodsky, S., Reul, N., Lagerloef, G., Reverdin, G., Carton, J., Chapron, B., Quilfen, Y., Kudryavtsev, V., and Kao, H. (2012). Read the full paper.