NASA's Soil Moisture Active Passive (SMAP) mission began collecting sea surface salinity data in April 2015, overlapping with Aquarius observations for approximately three months. Using the same frequency as Aquarius (L-band; 1.41 GHz), SMAP's global salinity measurements continue the time series that began with Aquarius in August 2011.
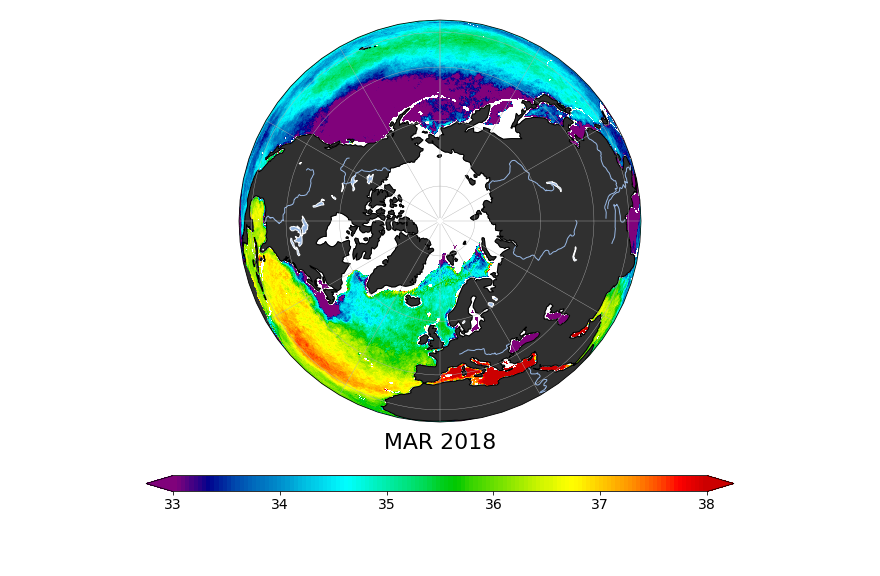
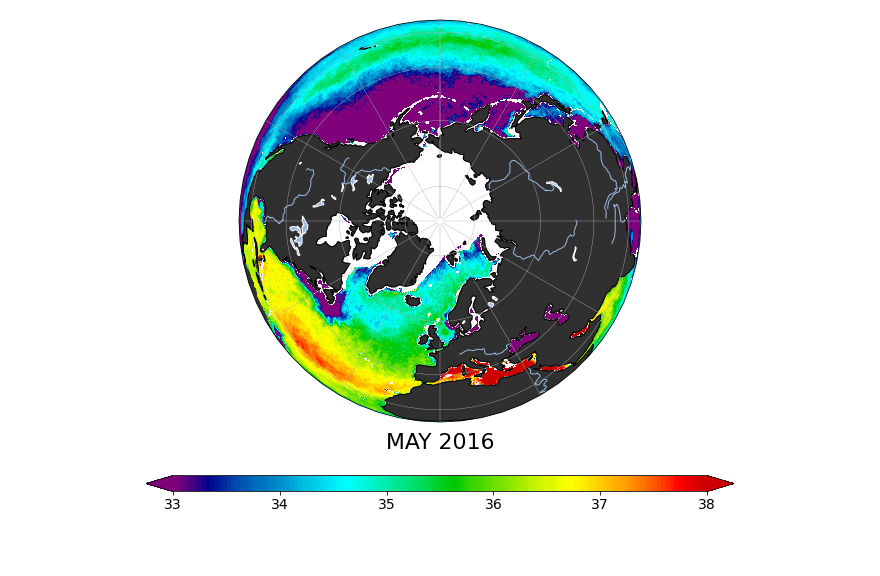
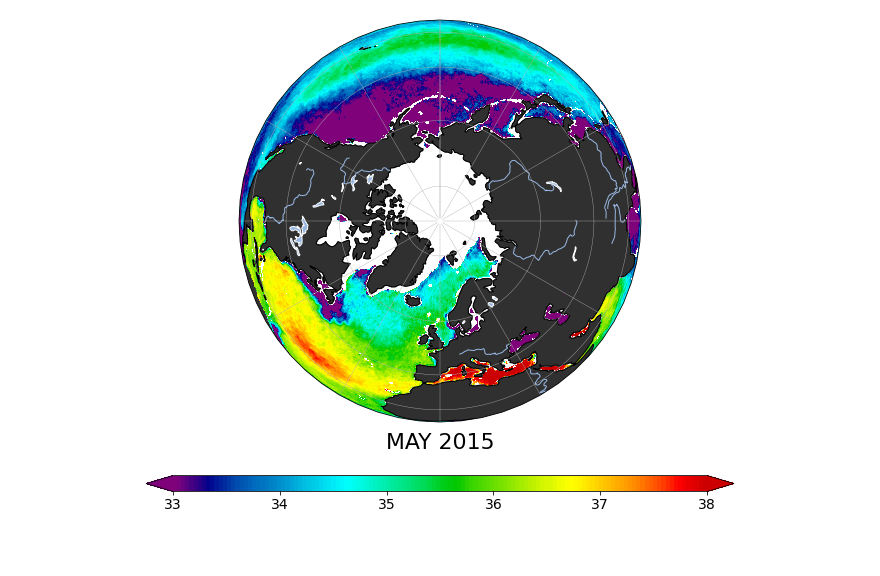
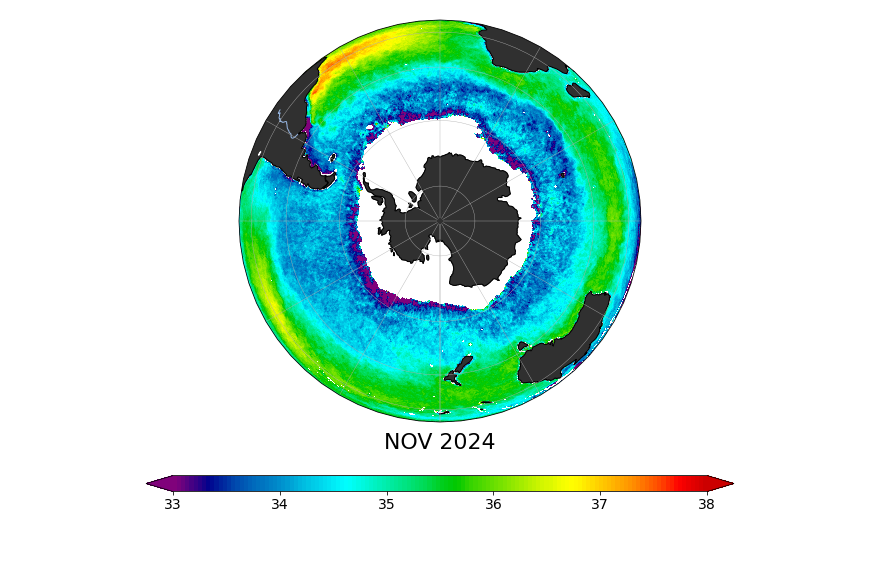
Global | Northern Hemisphere | Southern Hemisphere
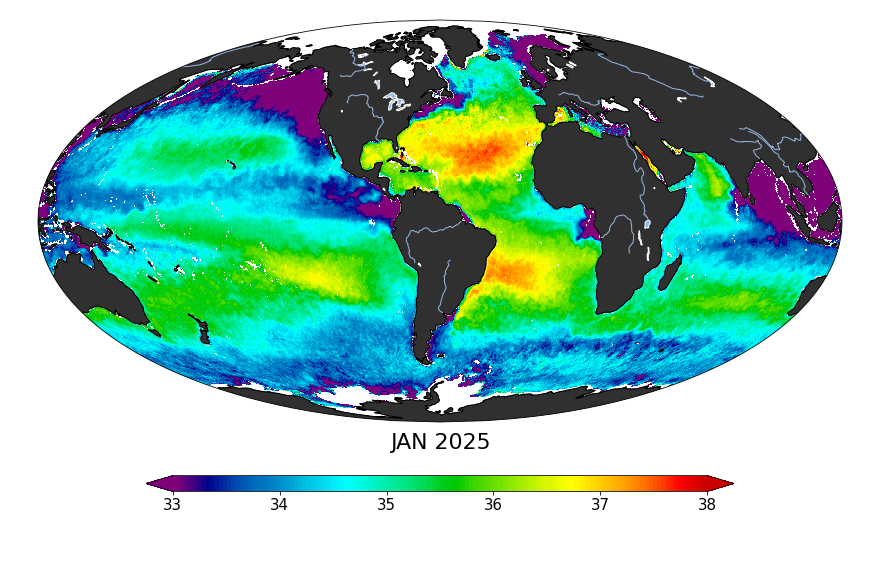
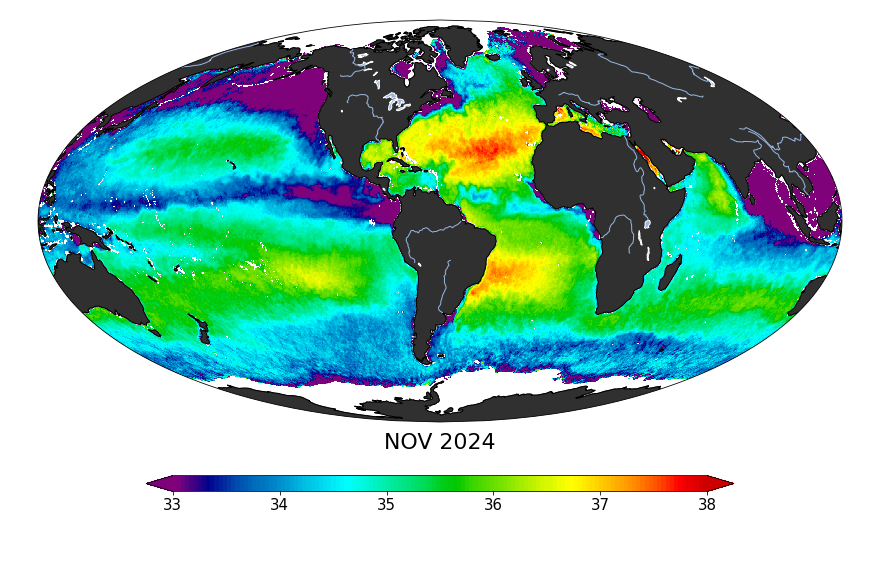
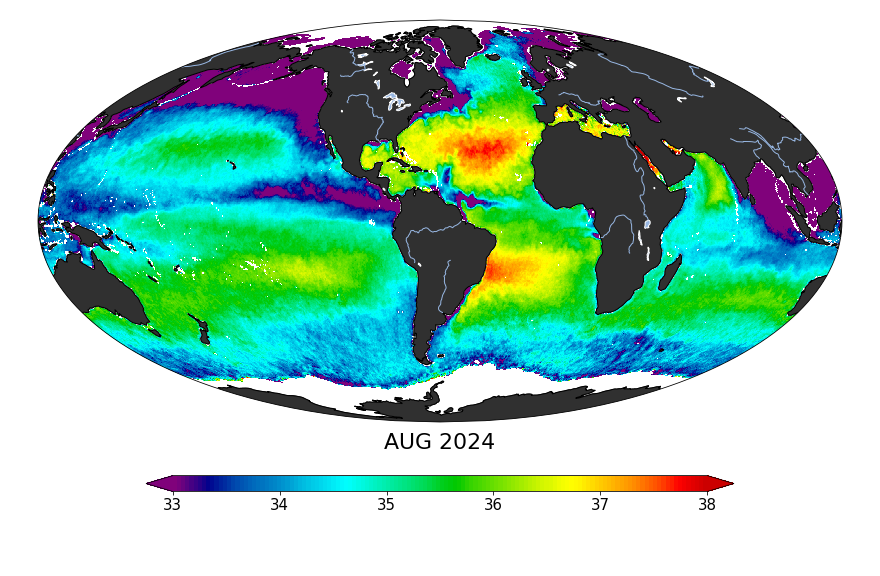
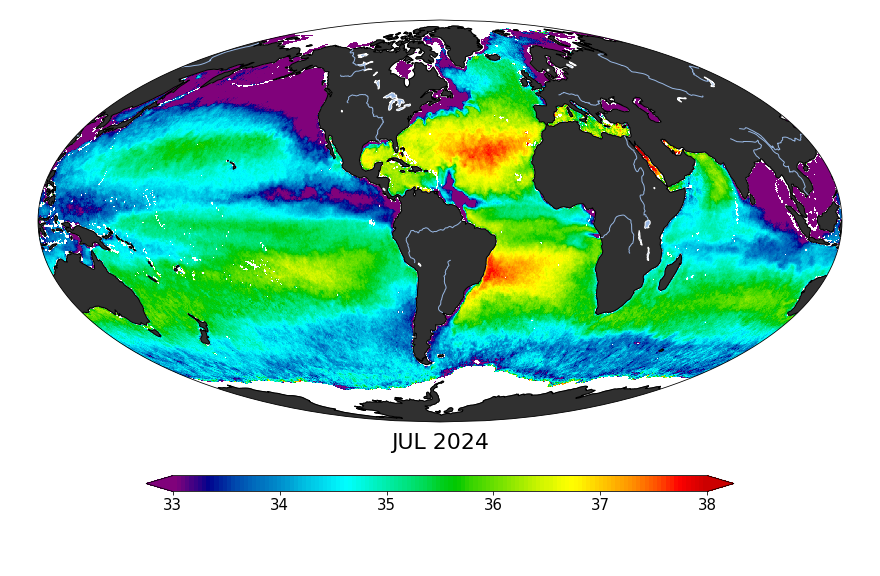
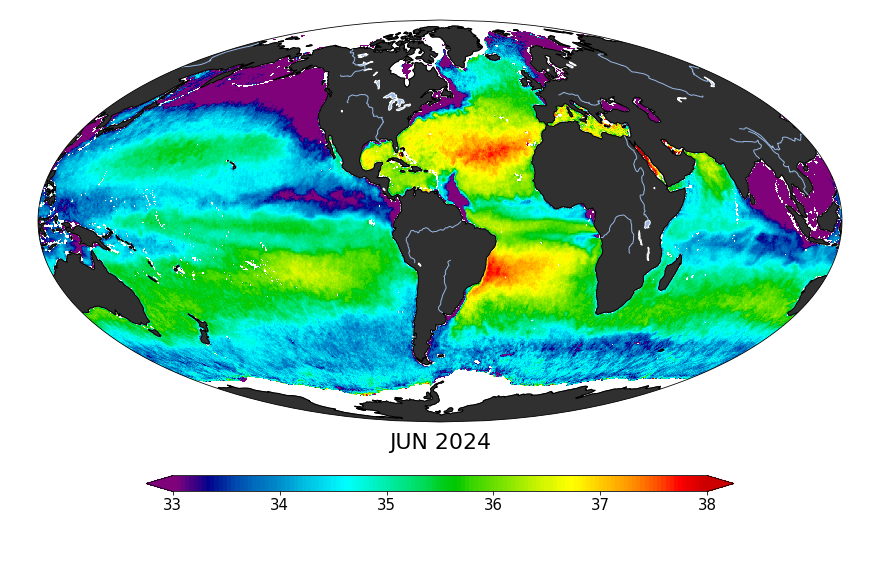
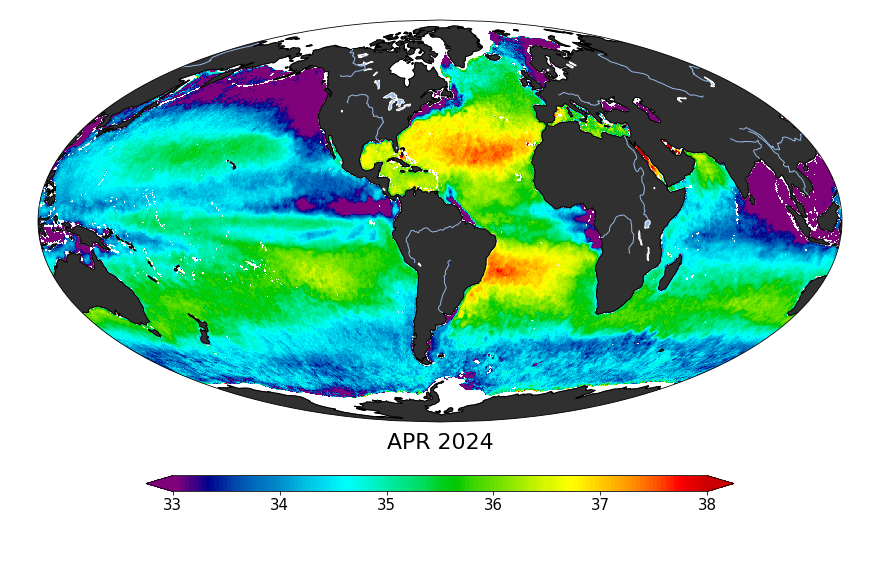
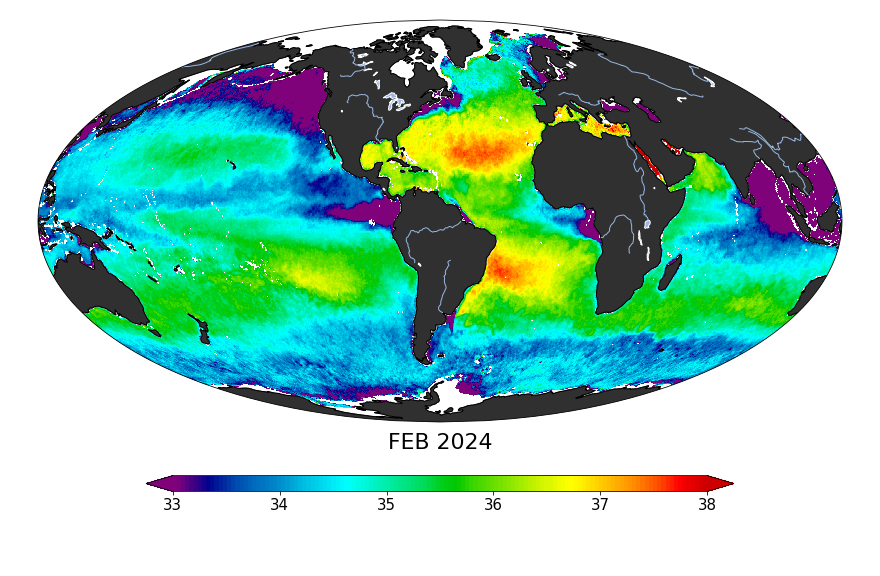
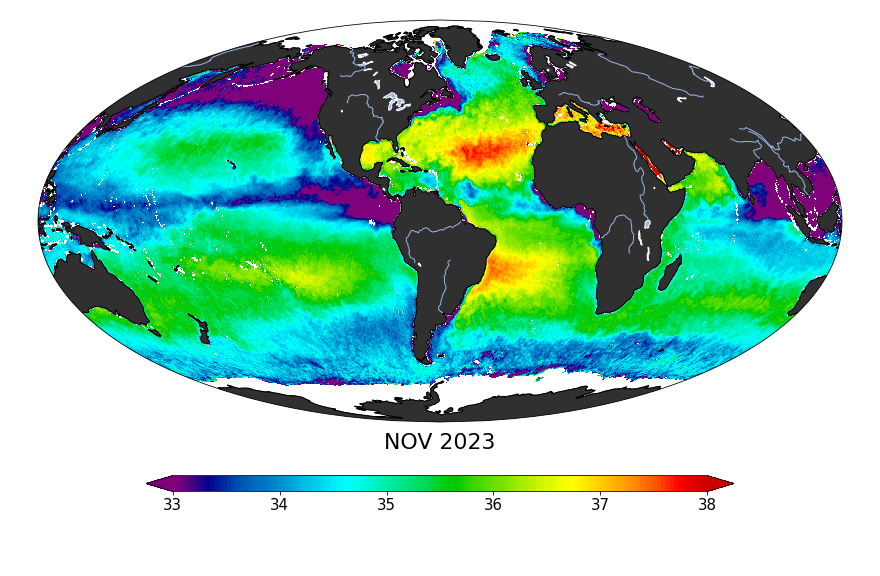
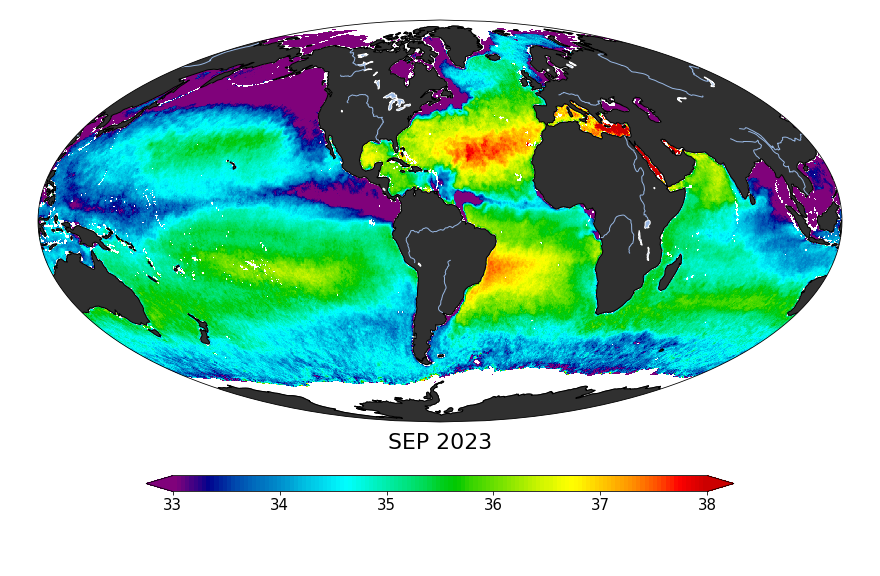
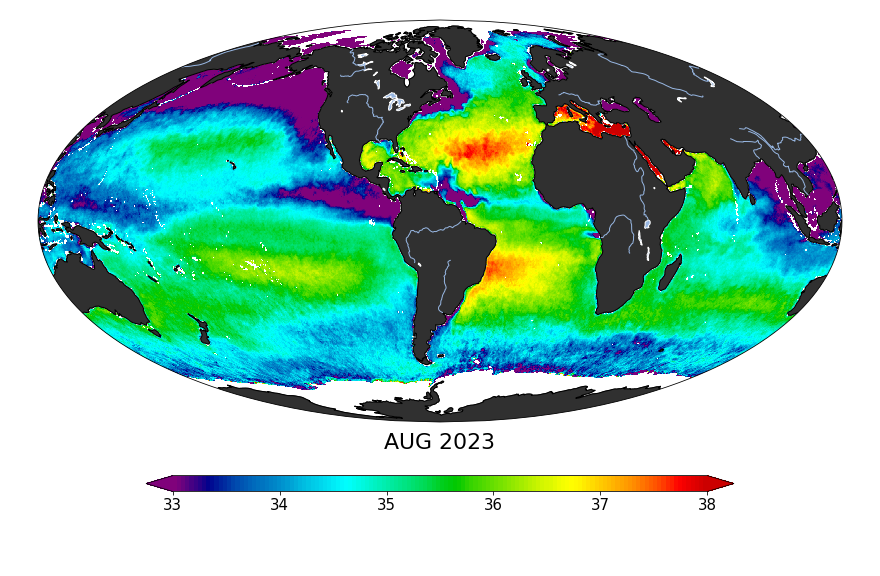
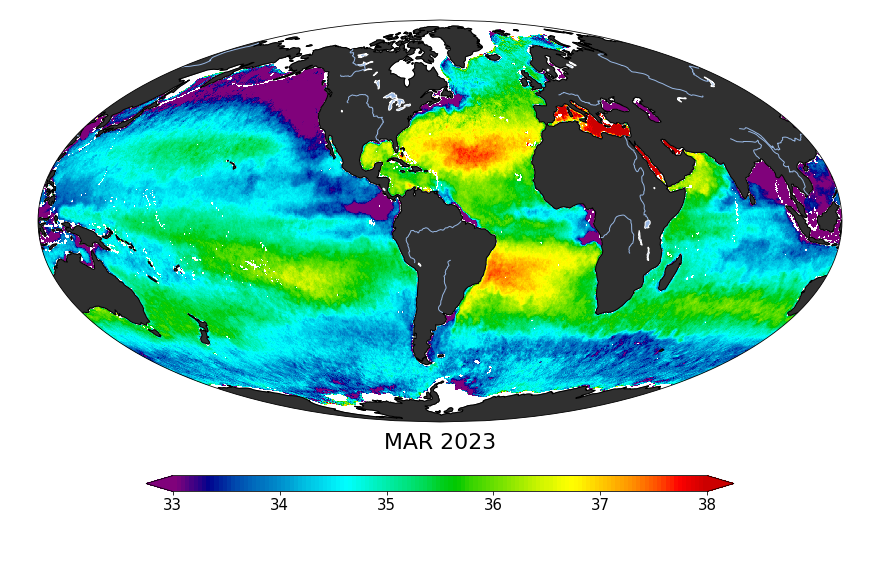
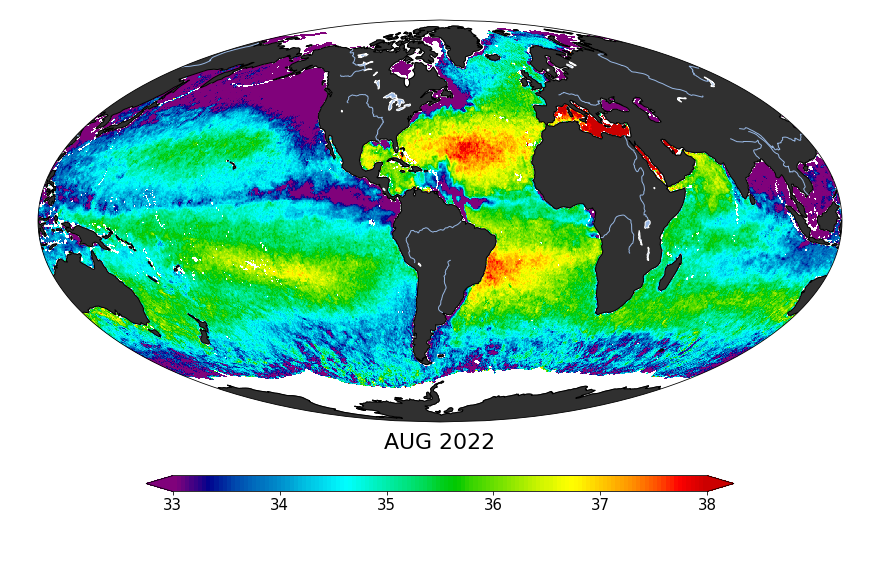
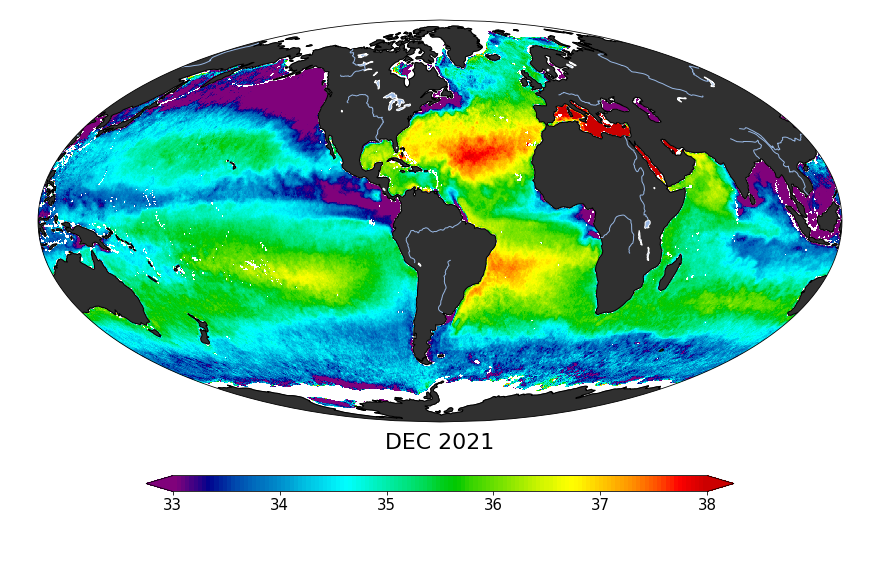
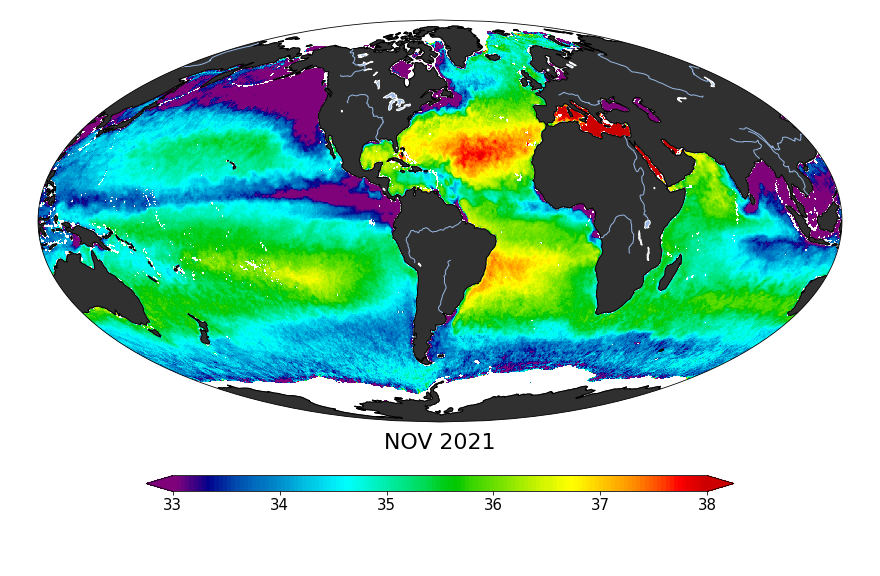
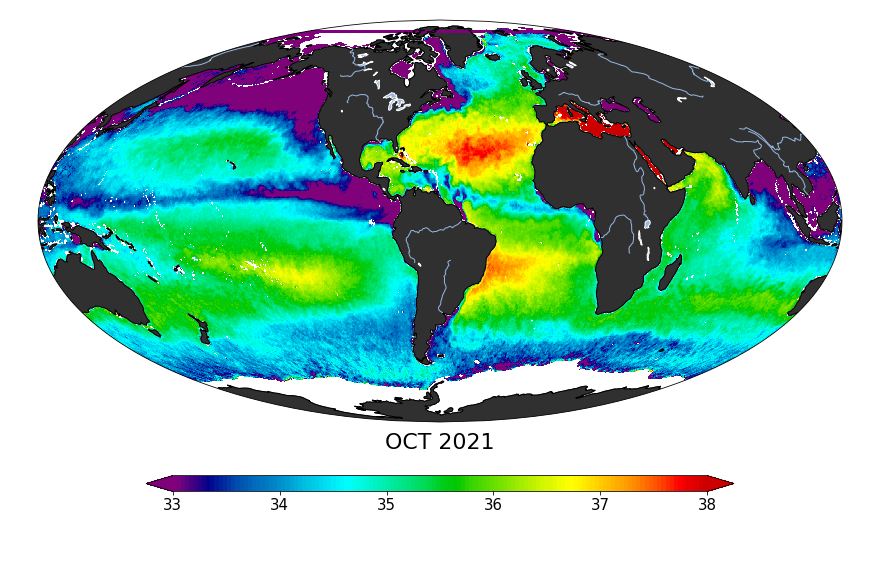
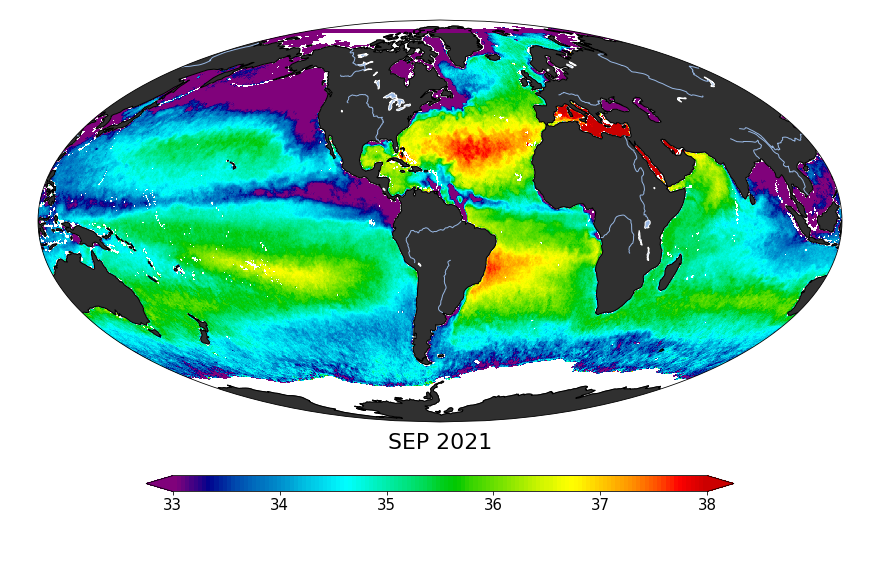
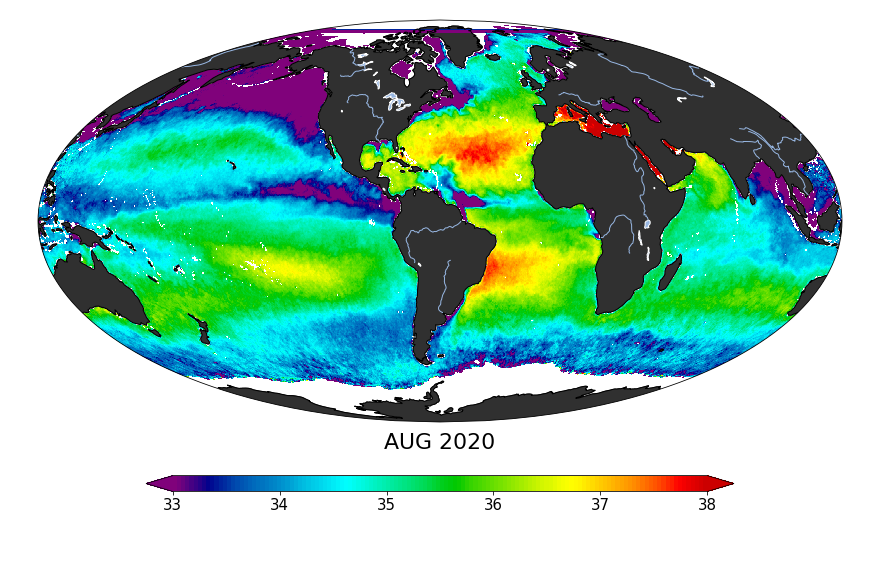
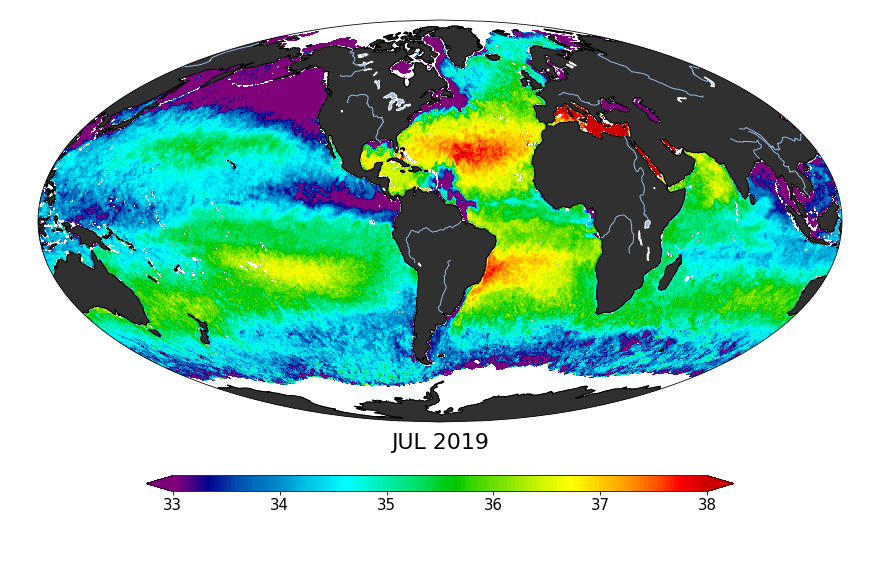
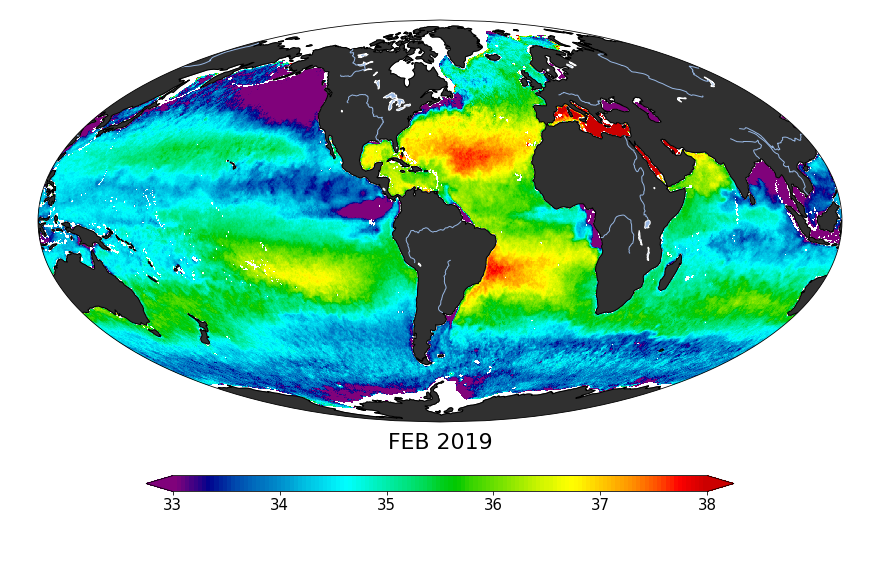
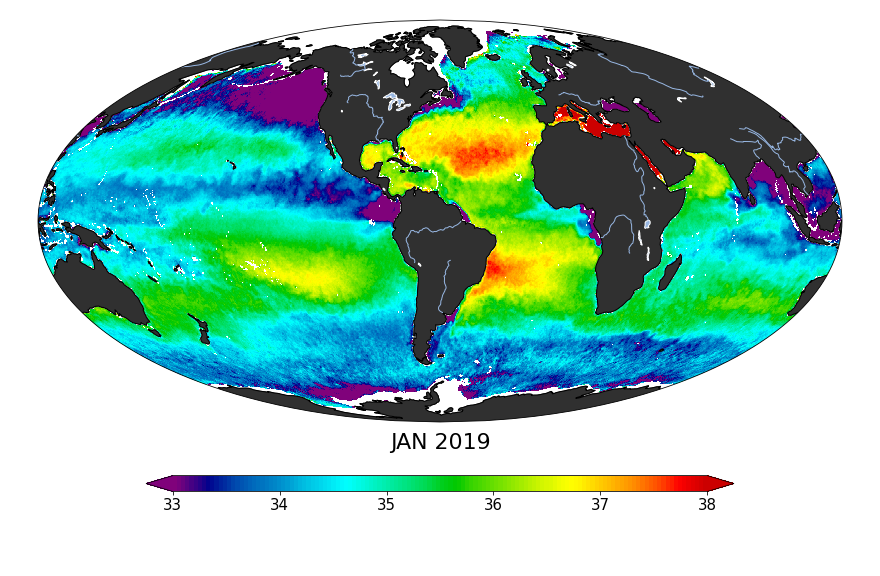
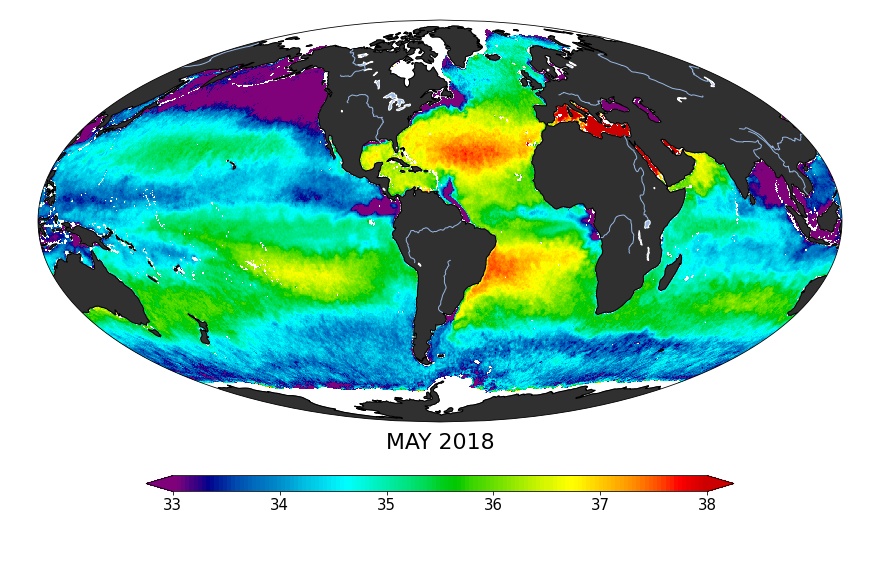
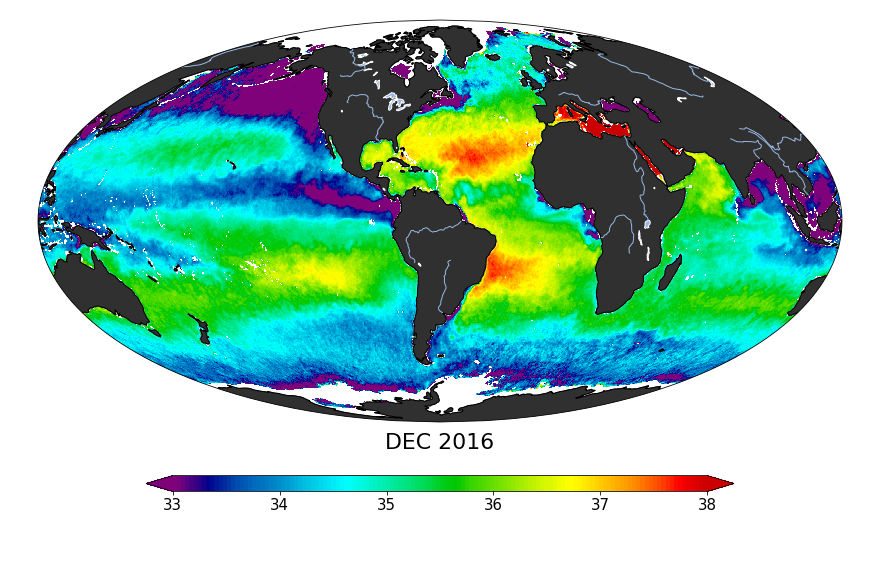
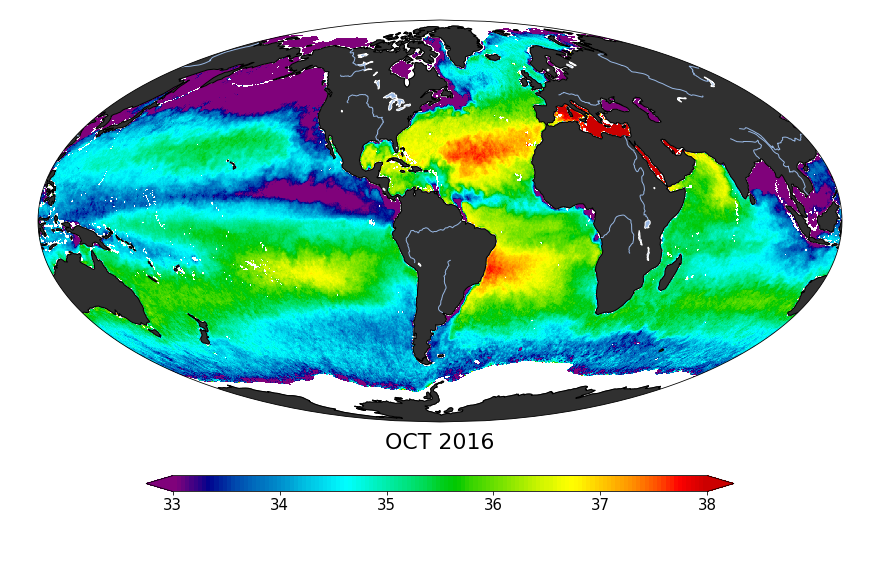
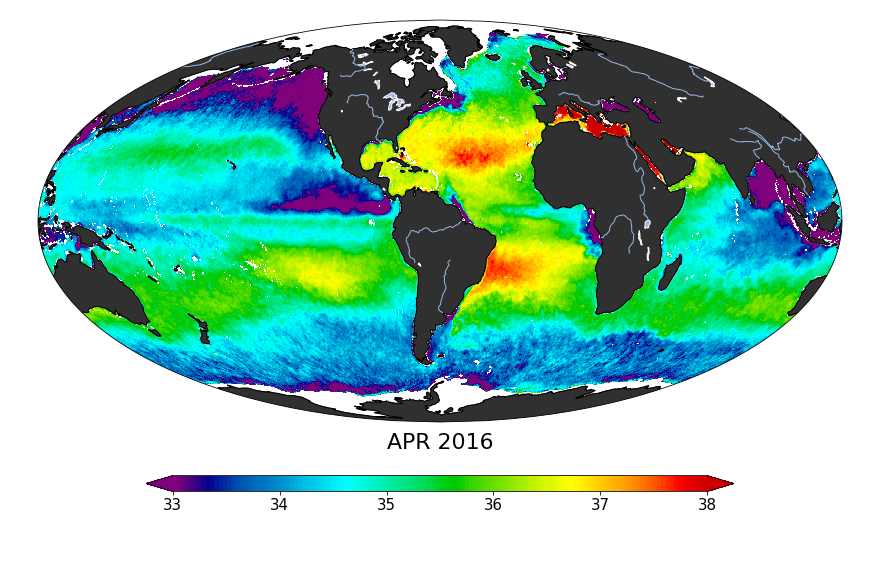
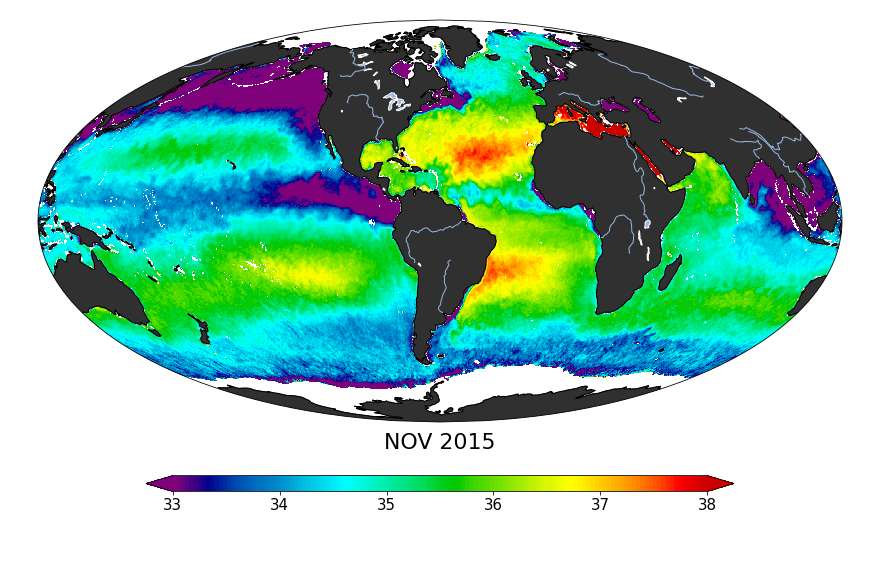
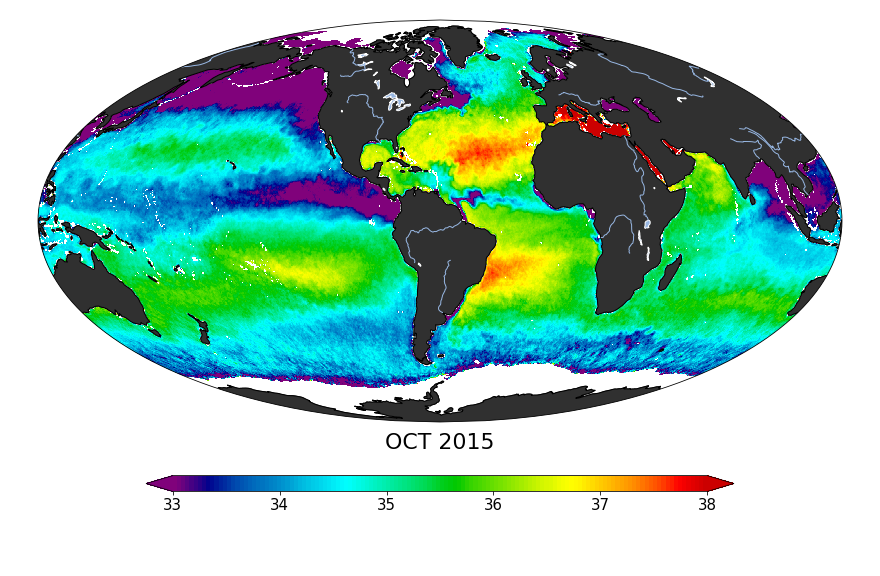
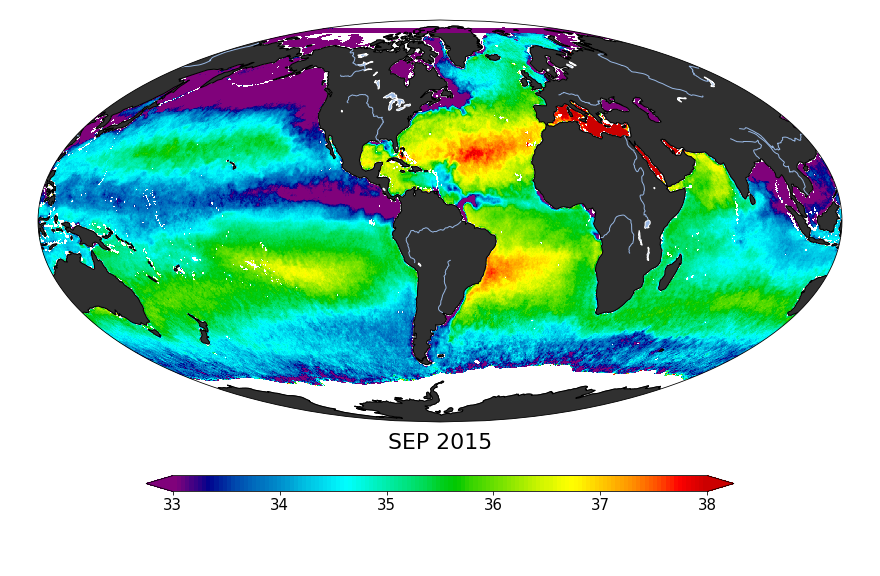
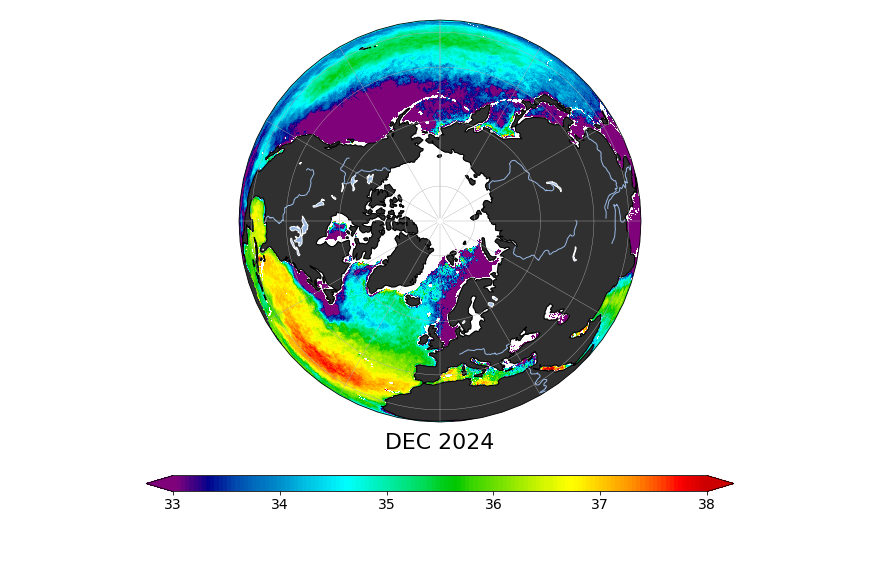
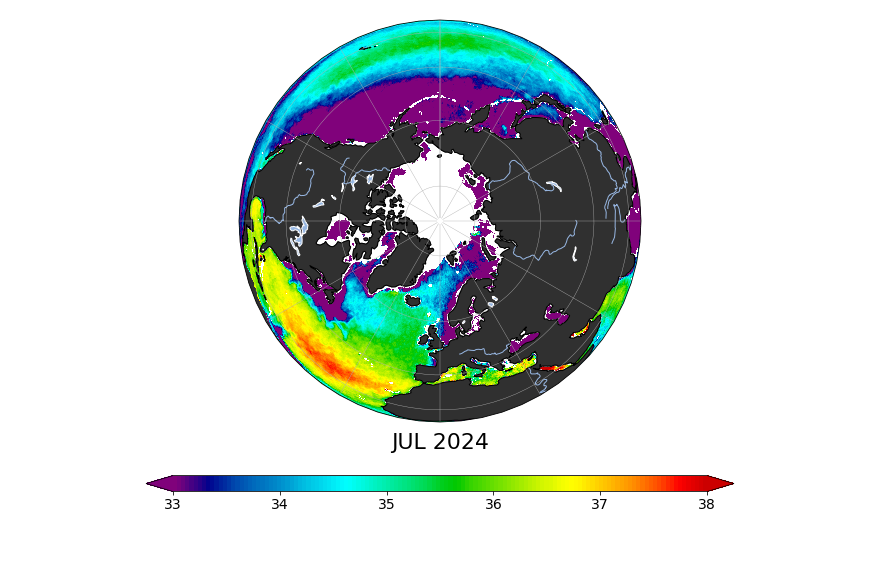
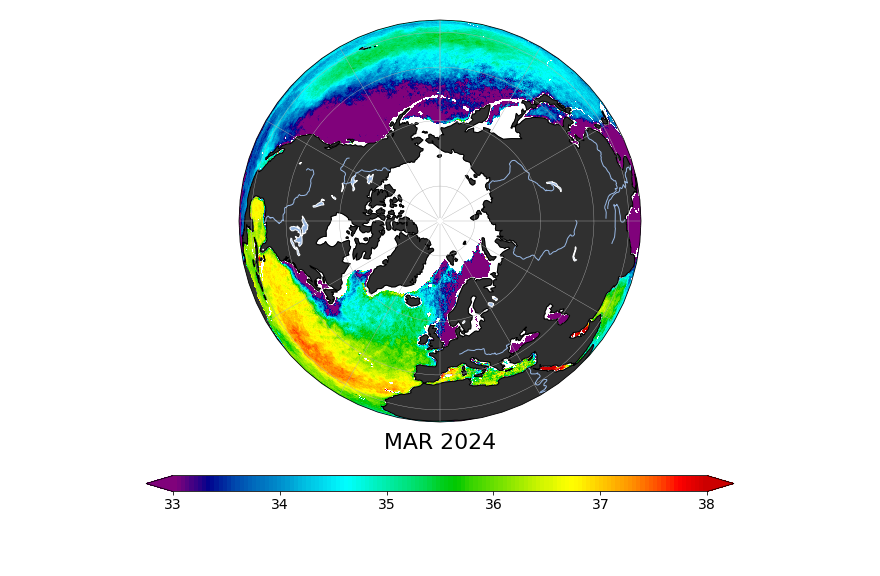
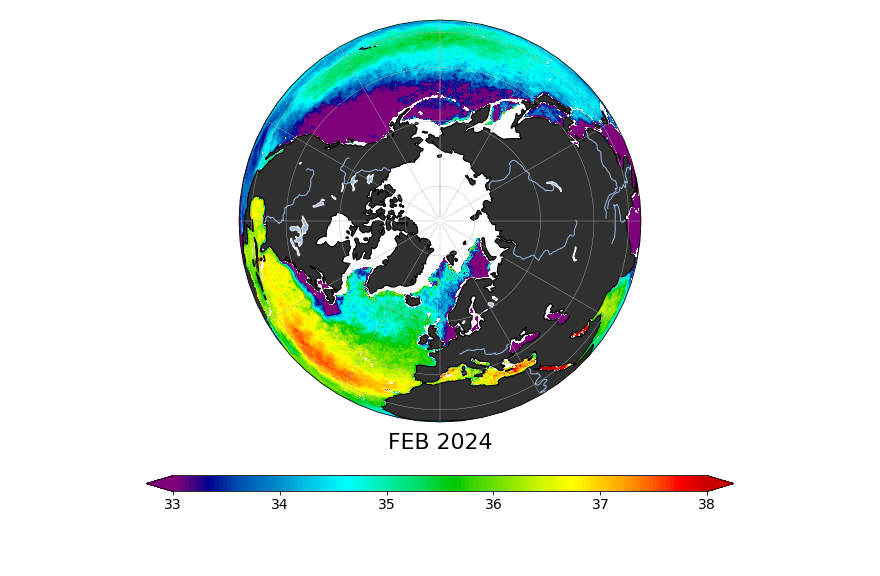
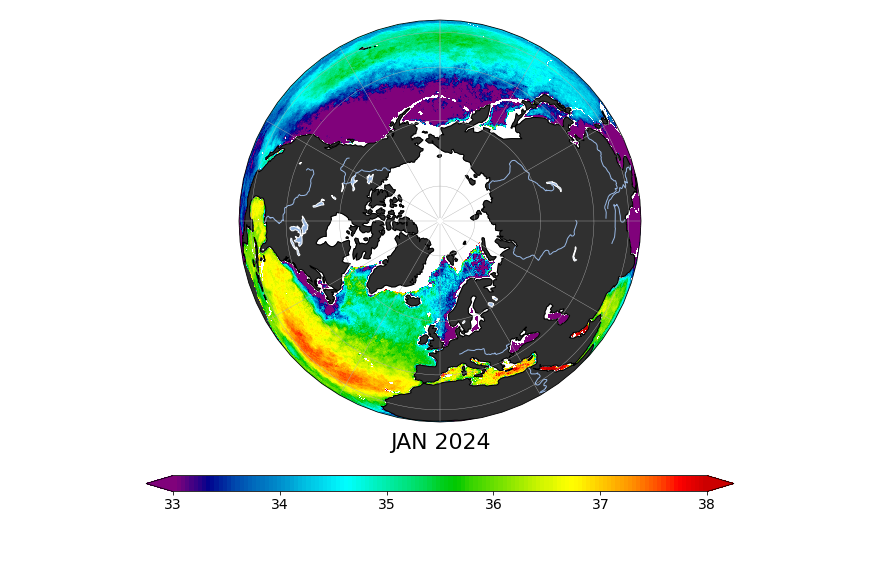
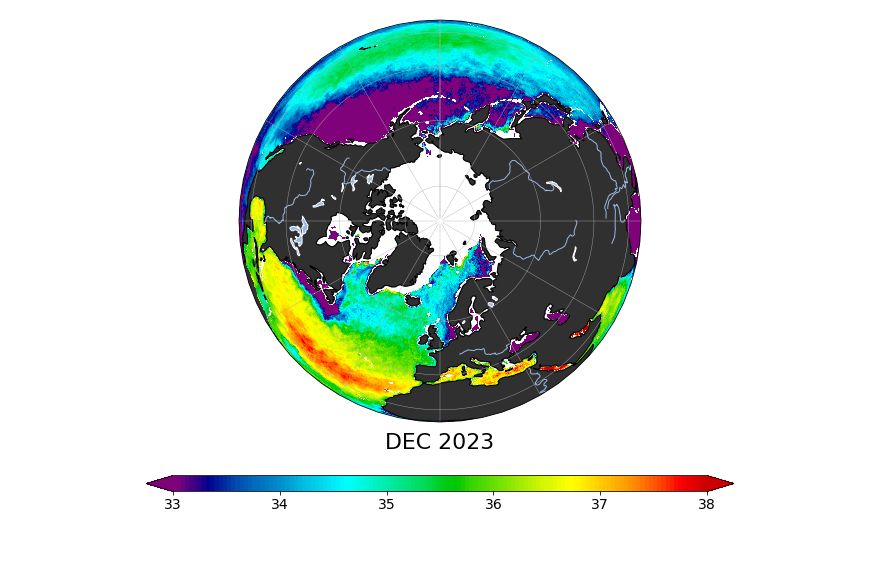
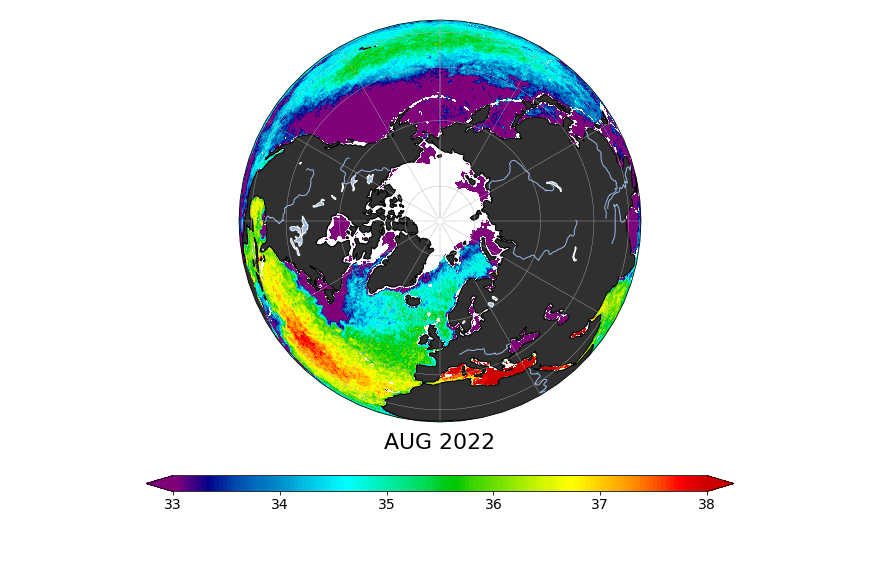
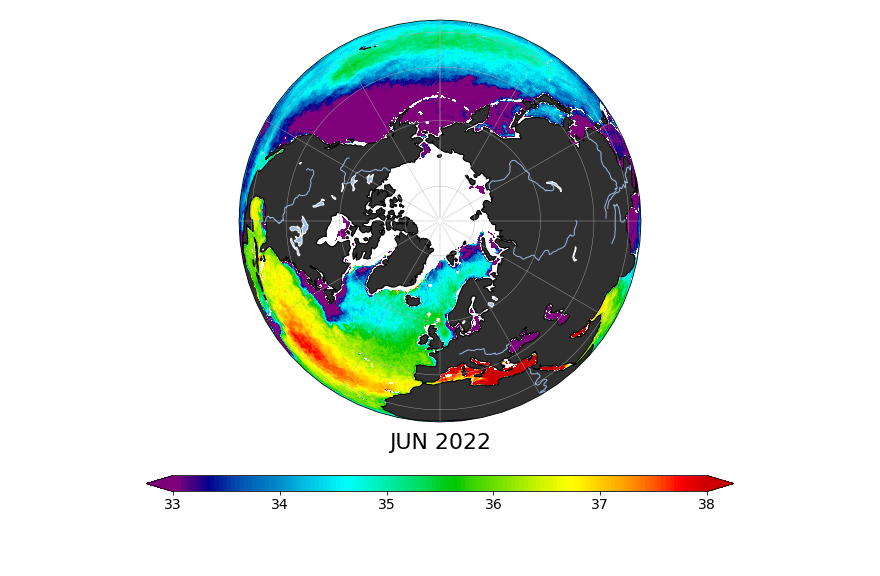
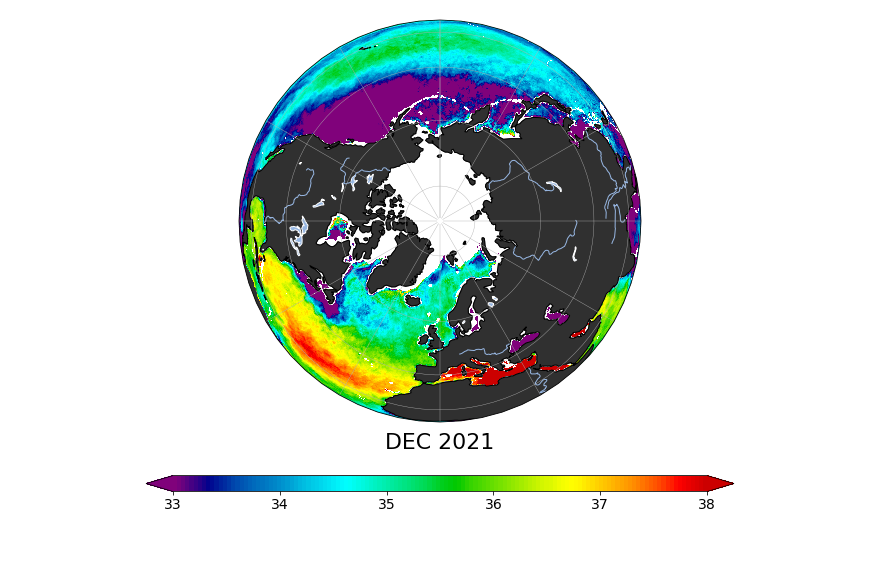
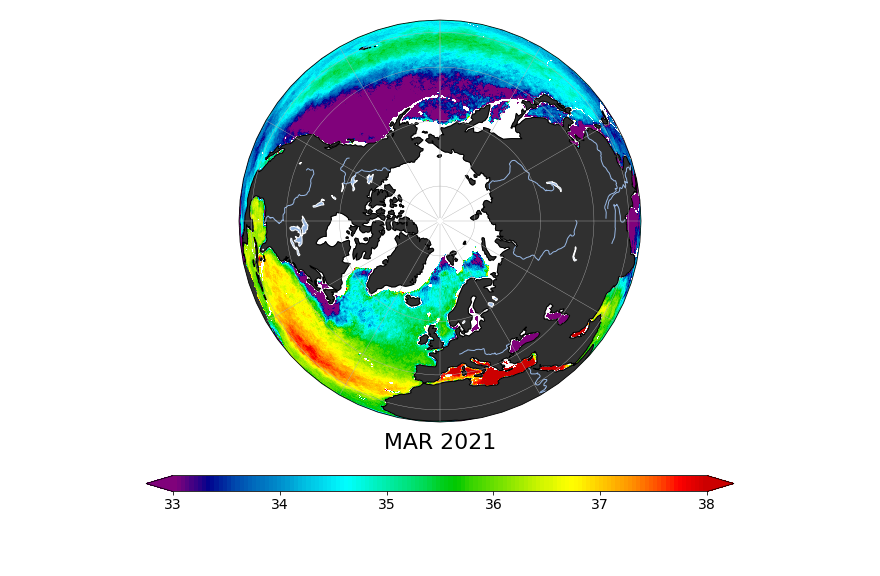
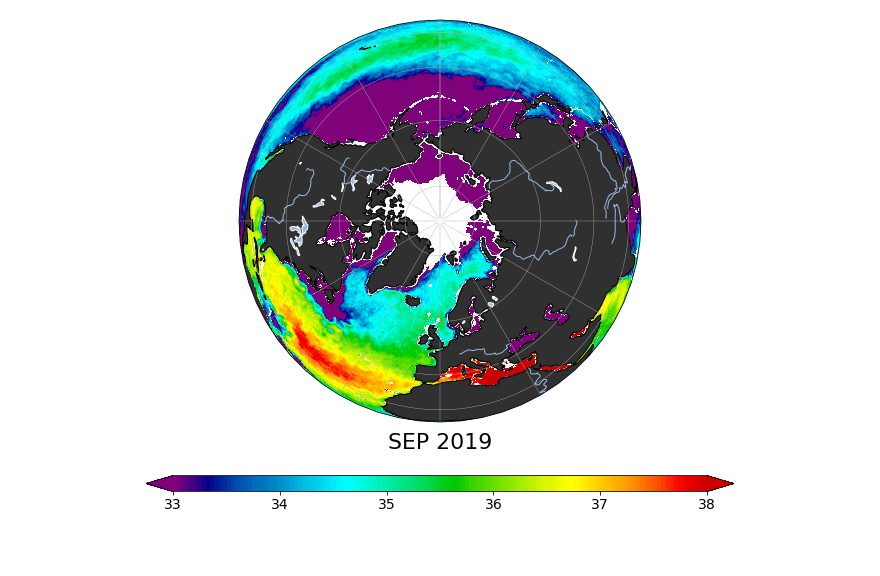
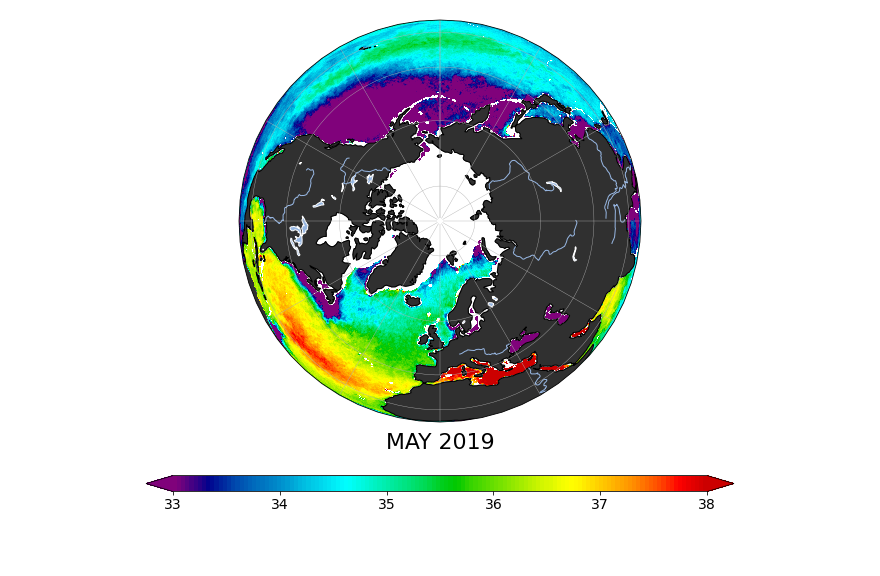
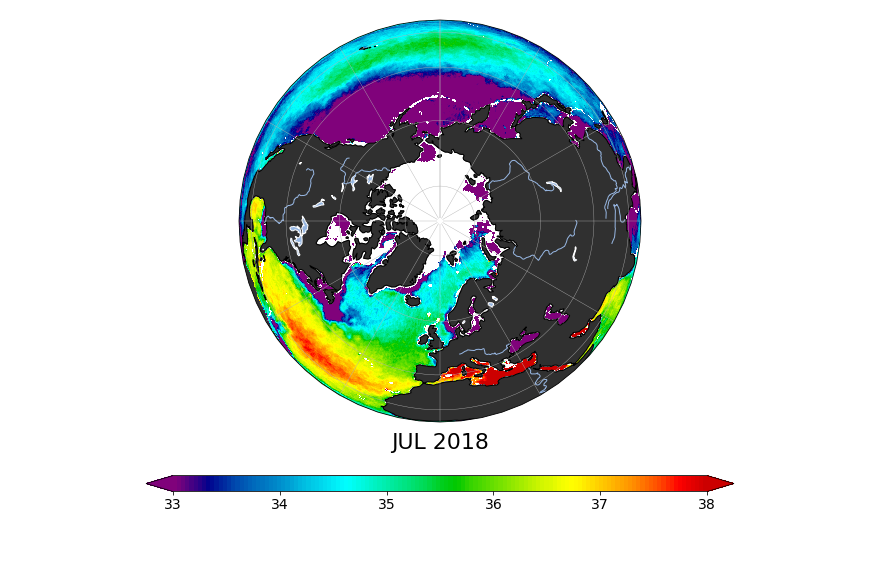
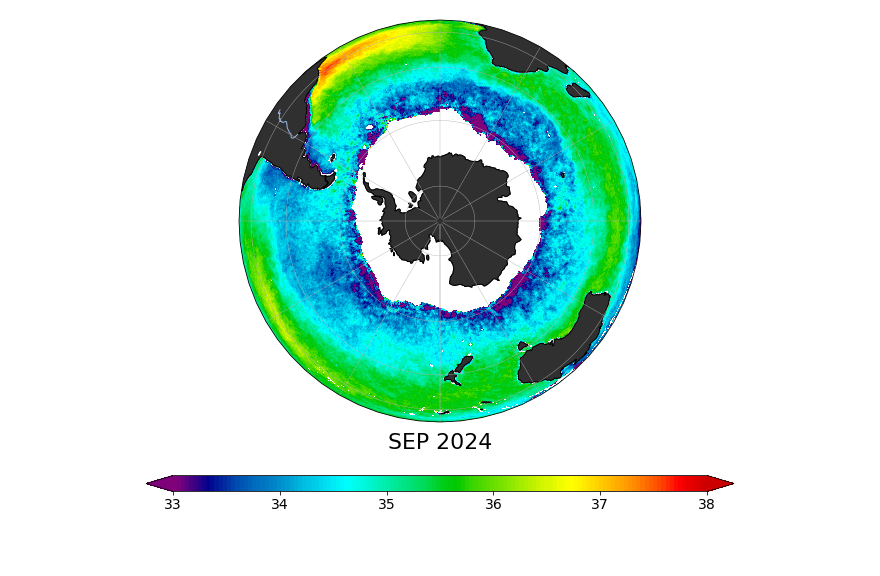
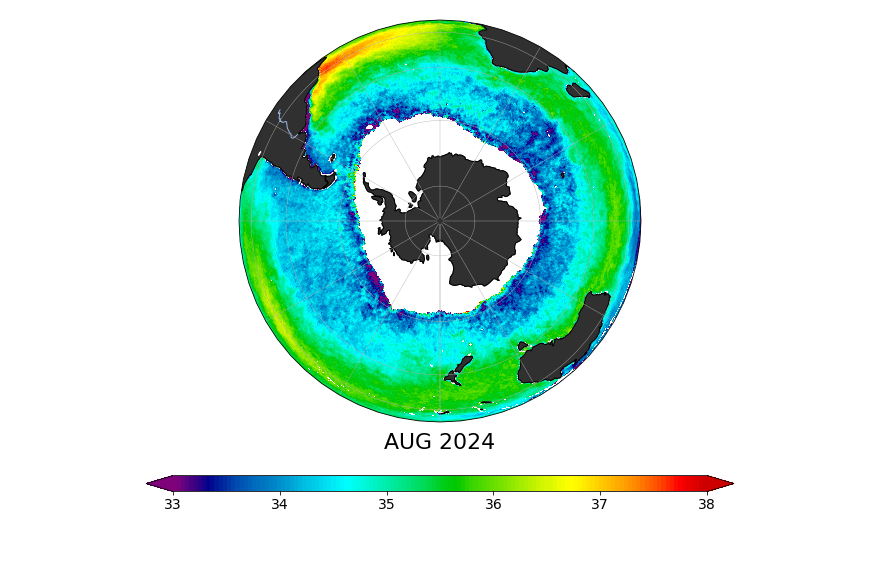
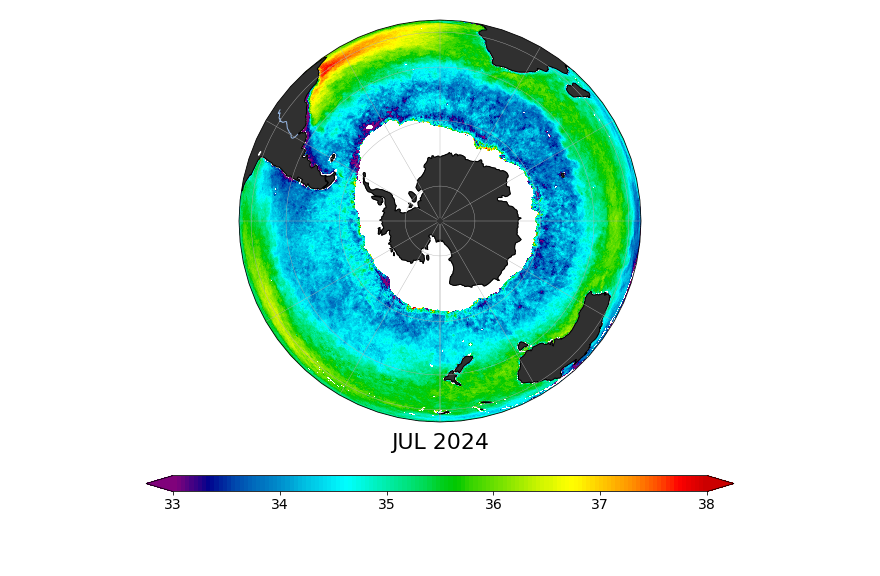
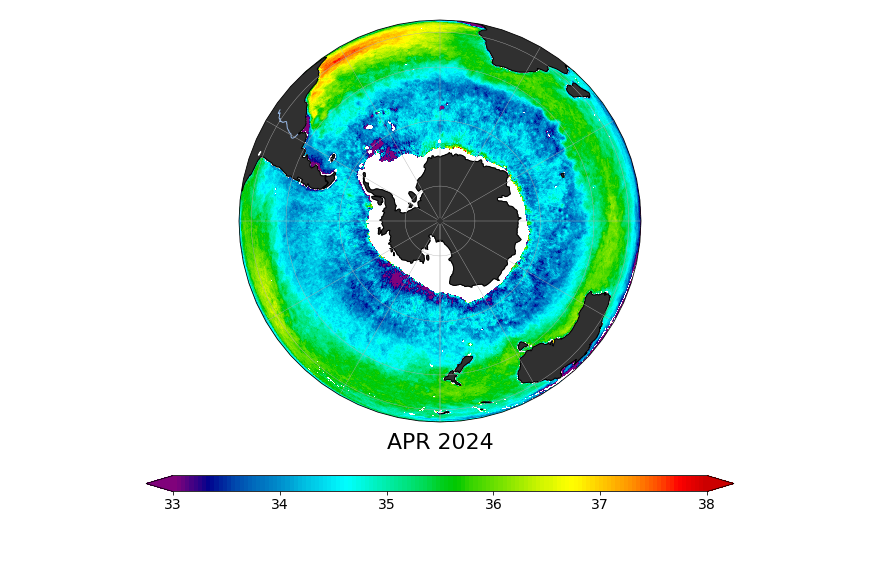
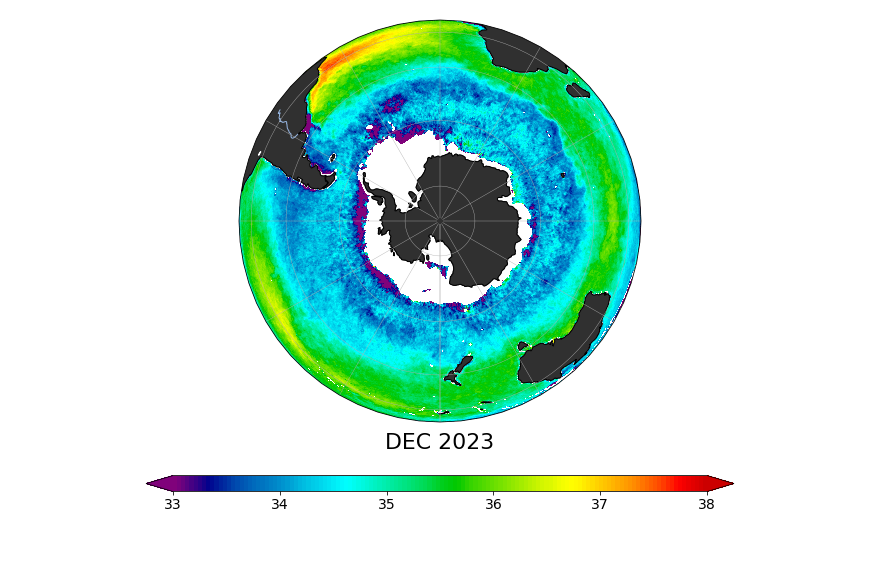
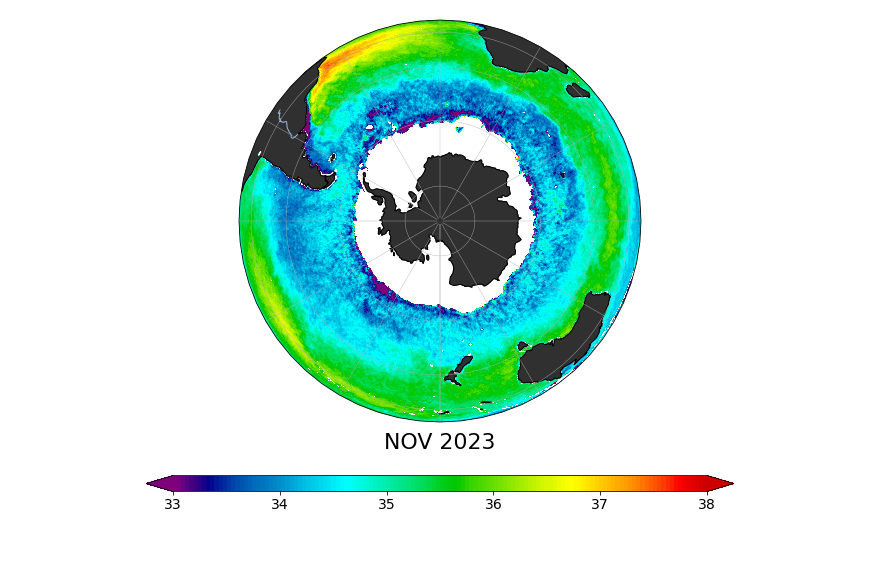
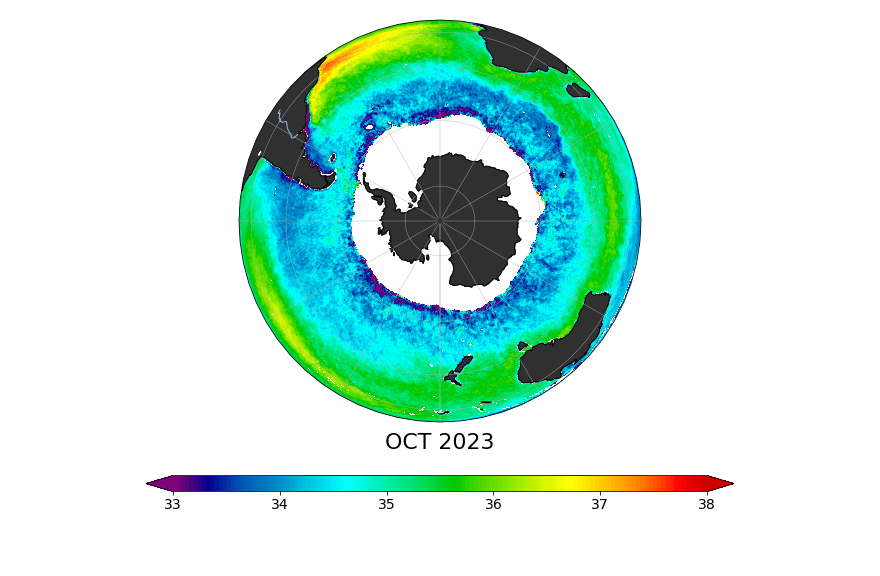
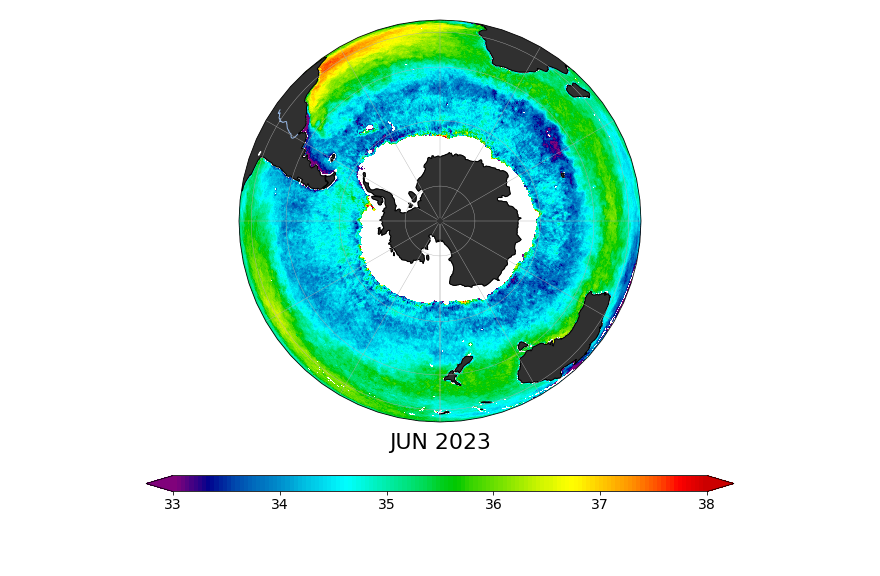
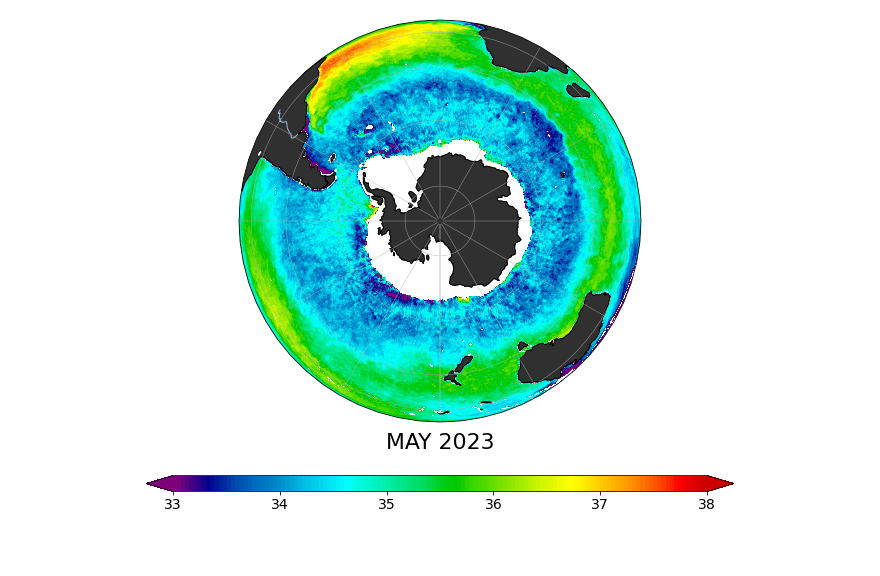
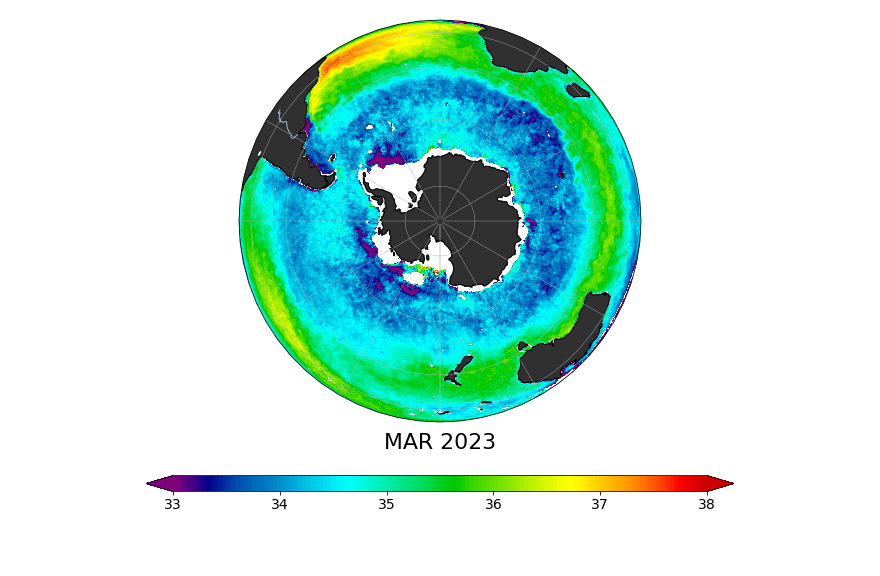
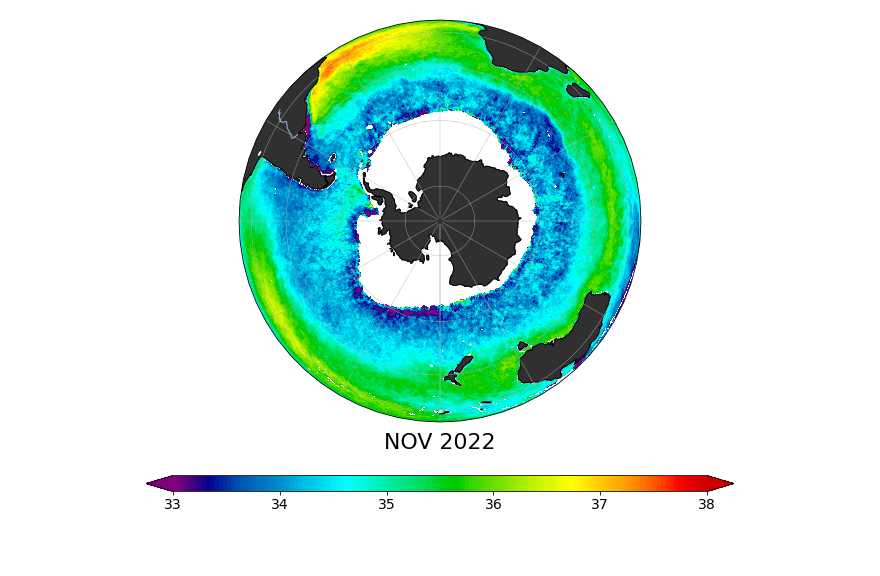
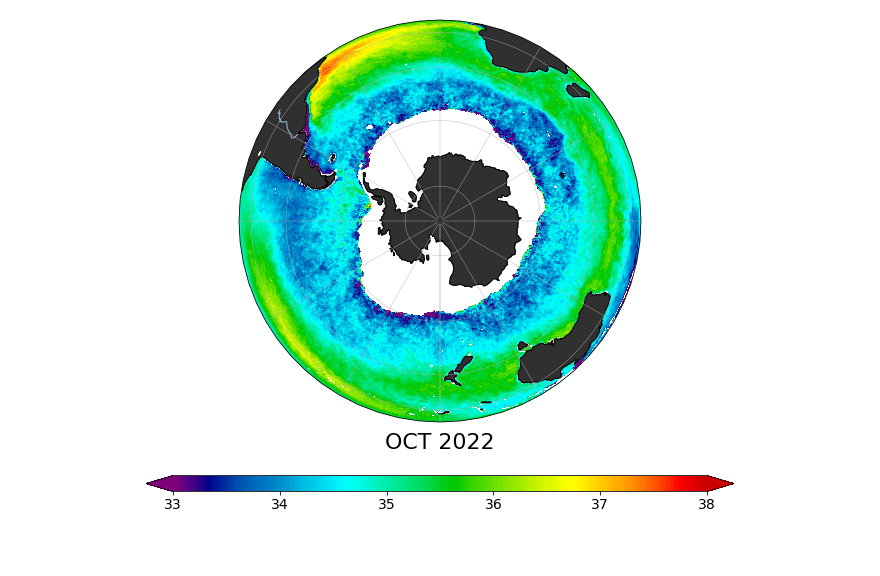
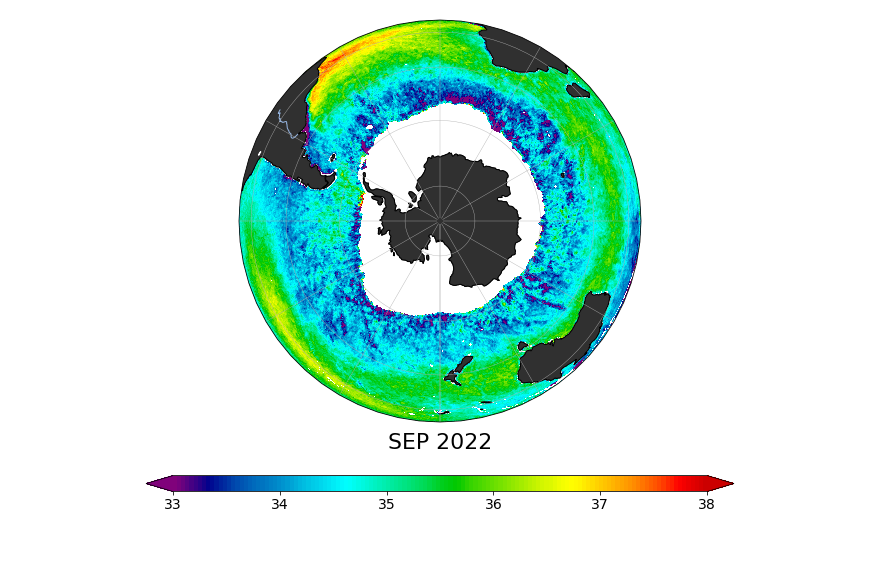
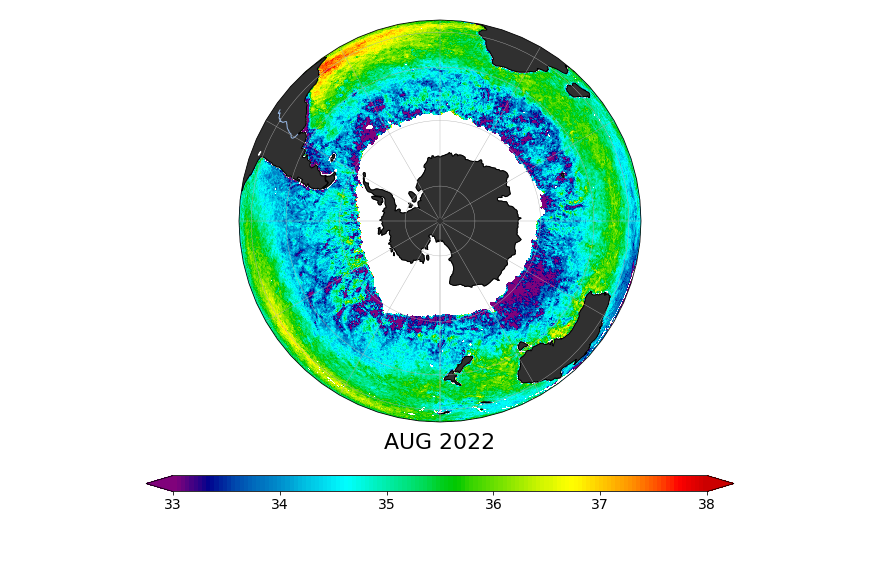
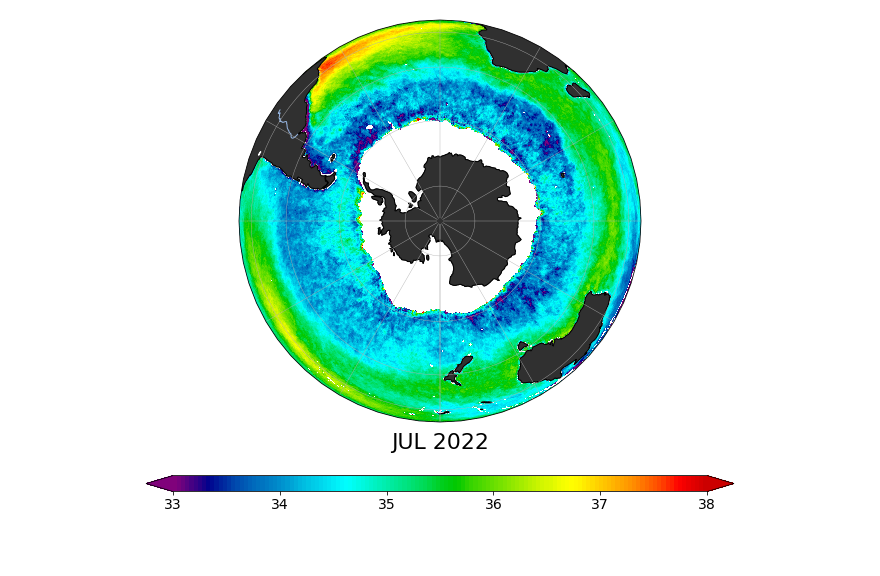
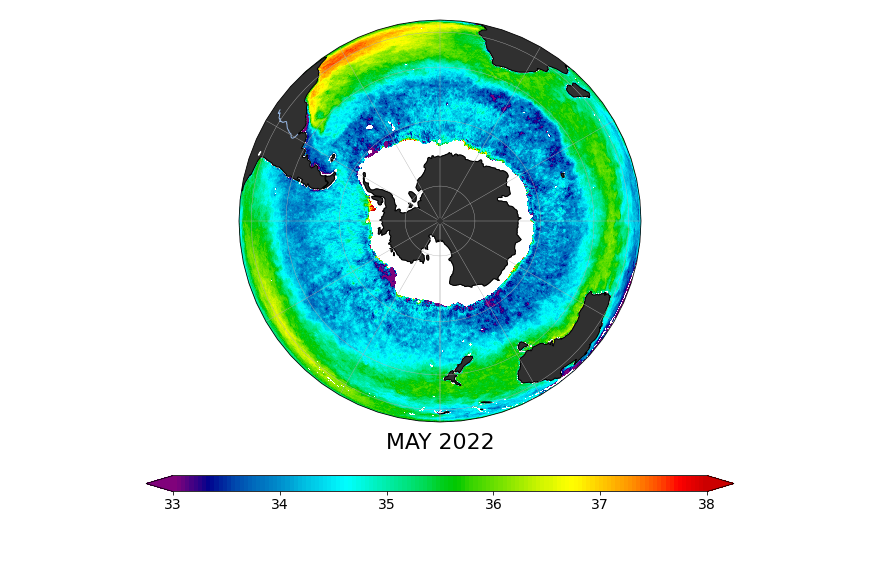
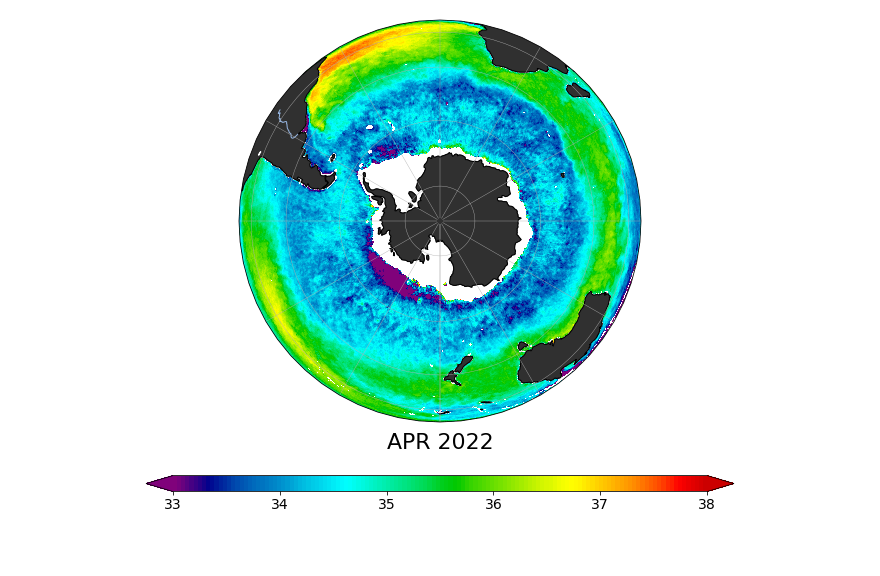
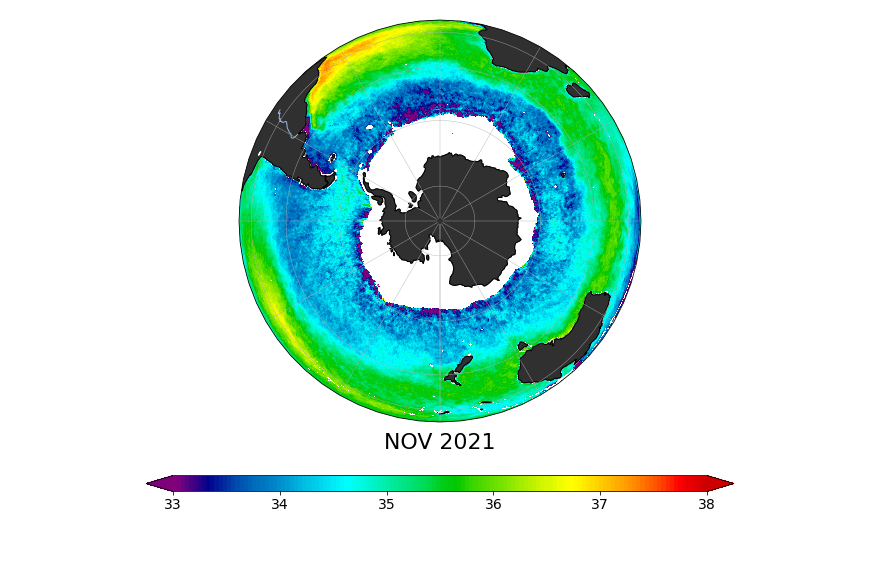
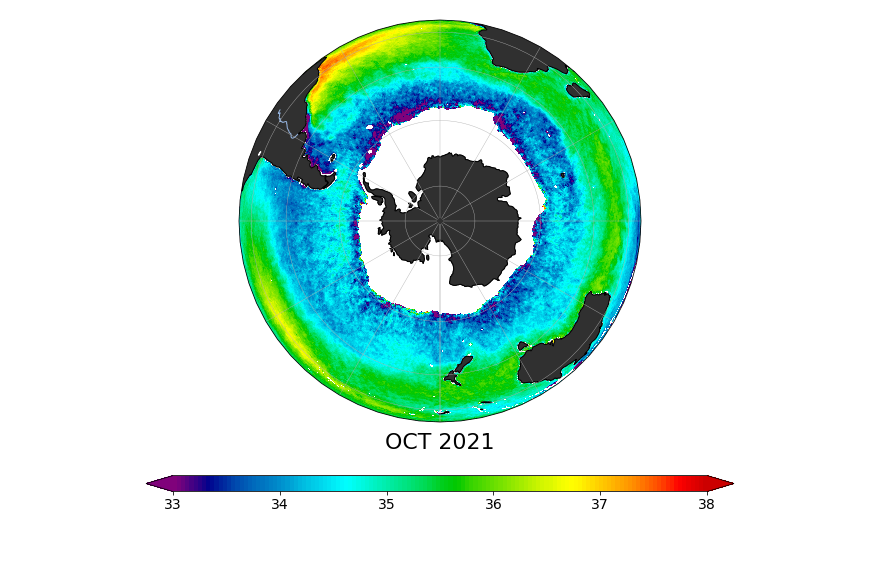
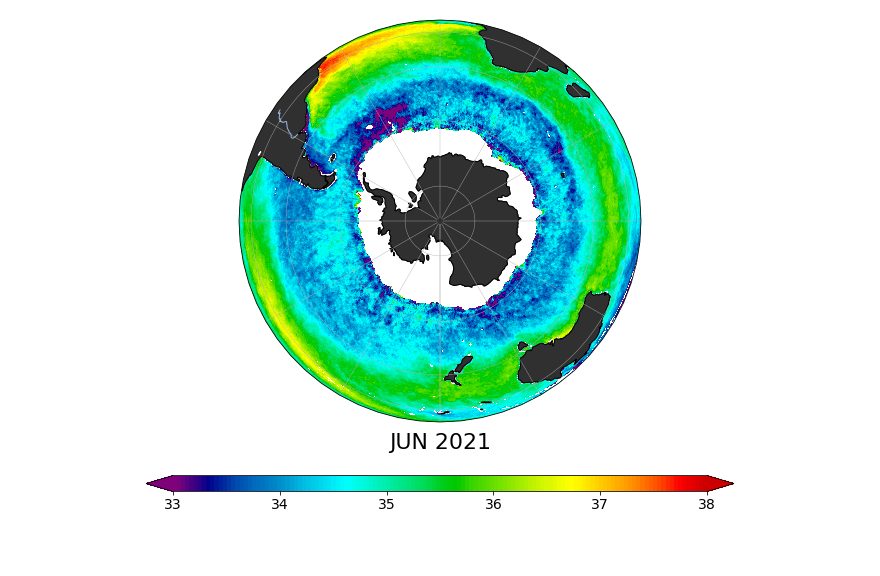
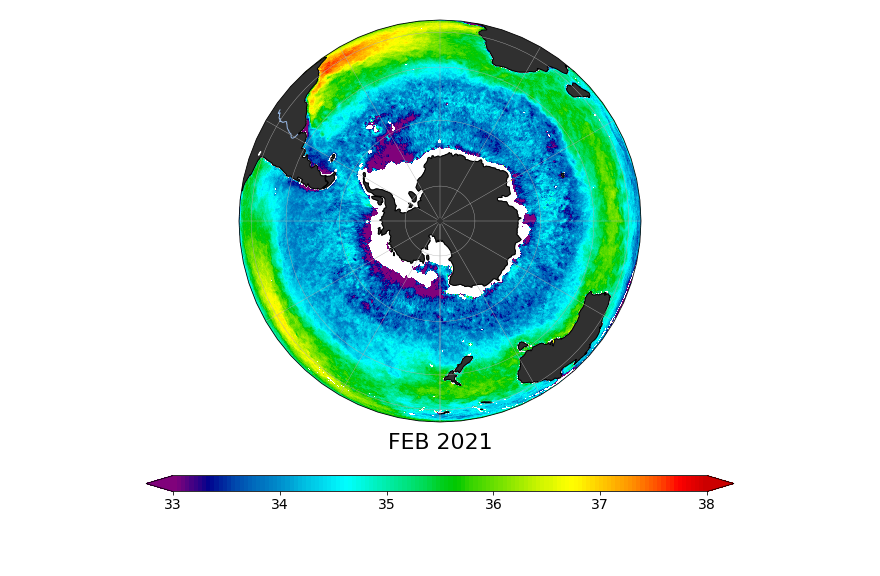
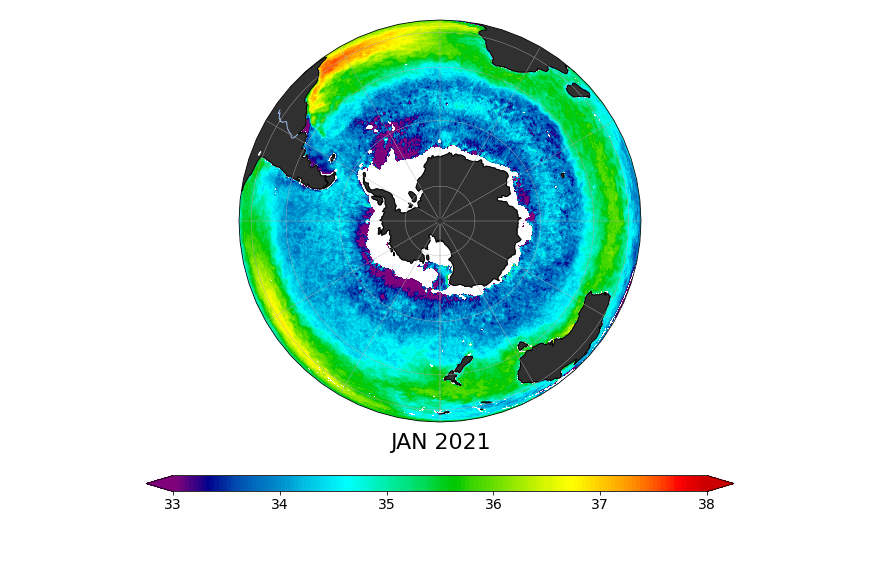
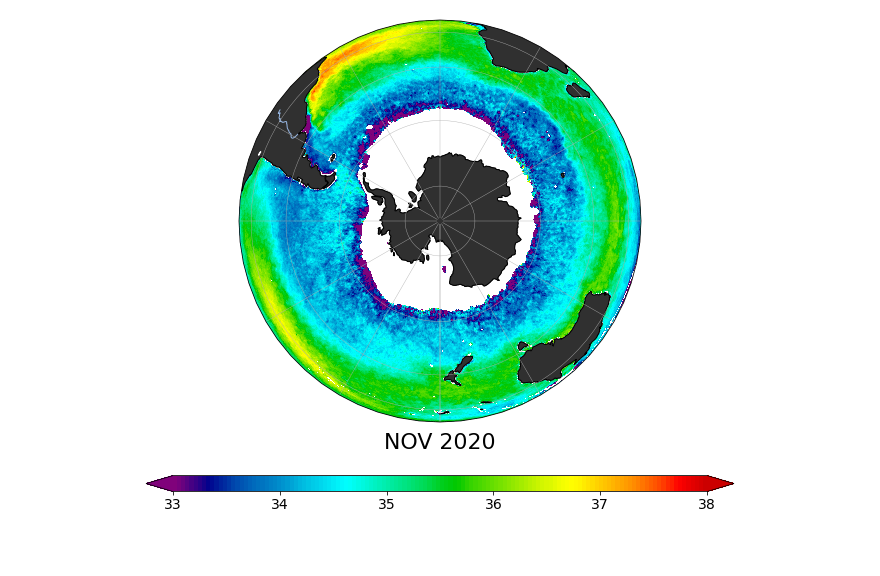
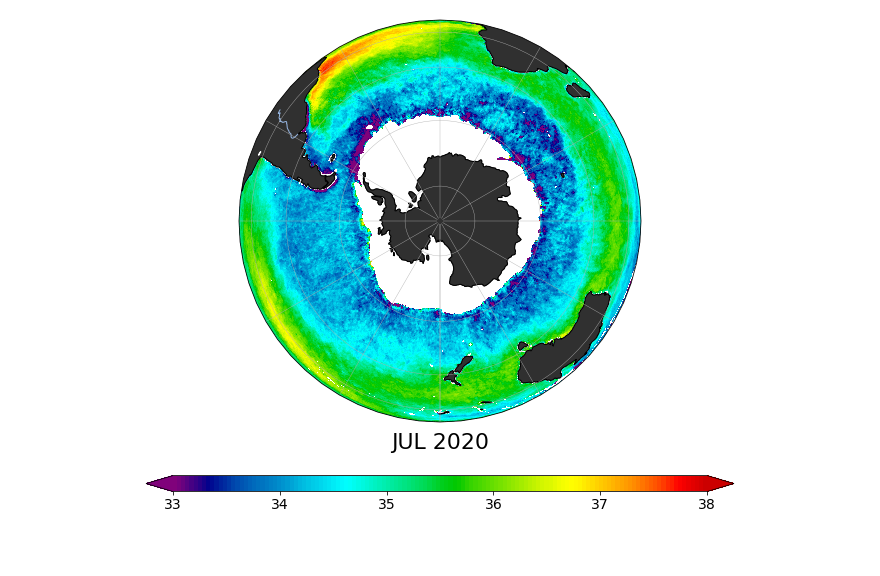
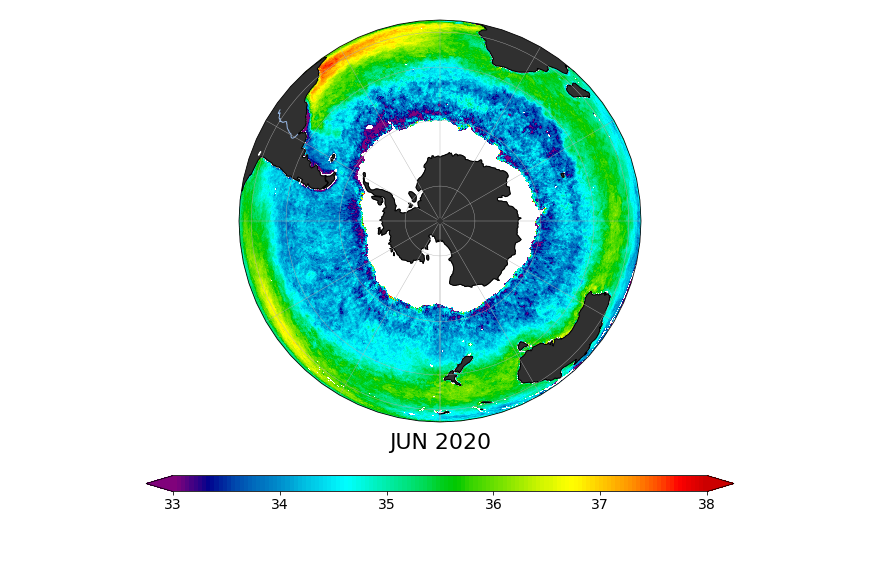
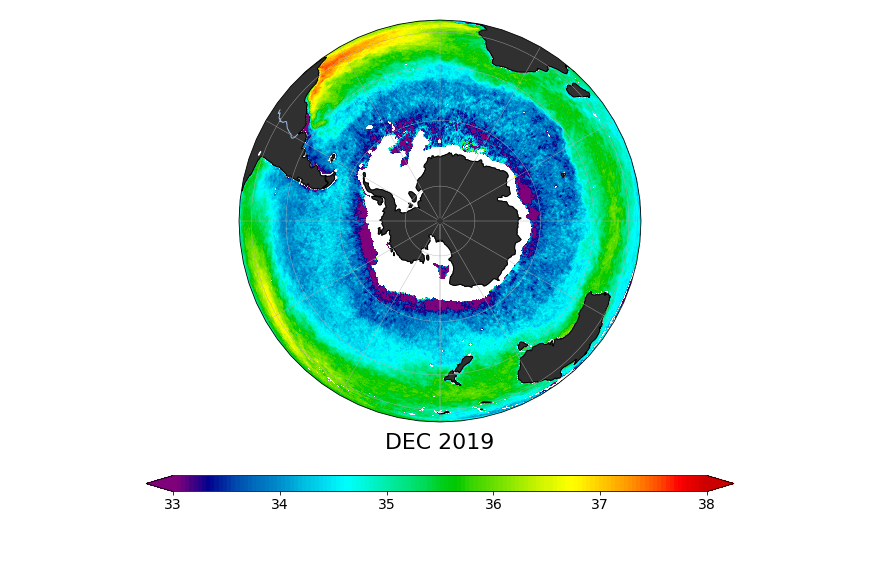
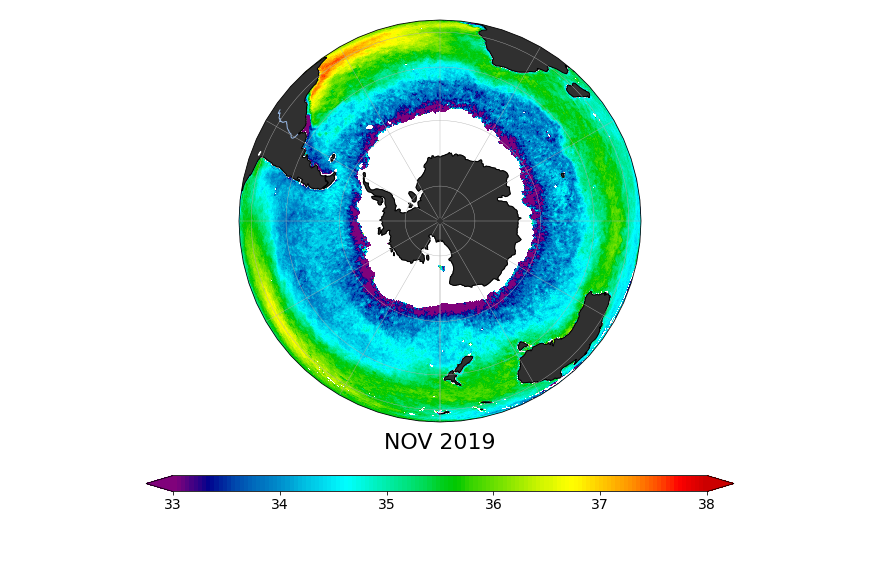
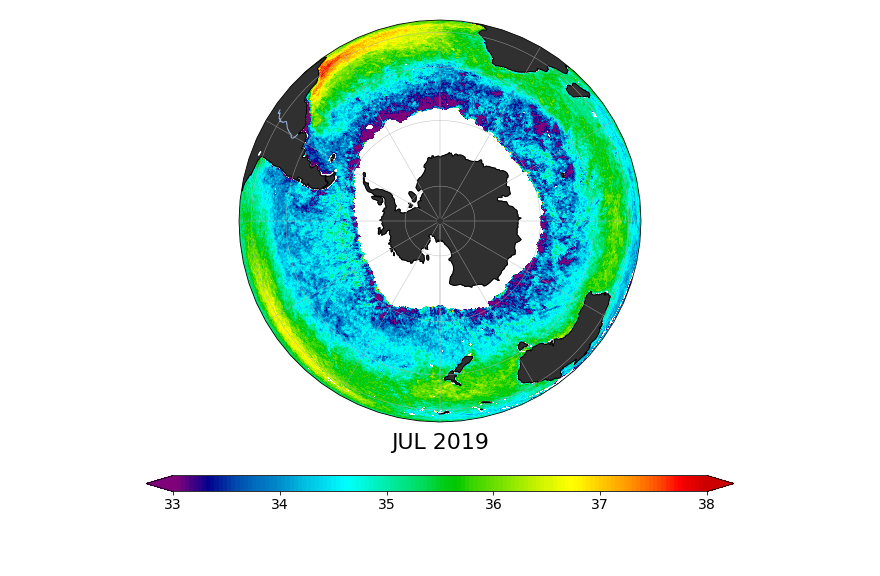
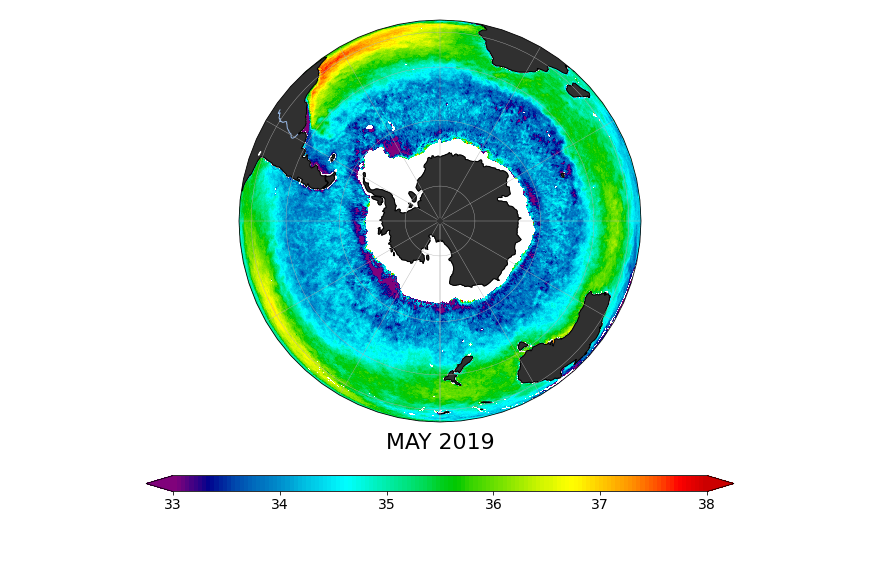
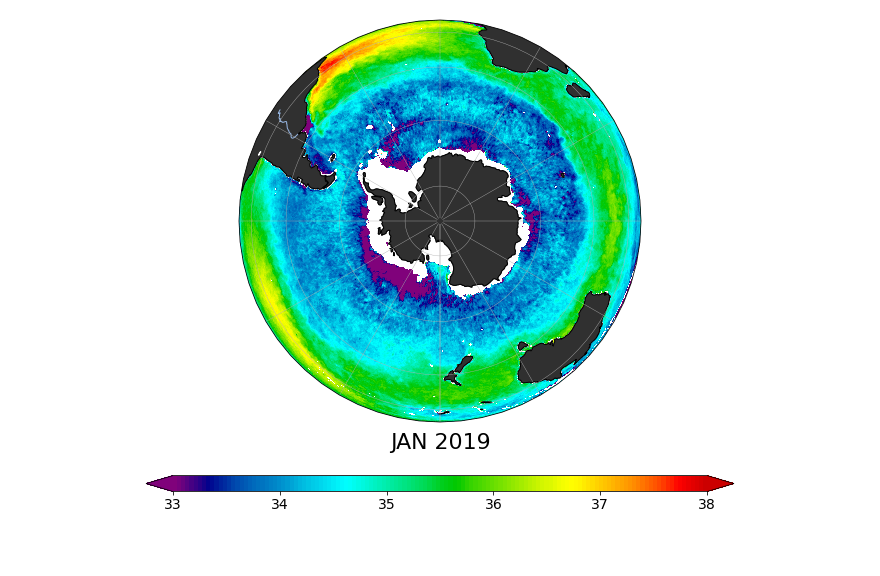
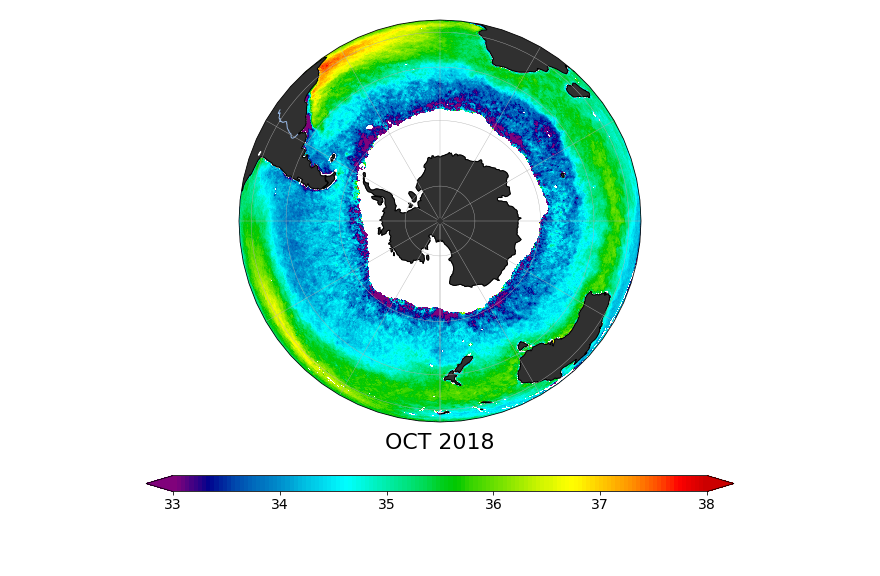
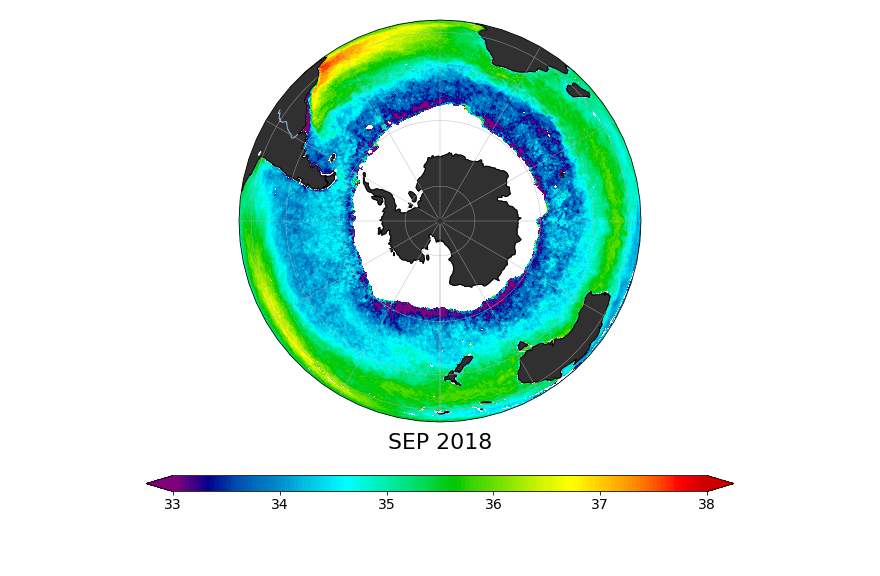
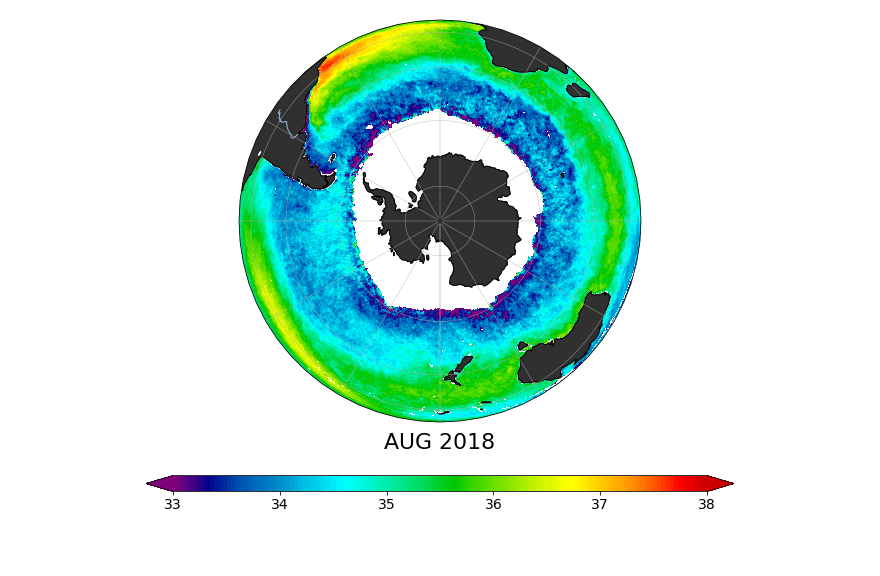
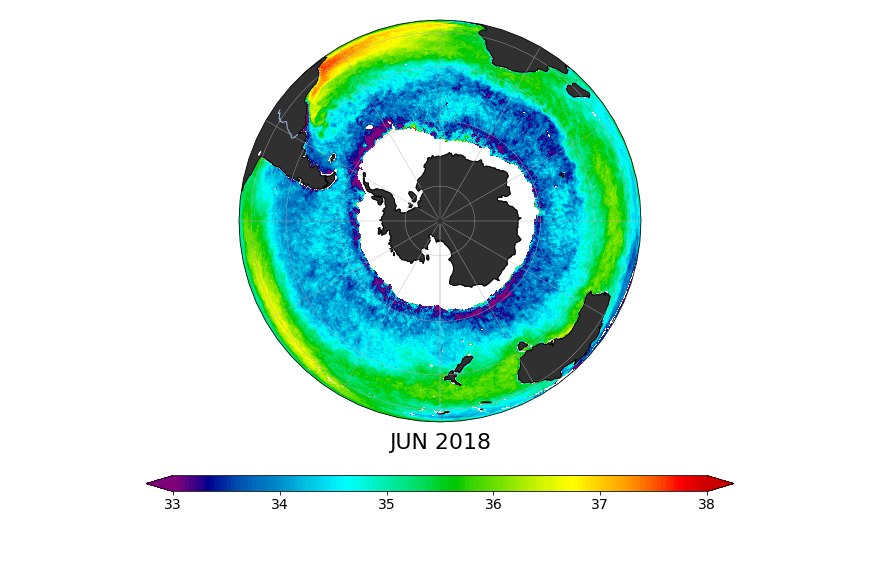
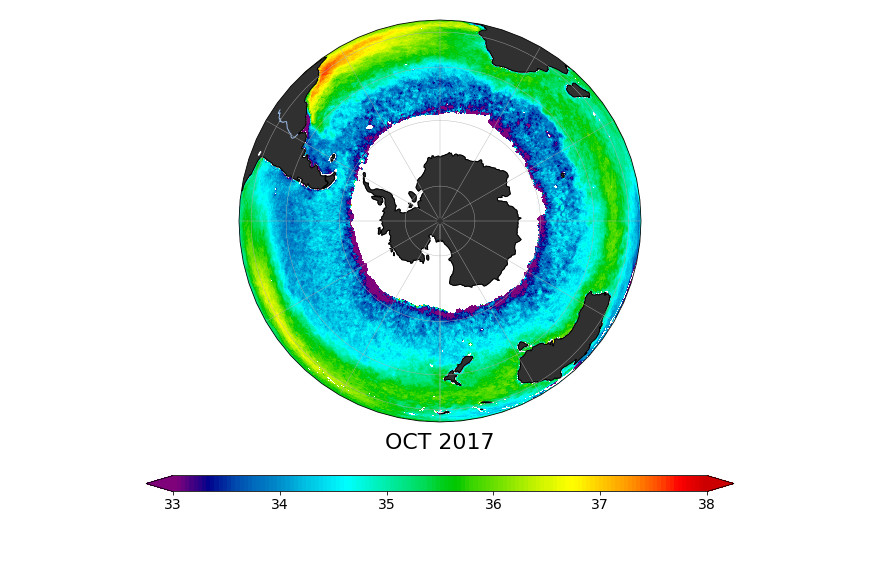
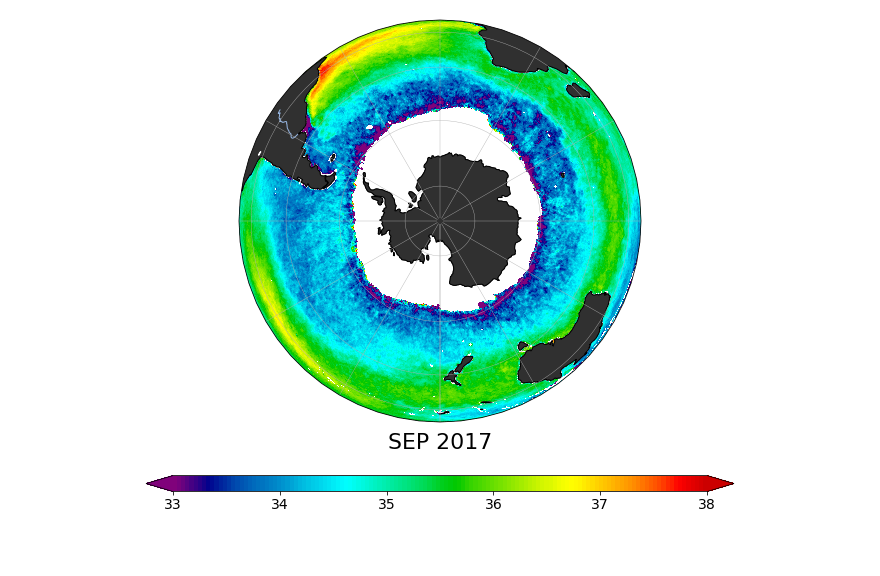
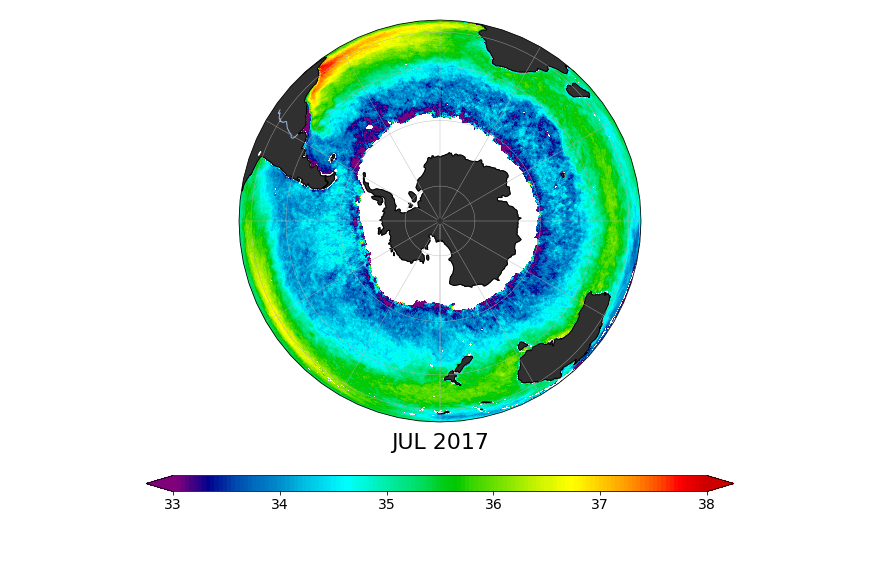
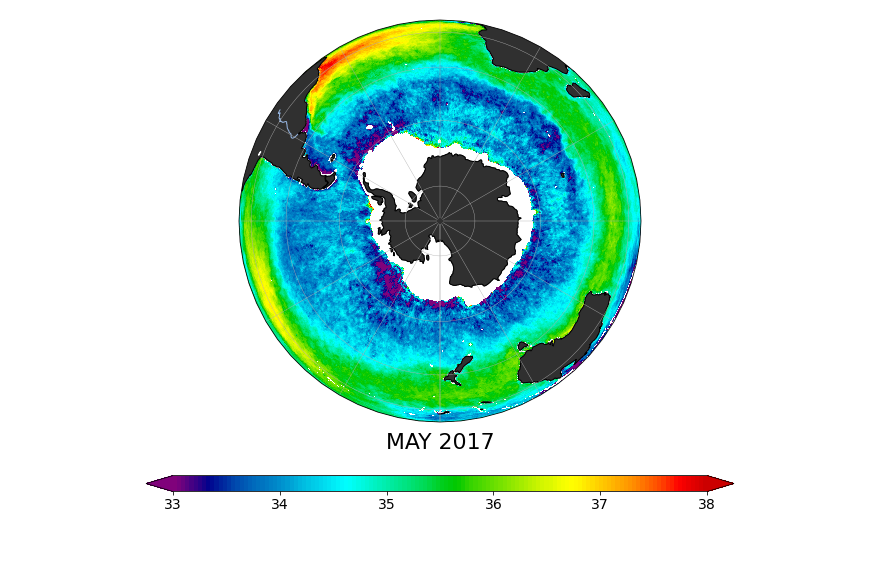
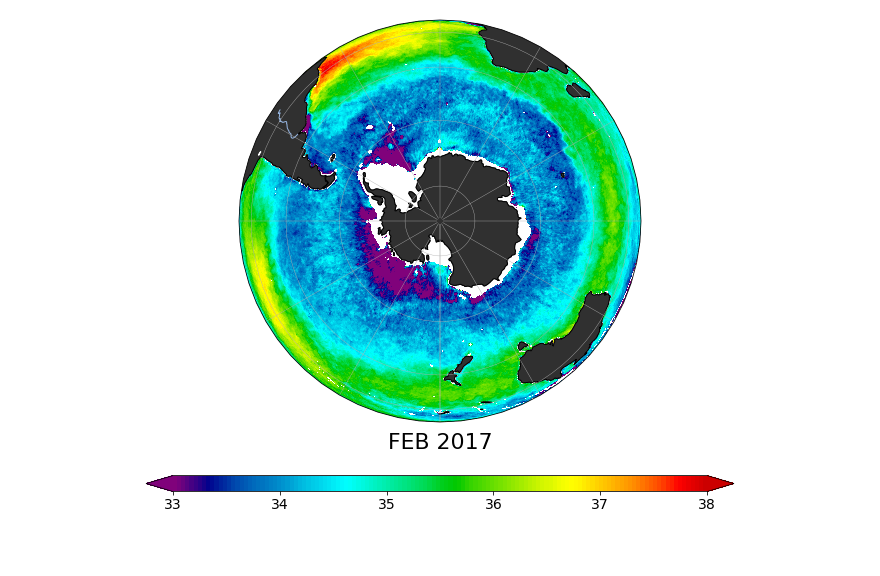
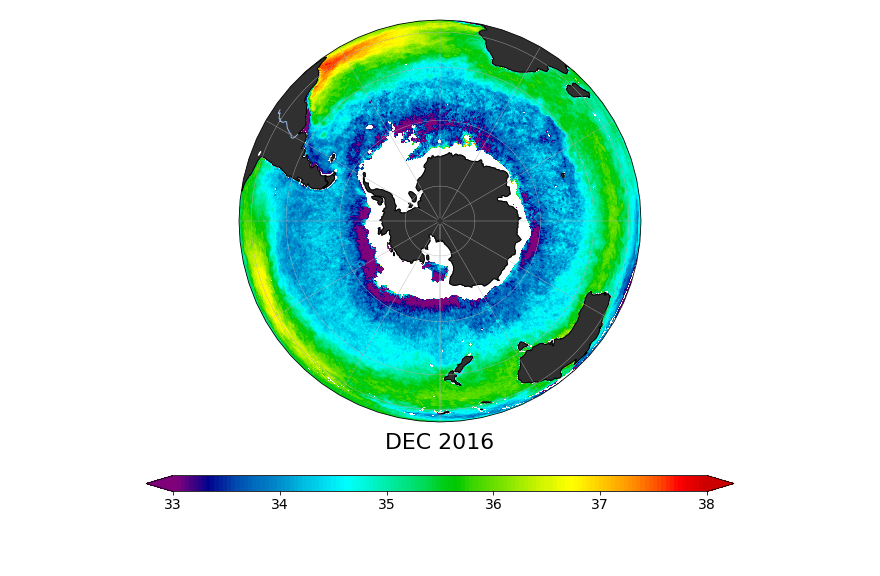
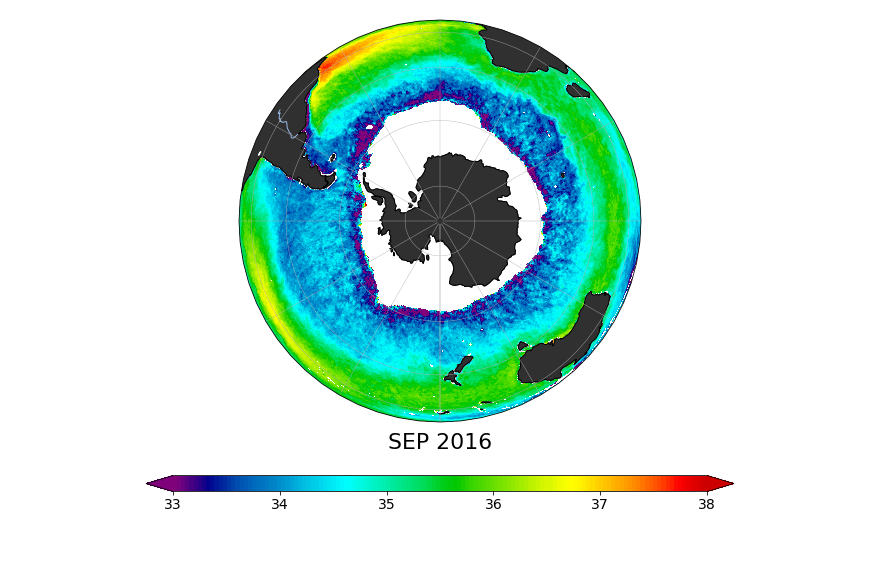
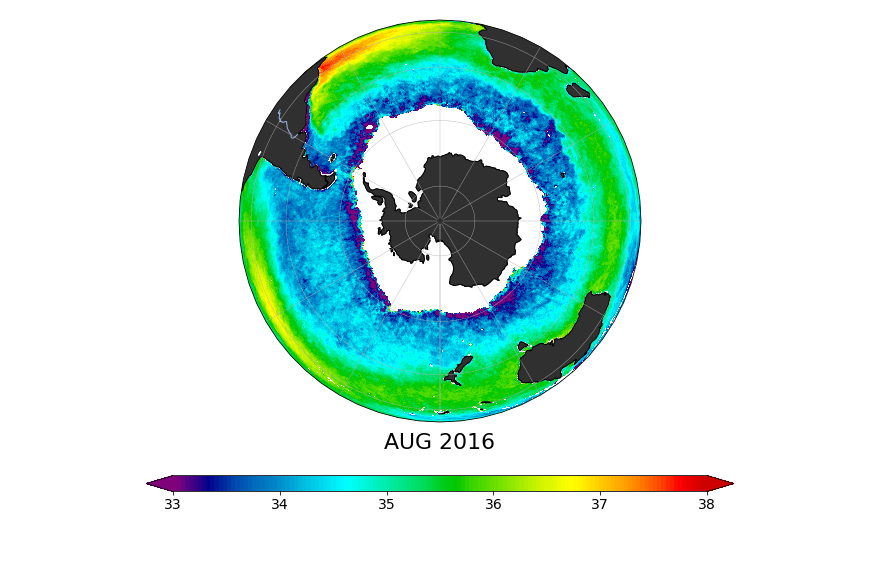
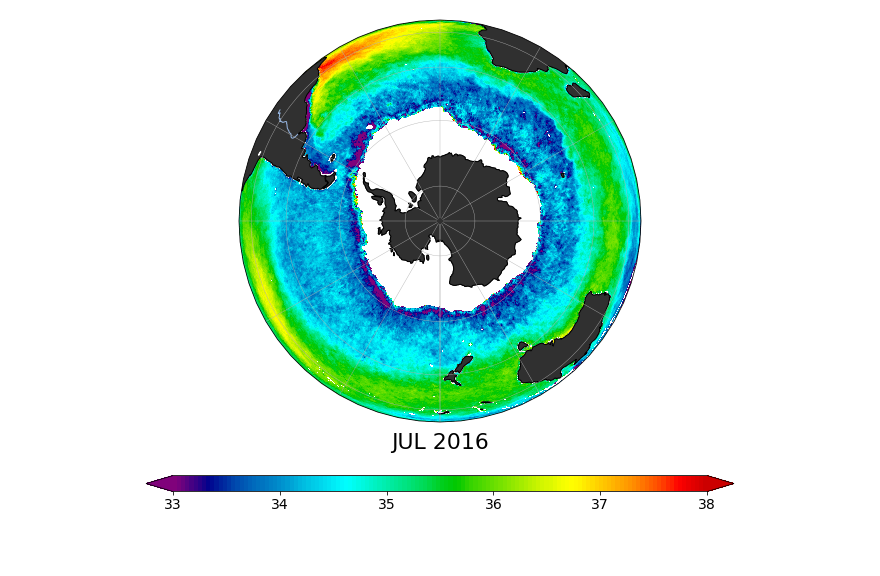
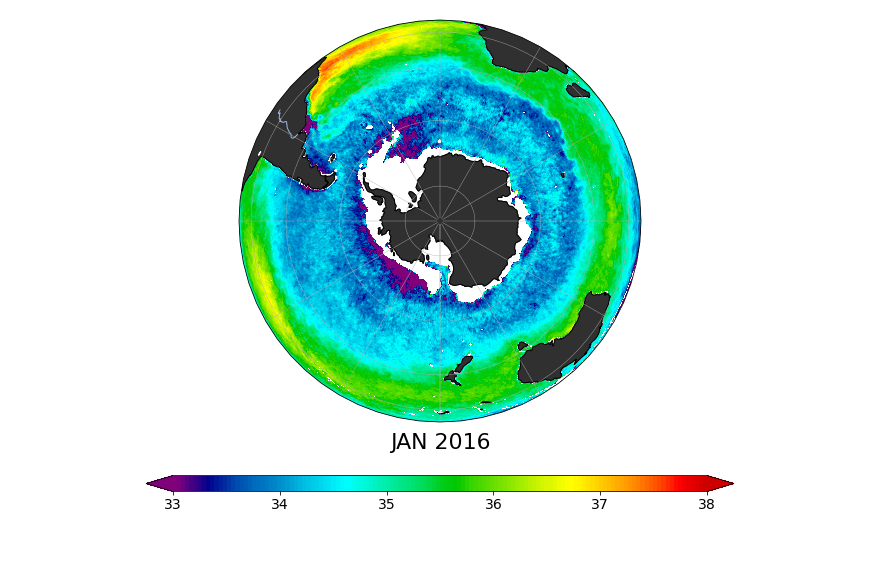
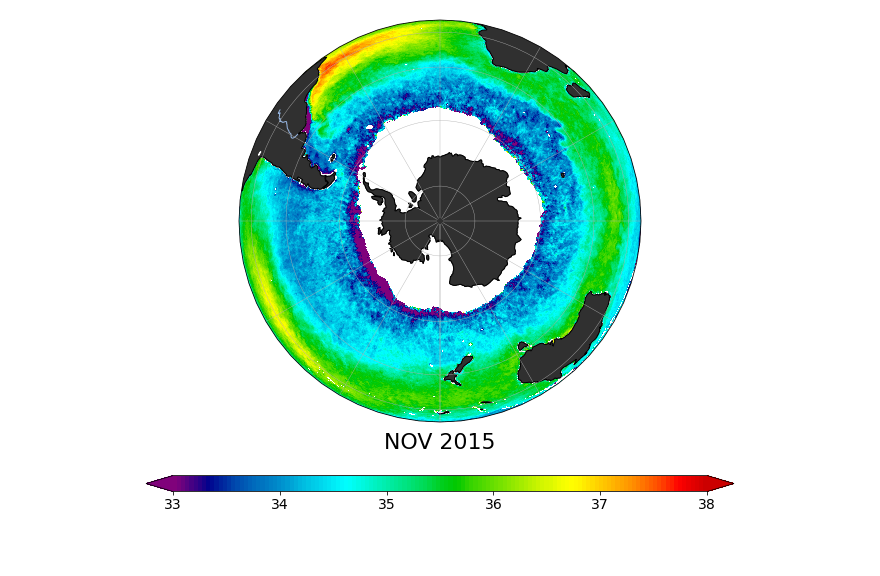
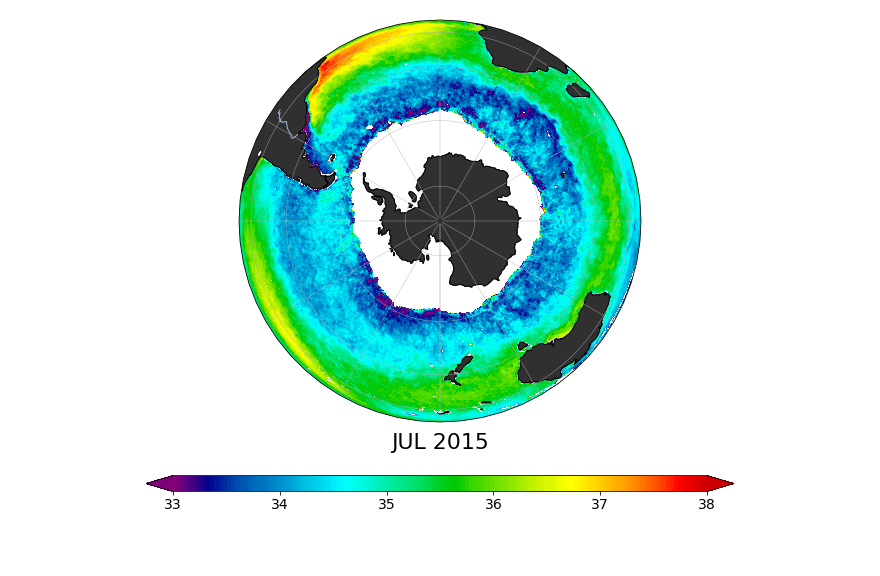
The maps show a range of salinities using the Practical Salinity Scale (PSS; Lewis, 1980), roughly equivalent to parts per thousand. PSS and PSU (Practical Salinity Units) are different names for the same thing. In the maps, reds show higher salinity (38 psu) and purples show relatively low salinity (33 psu).
SMAP monthly sea surface salinity maps (Version 6) are available below in Mollweide (global), Northern Hemisphere and Southern Hemisphere projections. Click on any of the images below to see larger versions. Monthly data, along with 8-day running mean sea surface salinities, are available from PO.DAAC. About RSS SMAP V6