Science: SASSIE Tools
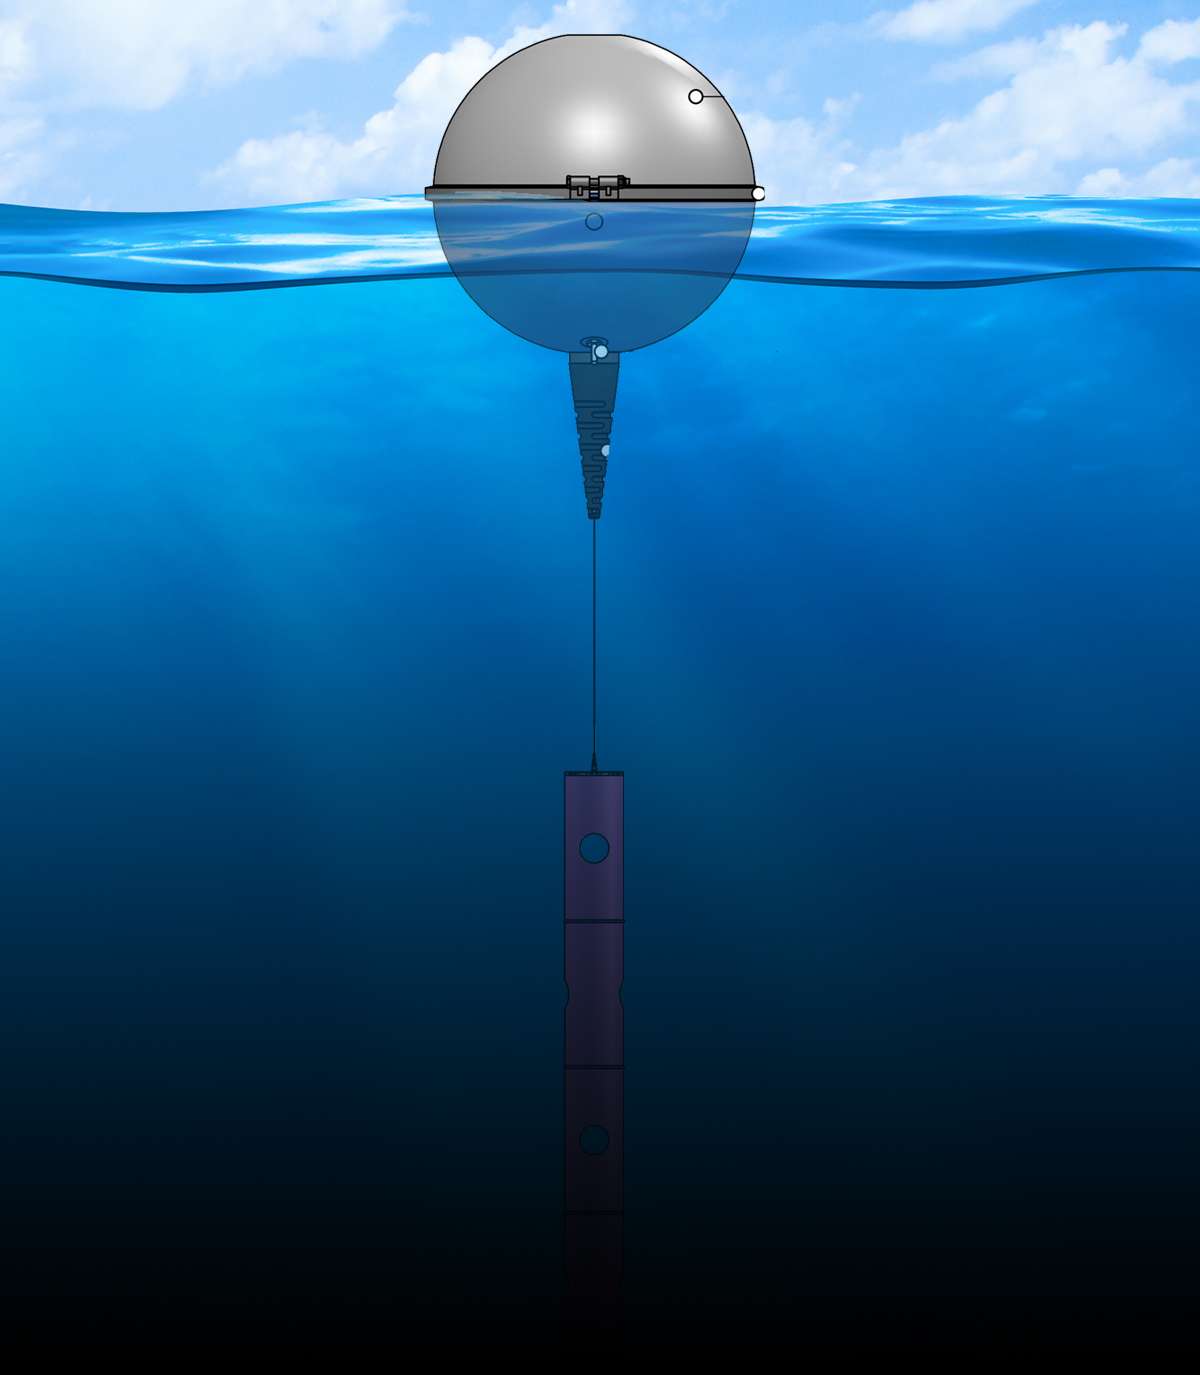
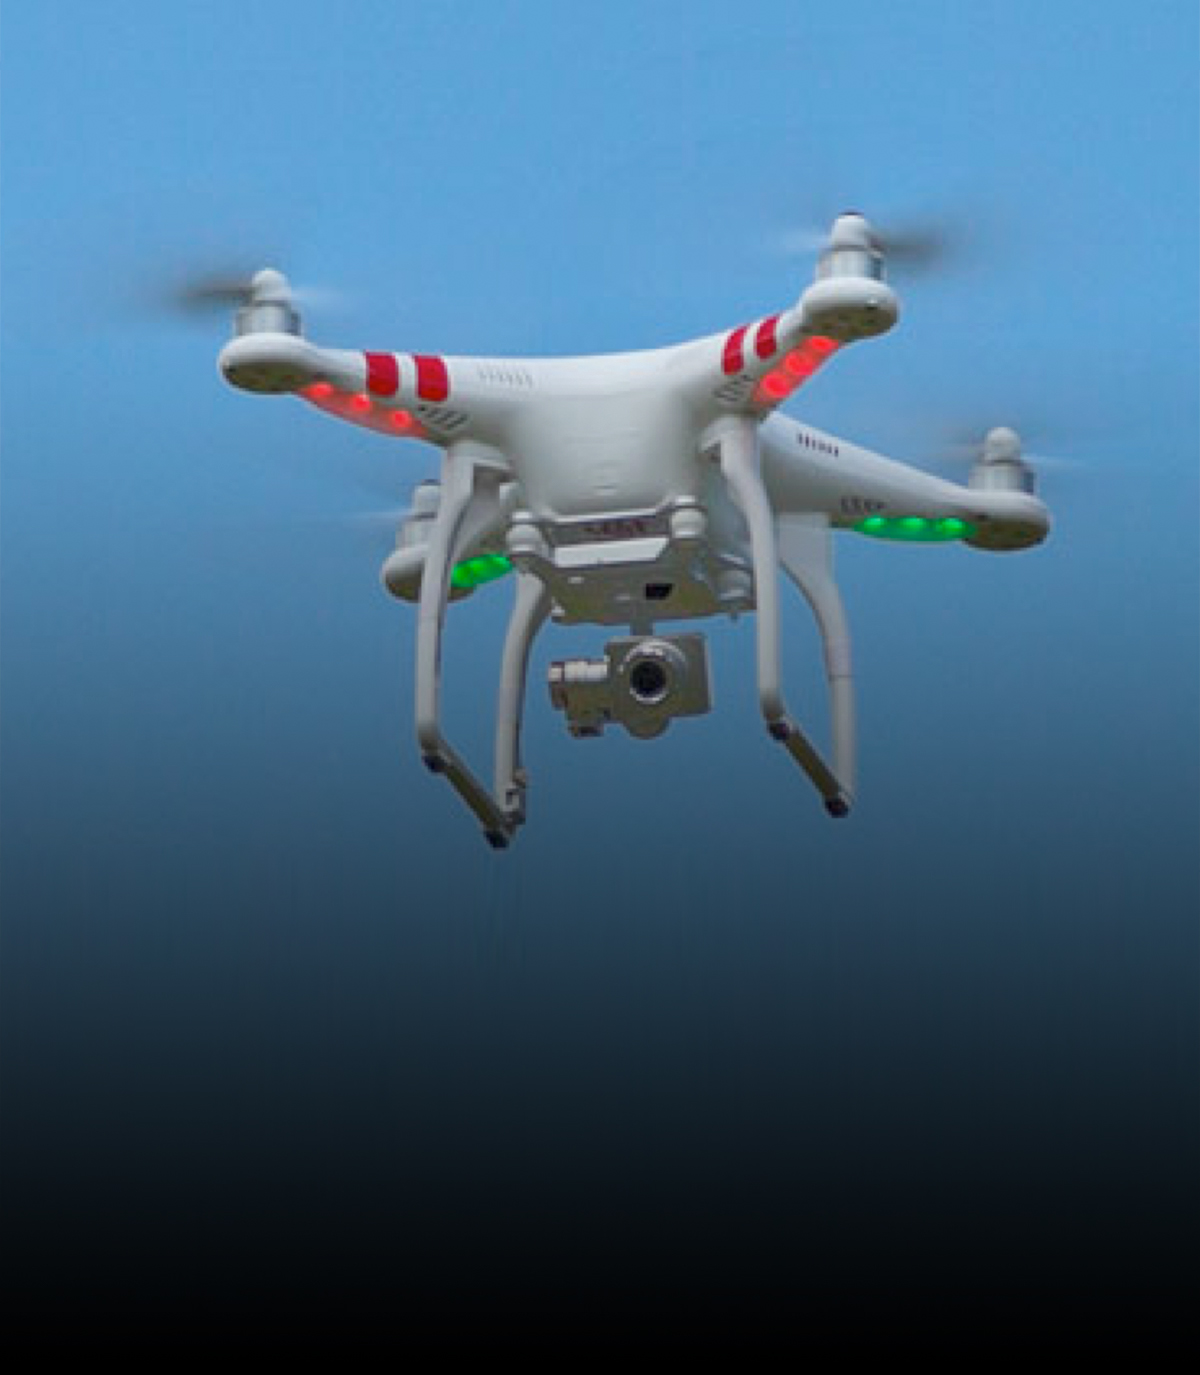
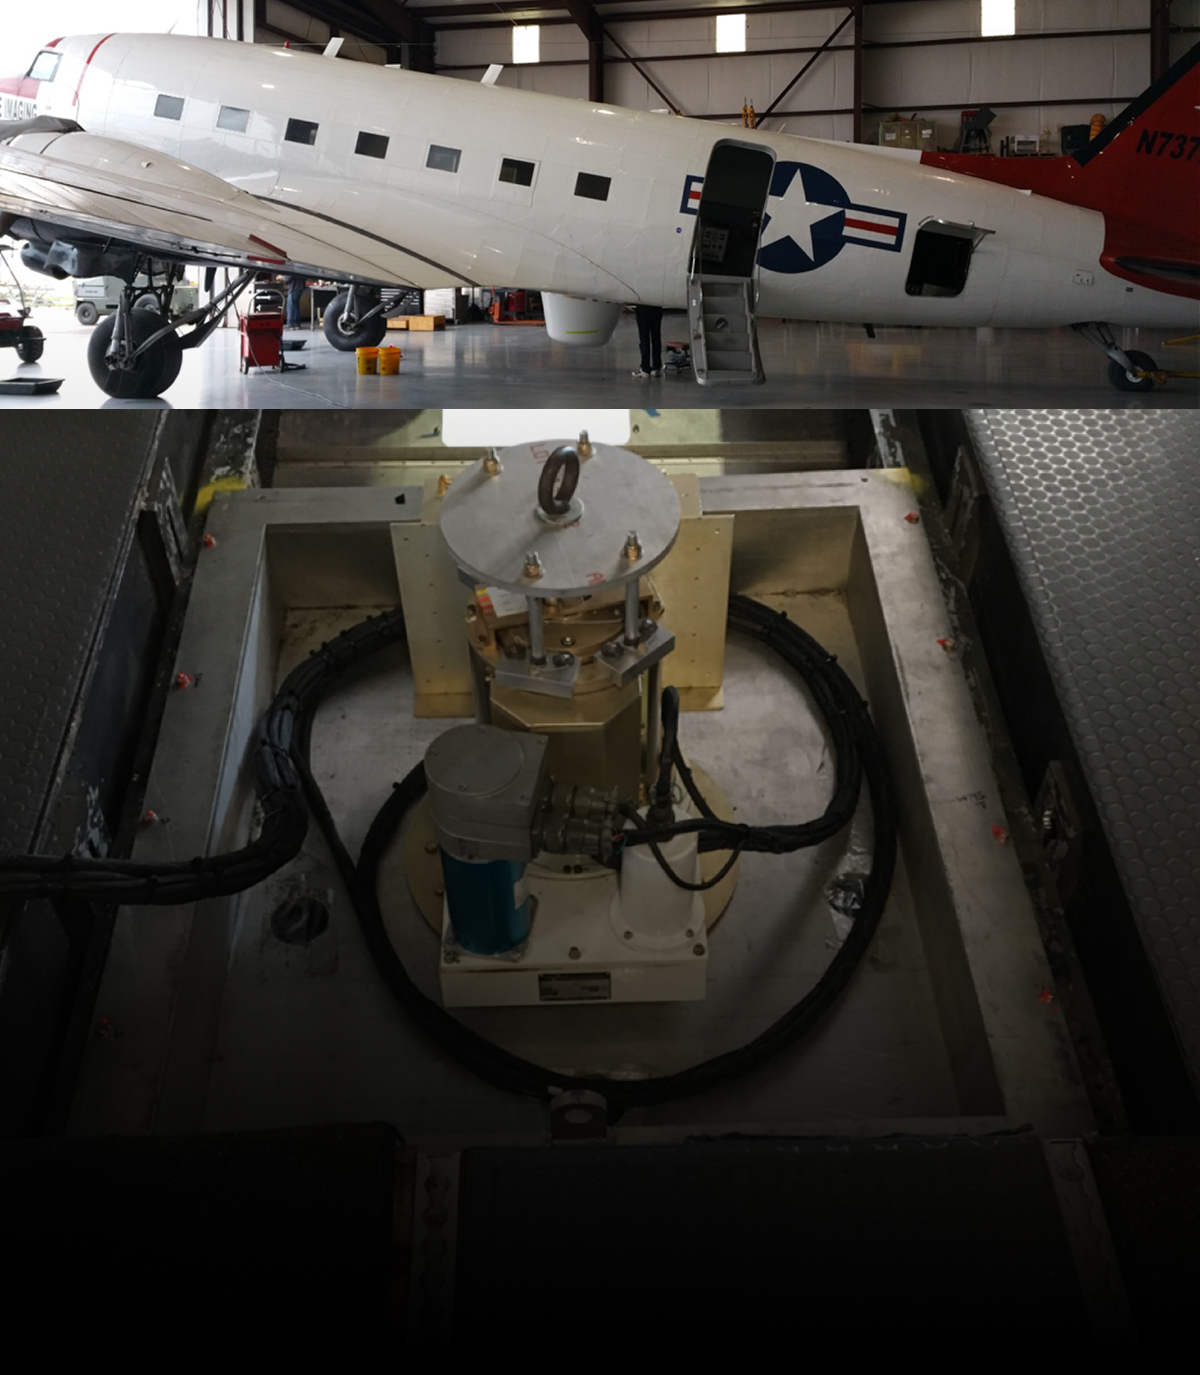
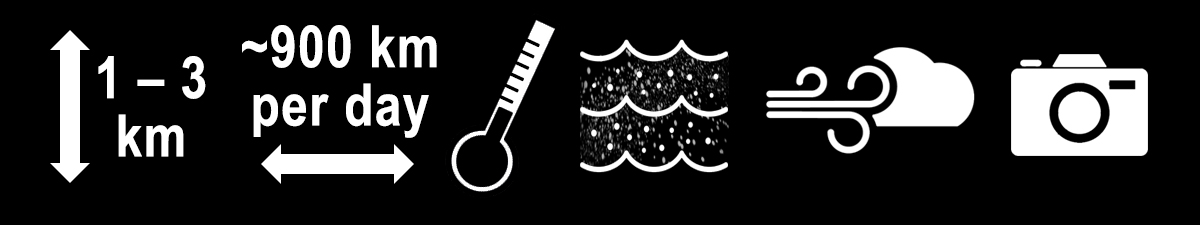
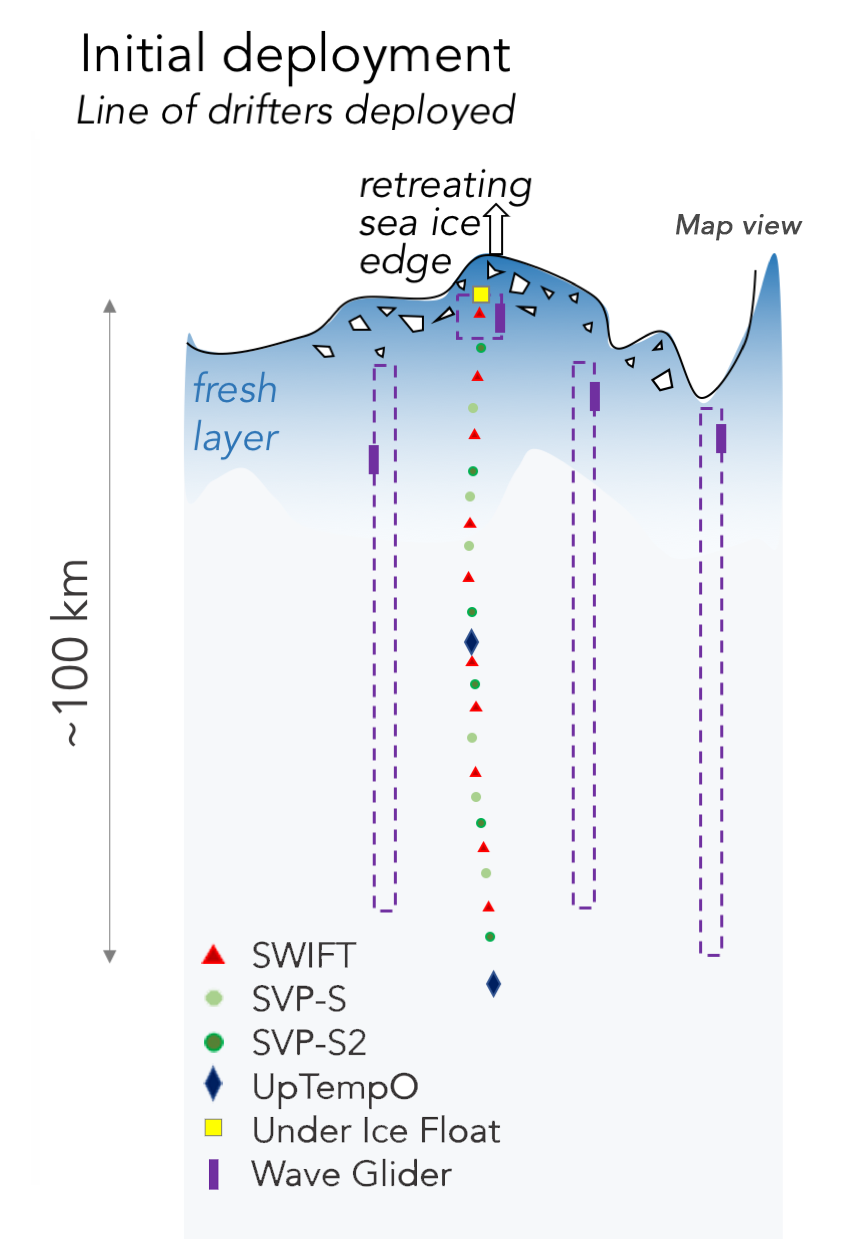
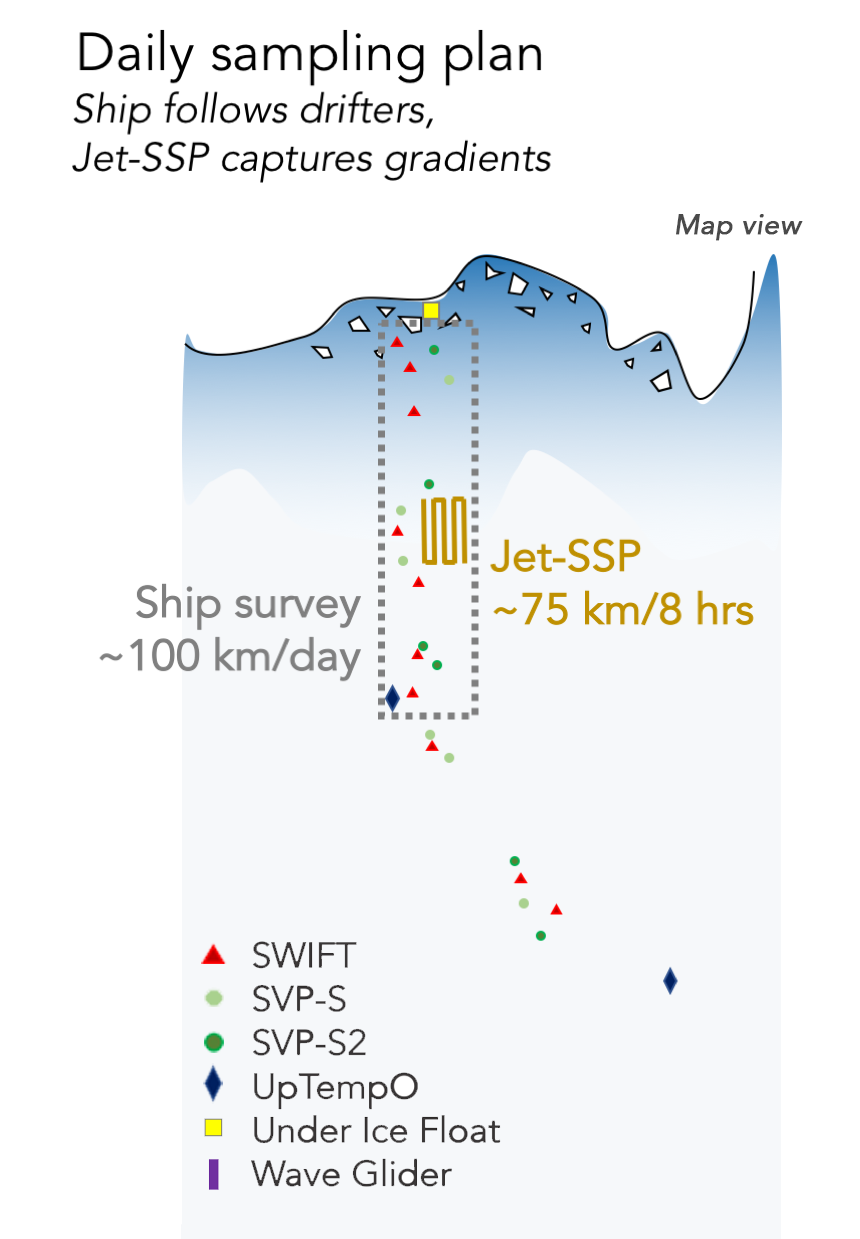
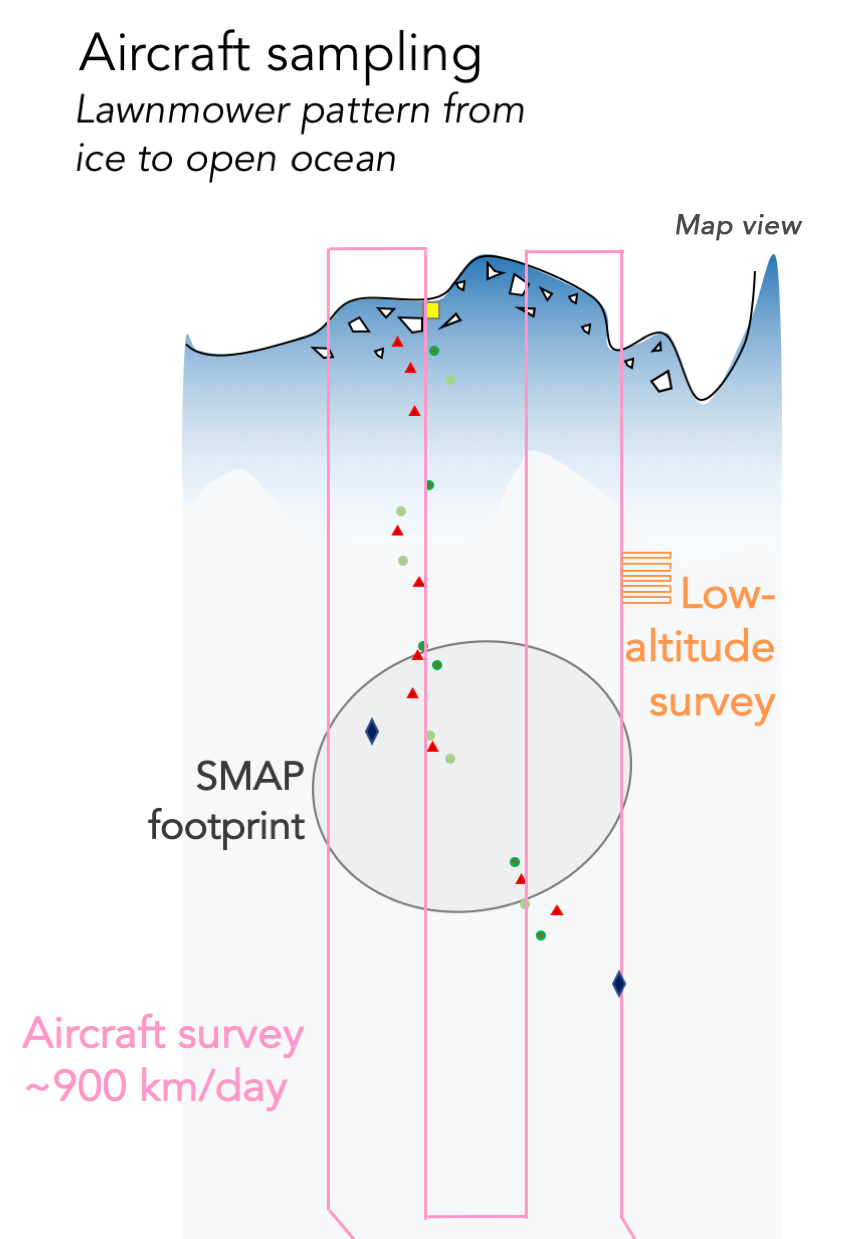
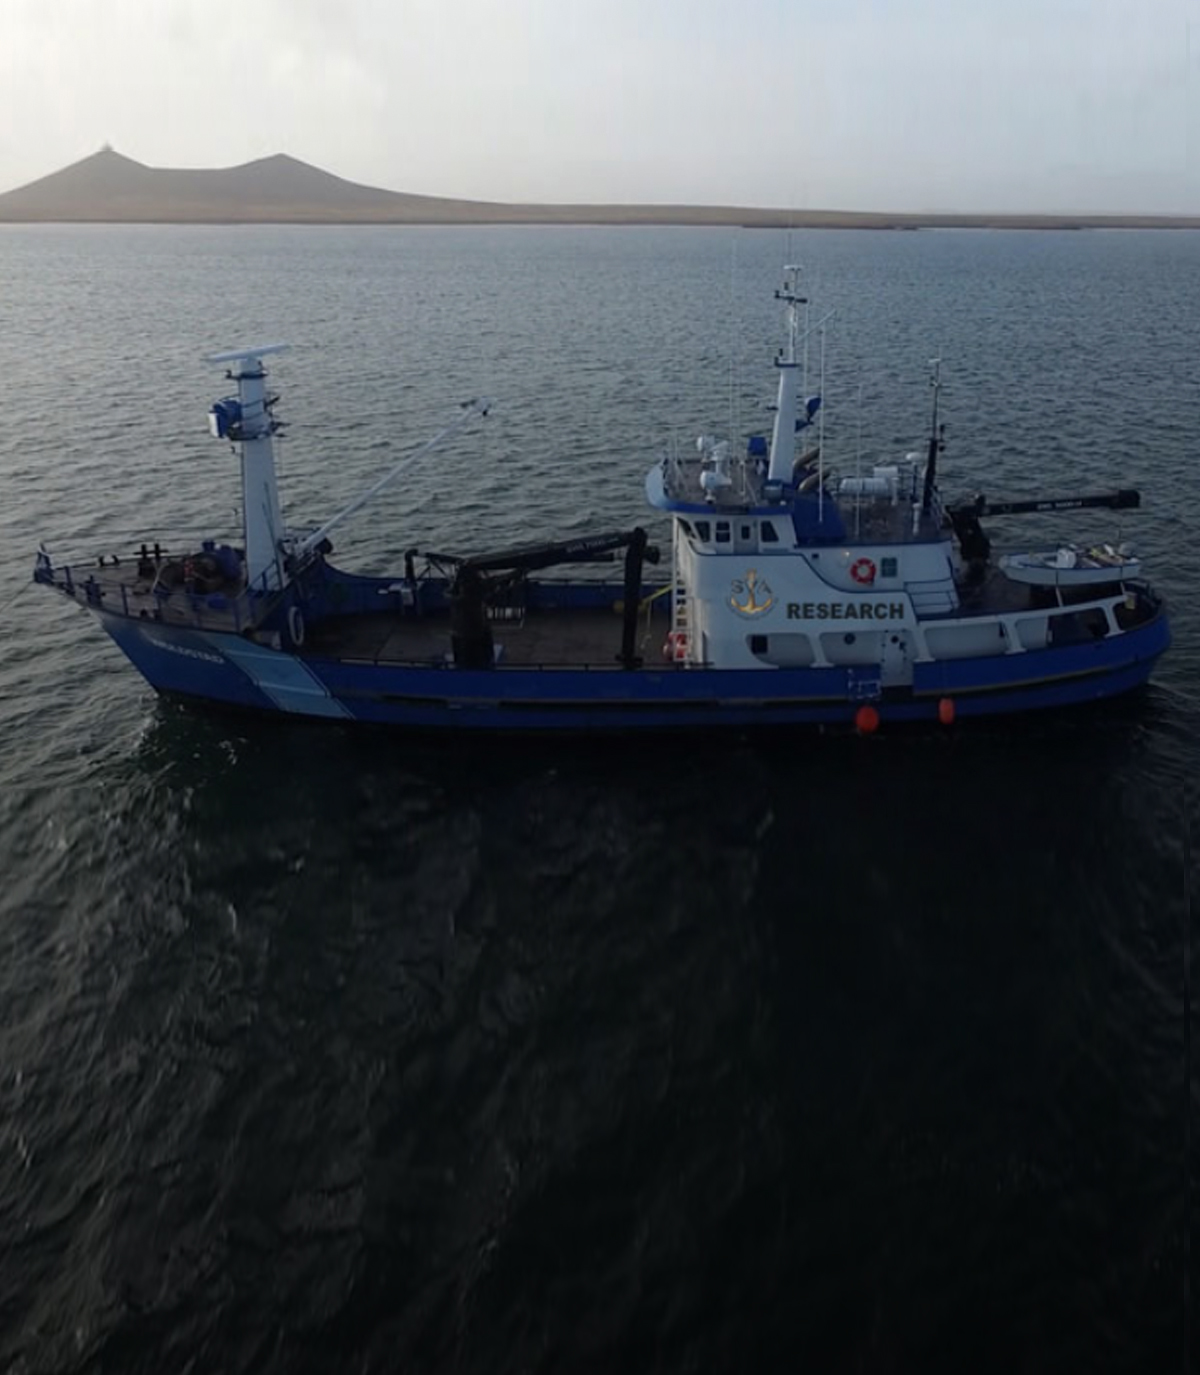
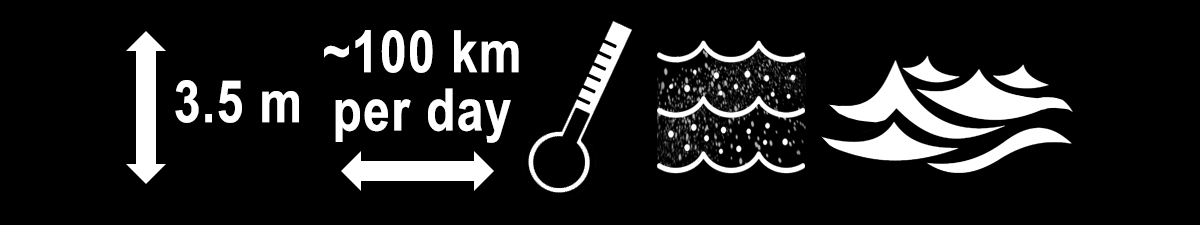
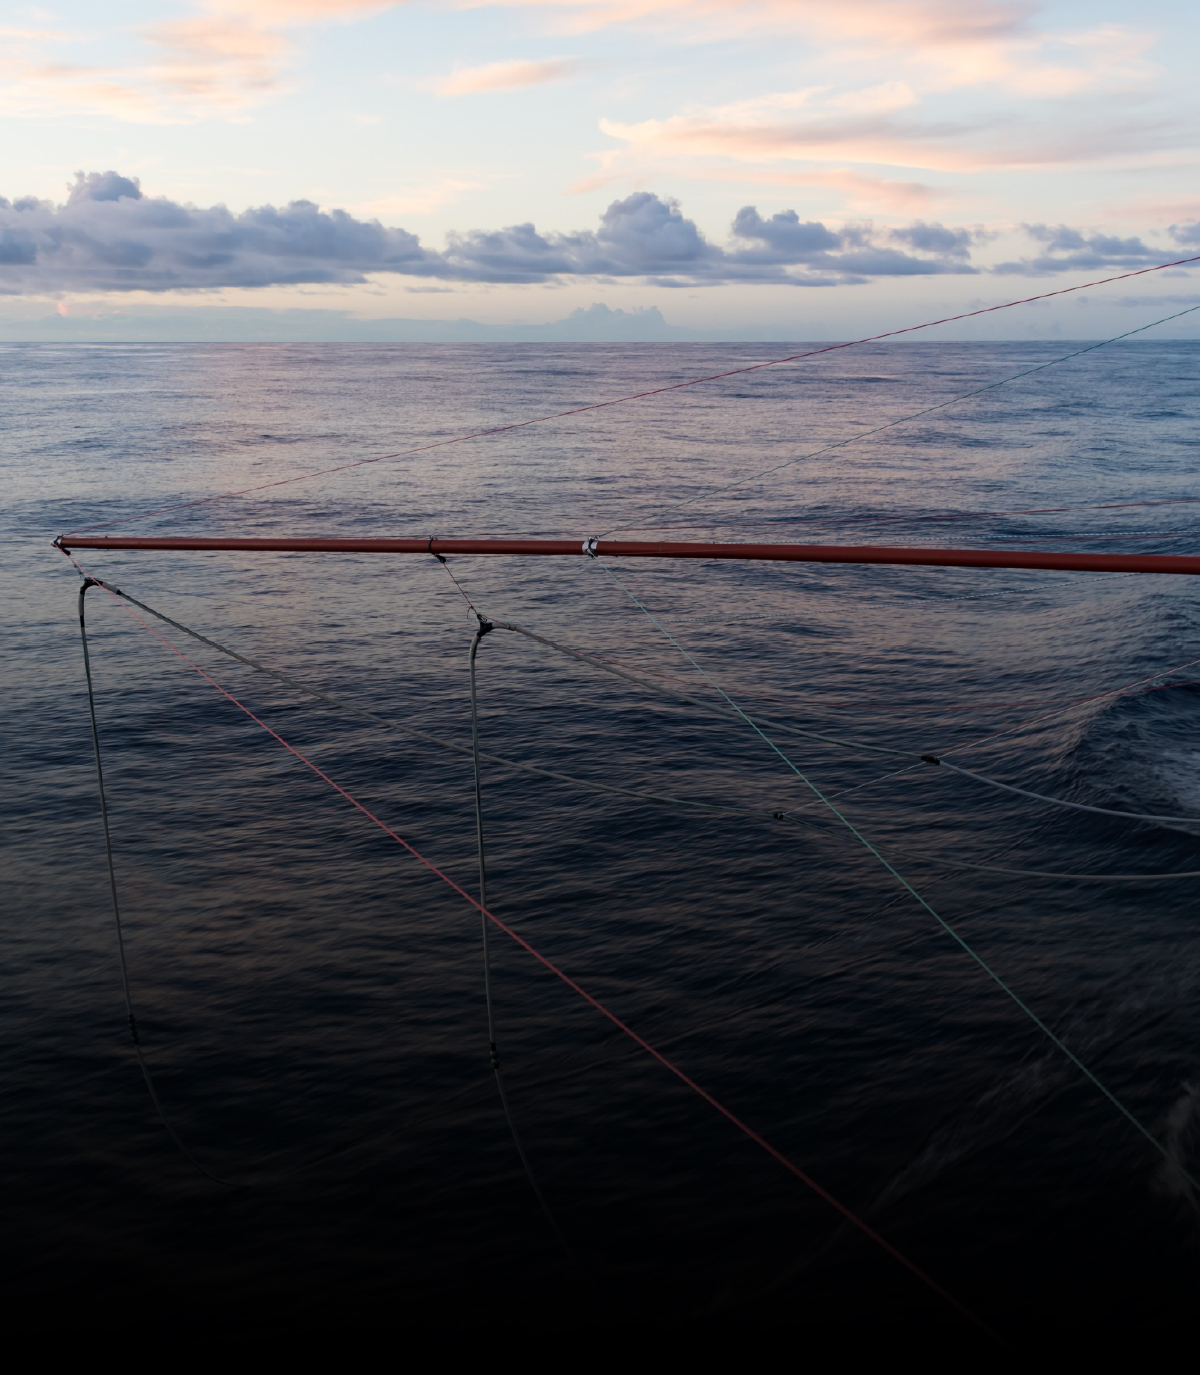
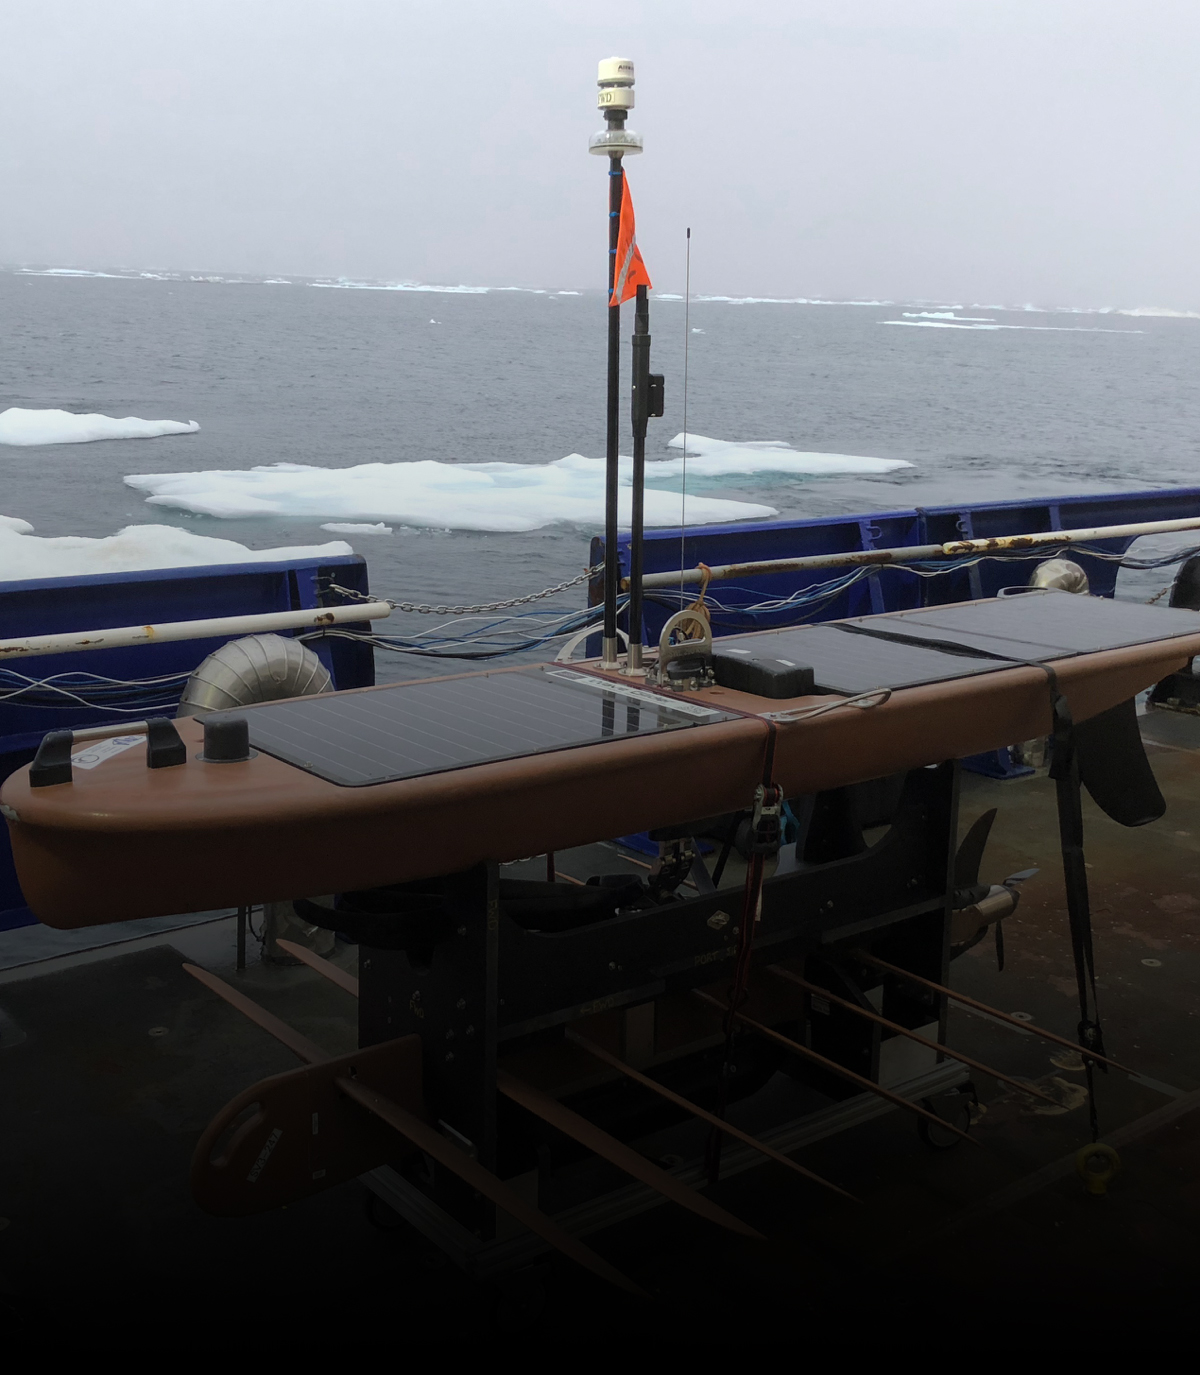
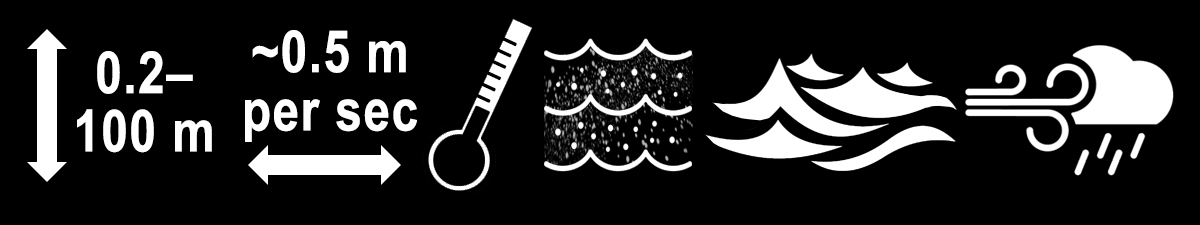
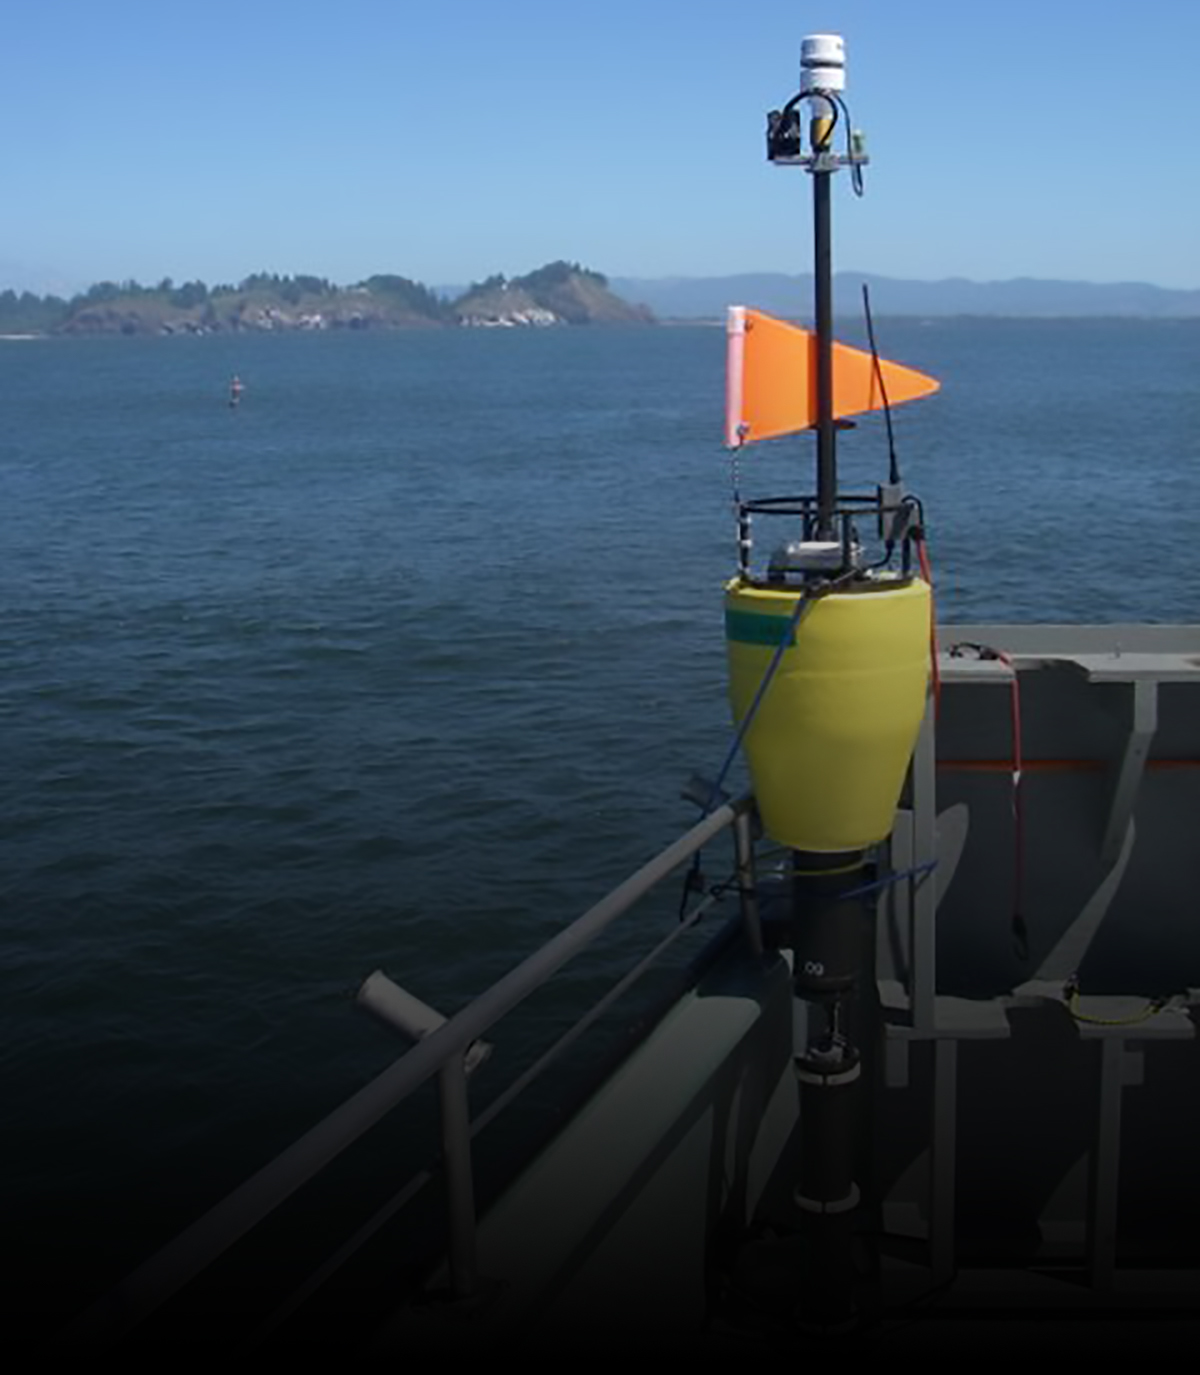
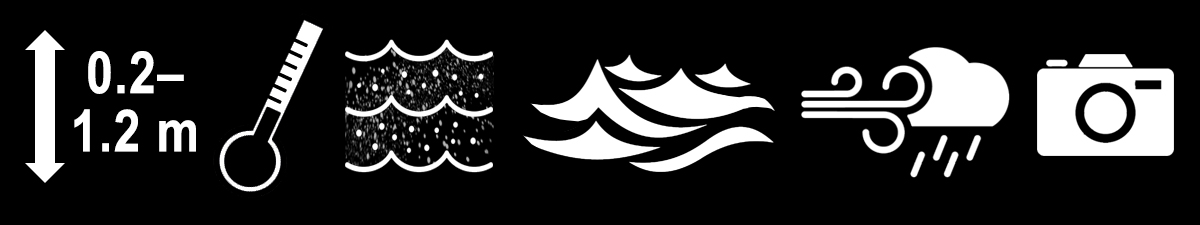
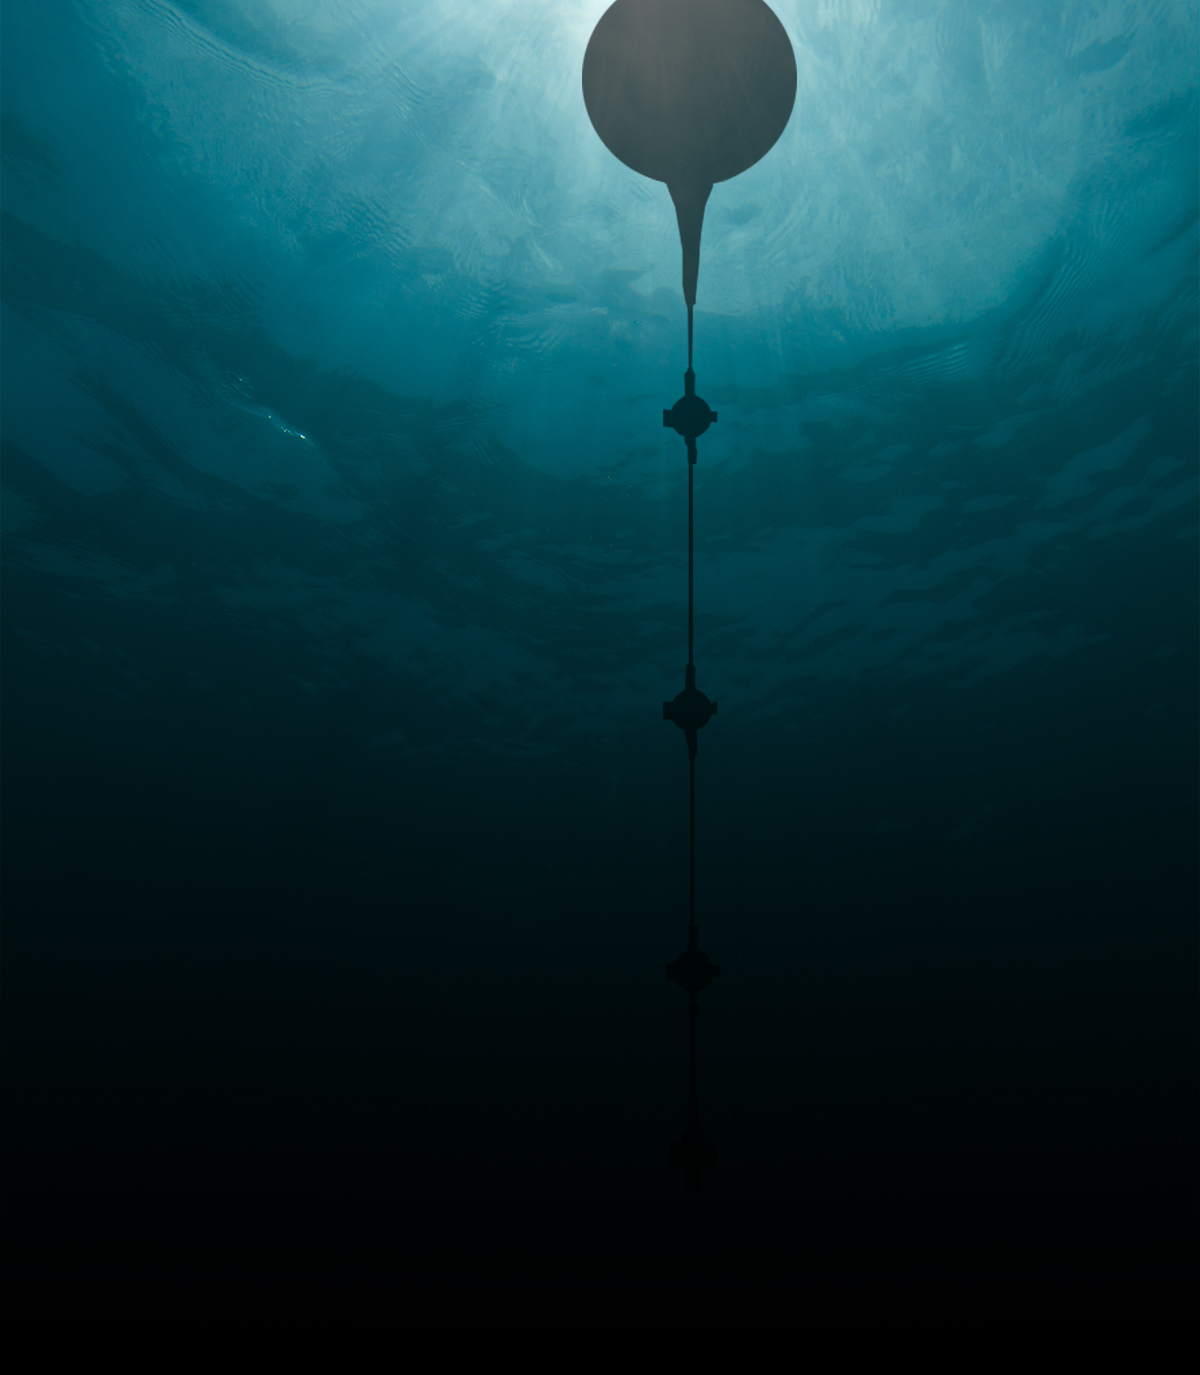
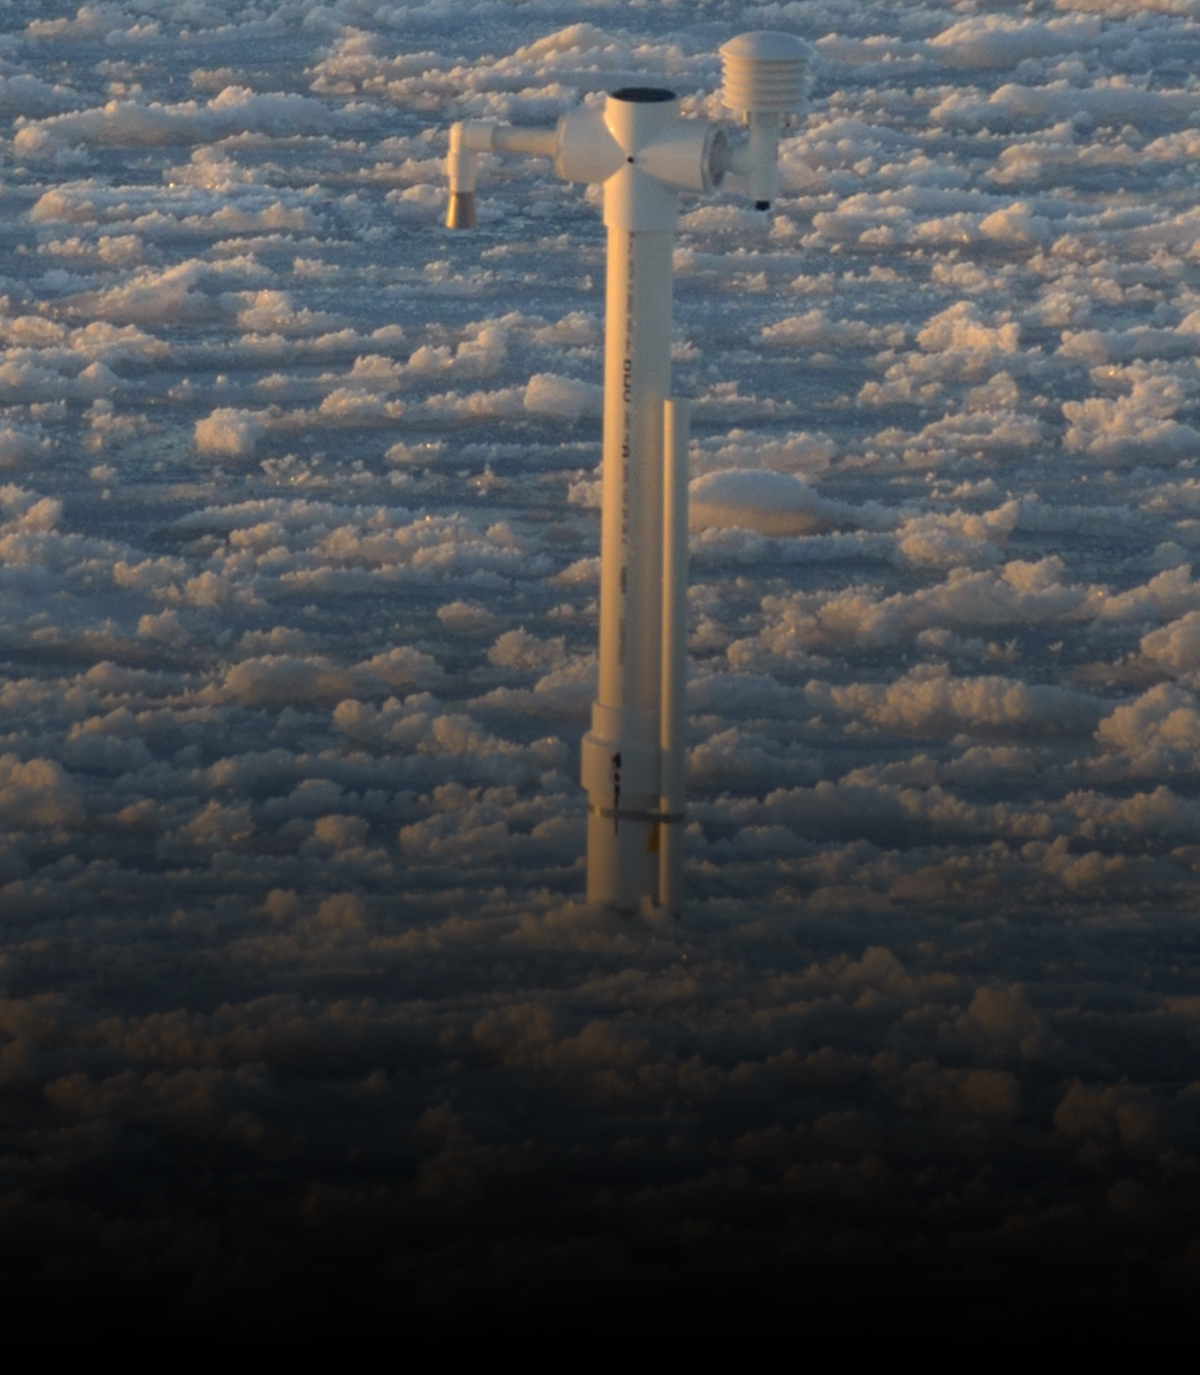
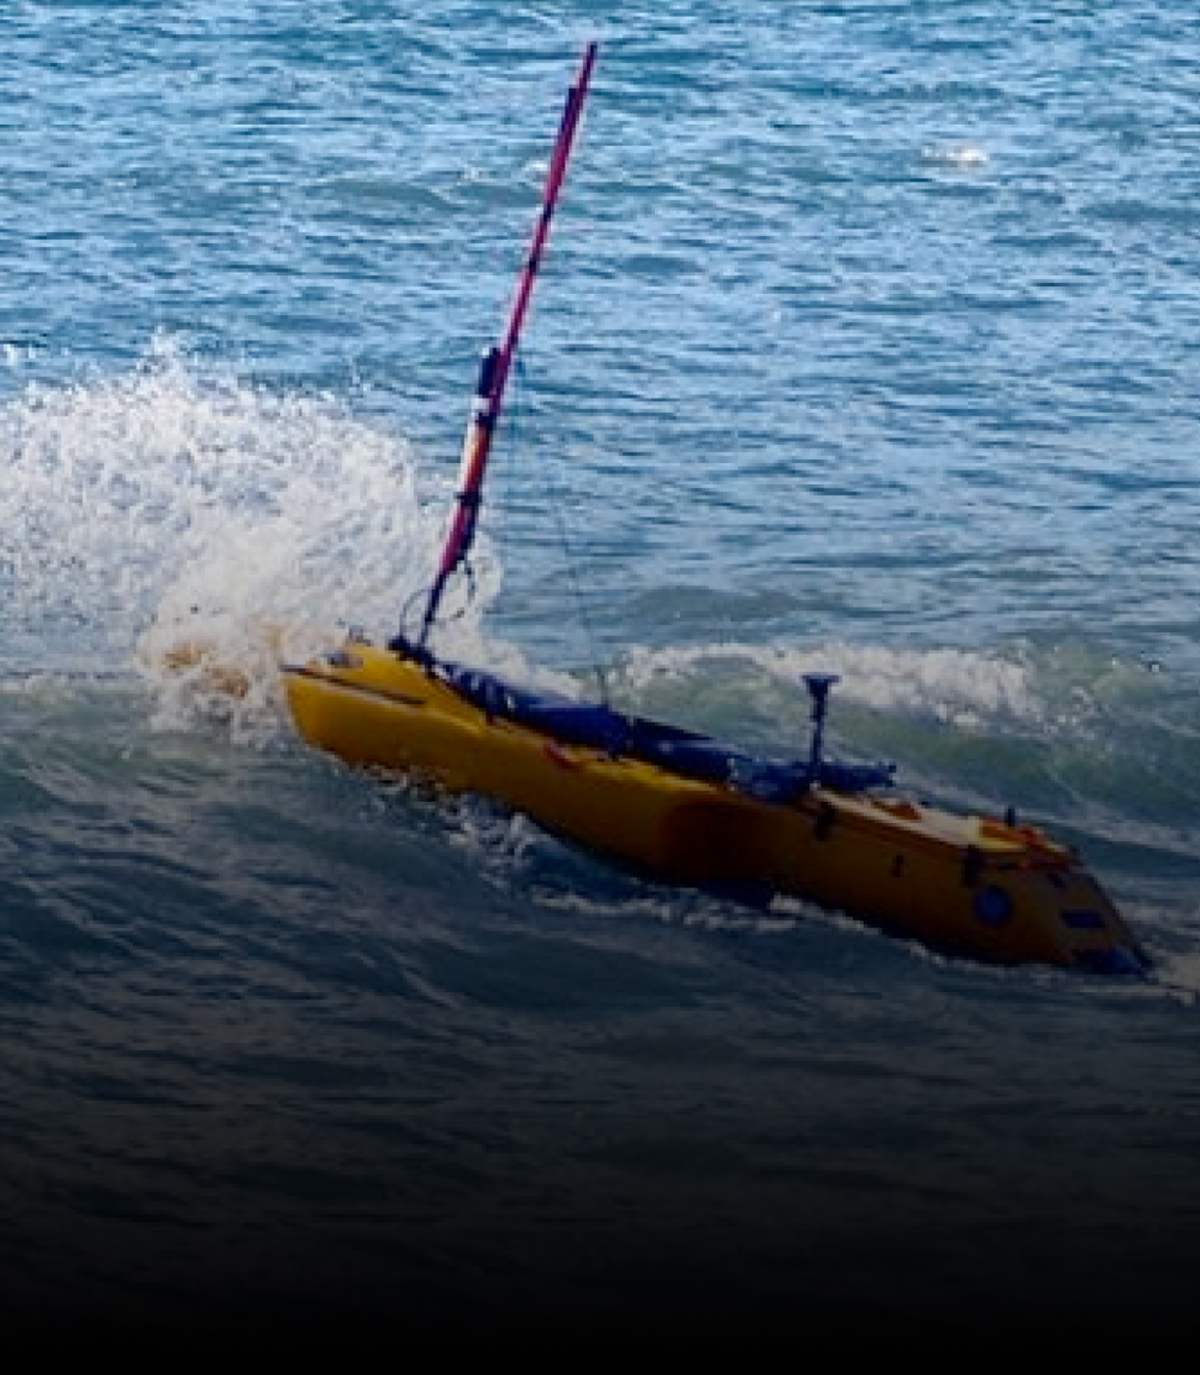
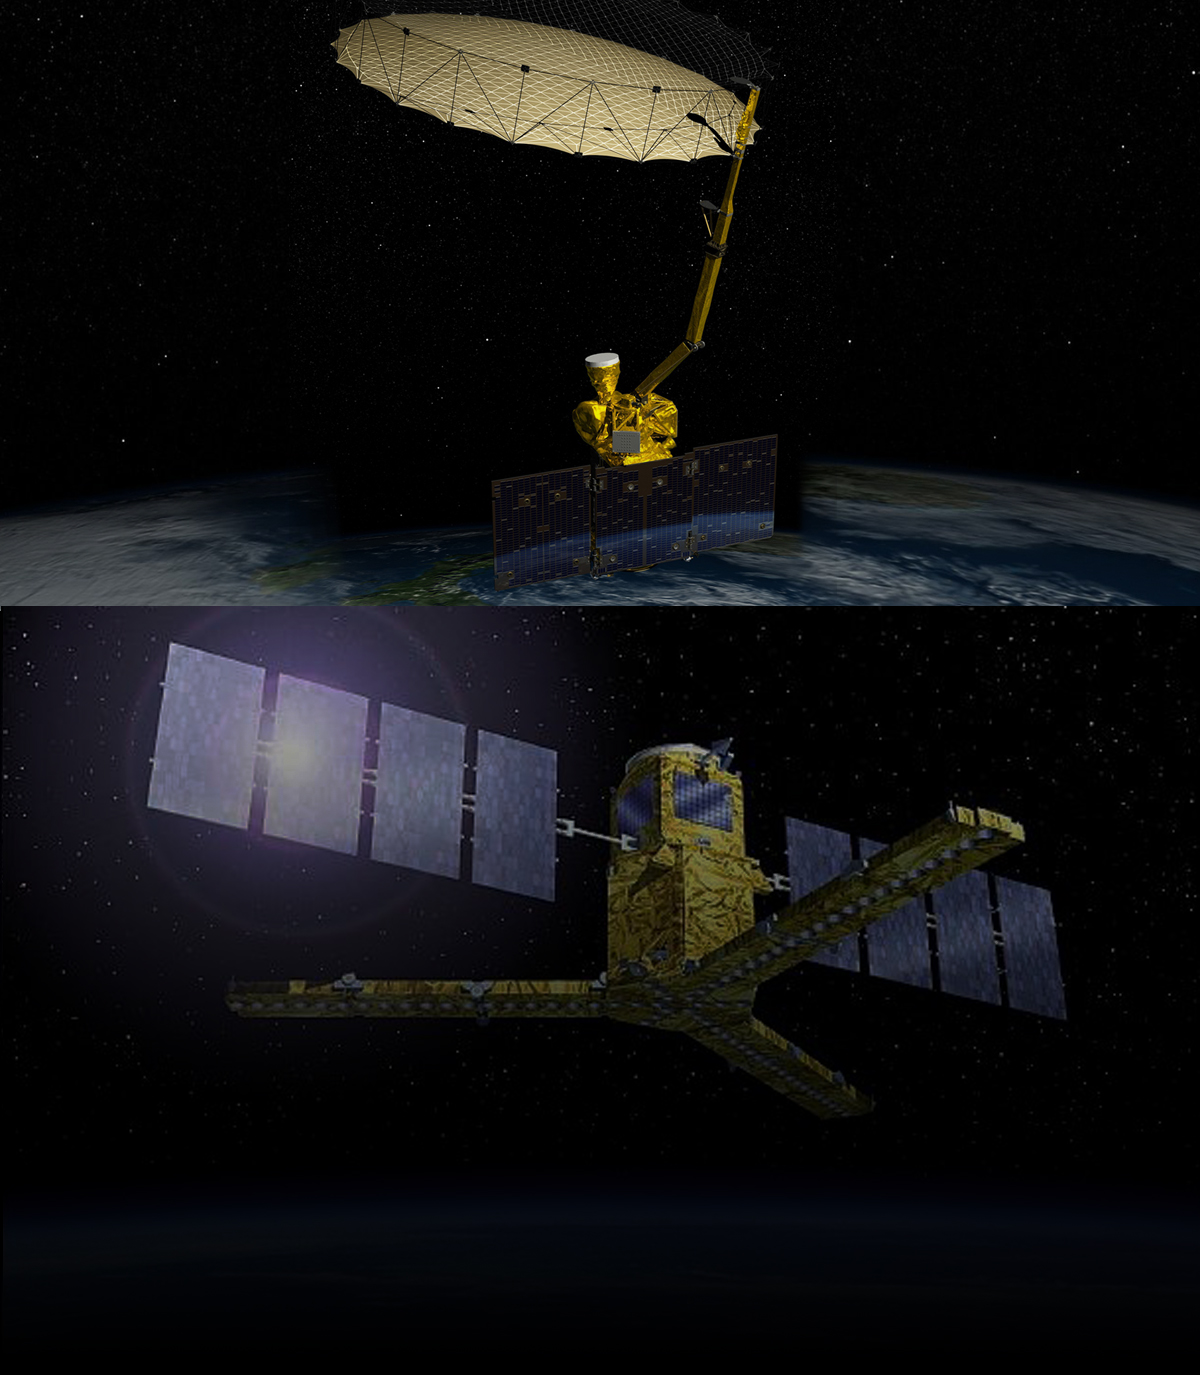
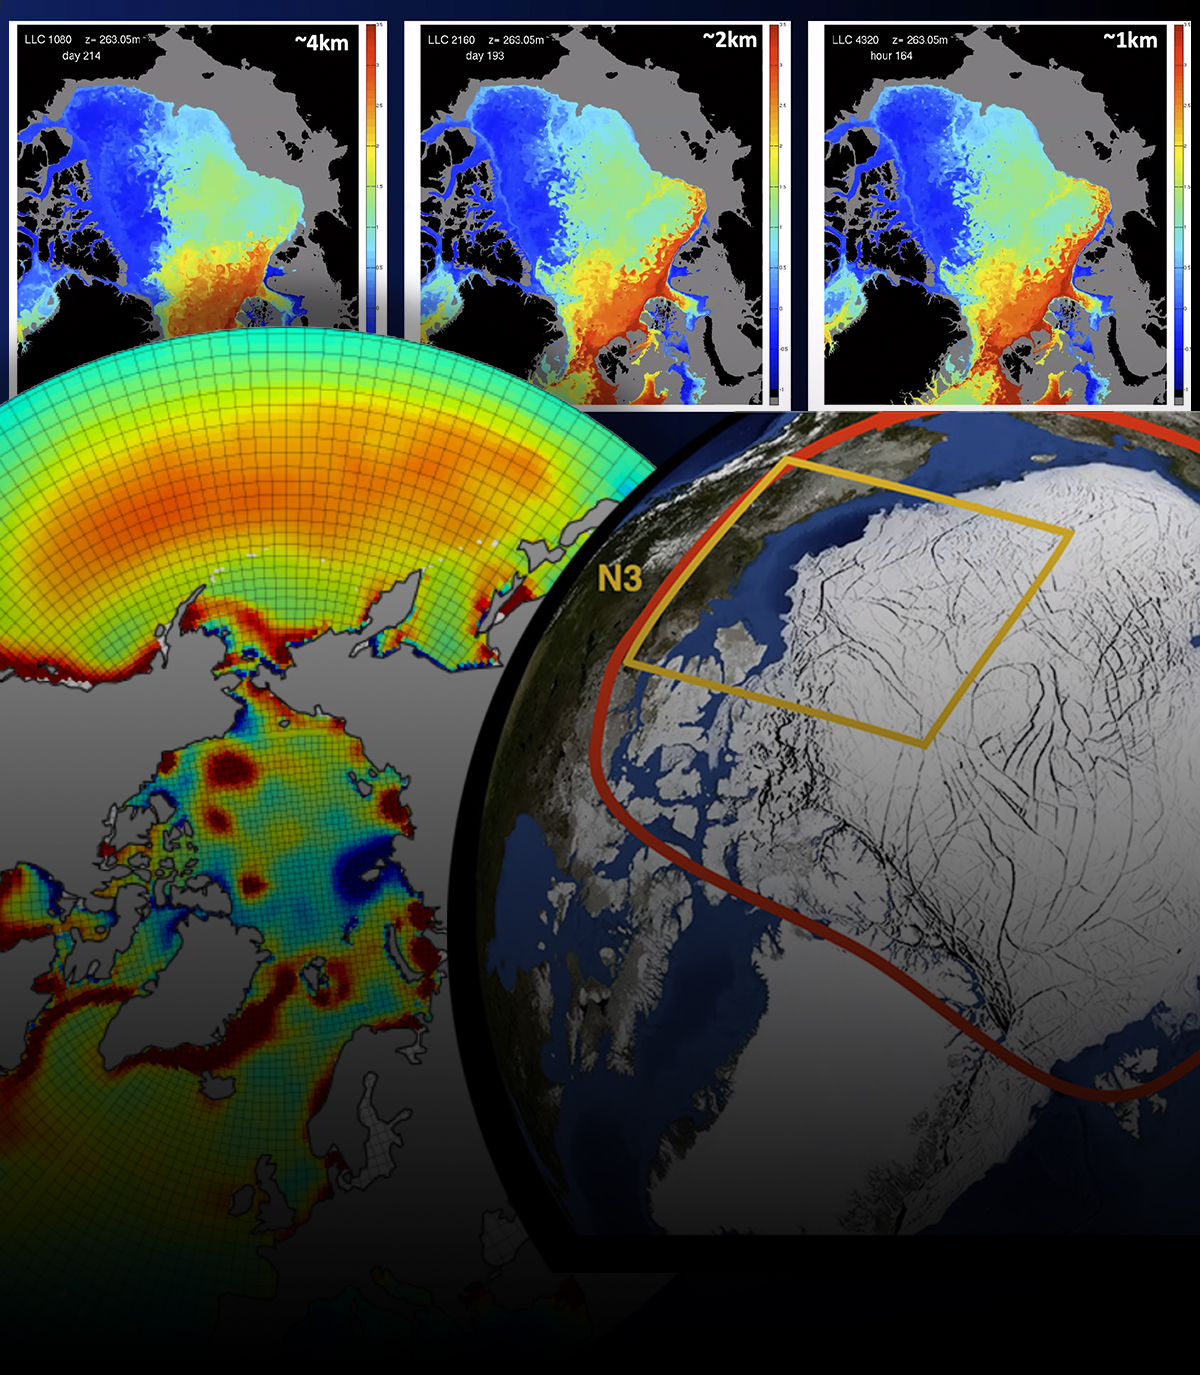
We will address SASSIE science themes and questions through a multi-scale in situ, airborne, satellite, and modeling experiment. The primary aim of the field campaign is to capture the upper ocean structure during the transition from summer sea ice retreat to autumn sea ice advance. The types of measurements made by each instrument are shown as icons.


Ship-based

Underway CTD

Underway CTD
Peter Gaube, Lead
This instrument measures conductivity (i.e., salinity), temperature, and depth (CTD). It is coupled to a sensor that provides data on chlorophyll-a (i.e., indicator of ocean productivity). It will capture the variability in upper ocean layering from near the ice edge to the open ocean, including the depth and horizontal extent of the melt layer.

Carbon Levels at the Arctic Salinity-Stratified Sea Ice Edge (CLASSSIE)

Carbon Levels at the Arctic Salinity-Stratified Sea Ice Edge (CLASSSIE) »
To study how sea ice affects ocean CO2 uptake, CLASSSIE will measure key carbon system variables very near the surface of the ocean and compare it with measurements at the typical depth of the ship's intake (5-8 m). In the presence of meltwater stratification, it is expected that differences in properties between the meltwater layer a few meters below will influence the map of Arctic Ocean CO2 uptake, which this work will refine.
Piloted & Drifting

Under Ice Float

Under Ice Float
Andrey Shcherbina, Lead
This autonomous profiling float has been used in numerous experiments and tested in the Arctic. A special version will be built for SASSIE, outfitted with temperature and salinity sensors, an upward-looking ocean current profiler, and high-resolution imaging system and altimeter for ice avoidance. It will remain in the water to sample the early stages of freeze-up.

Surface Velocity Program (with salinity) Drifters

Surface Velocity Program »
Mike Steele, Lead
For SASSIE, ice-strengthened drifters will track ocean surface currents, temperature, and salinity. They will sample every 5 min during the intensive sampling period, then every 30 min once frozen into ice. Data will be used for a mixed layer salinity budget during the summer-autumn transition and for comparison with satellite salinity data.

Unmanned Aerial Systems

Unmanned Aerial Systems
Peter Gaube, Lead
Equipped with optical cameras, Unmanned Aerial Systems will be flown by licensed operators onboard ship. Images will be geo-rectified with pixel resolutions of ~1 cm over ~300 by 300 m frames. Images will be used to identify and measure the area of ice floes, provide surface ice drift estimates, and map sea ice edges for field campaign planning.
Airborne, Satellite & Modelling

Airborne & Passive Active L- and S-band Sensor (PALS)

Airborne & PALS Sensor »
Ian Fenty and Sidharth Misra, Leads
Sea surface salinity measurements will be made with an airborne PALS microwave radiometer. A compact wideband radiometer will sense sea surface temperature and ocean wind speed. Aircraft data will give broad-scale context, enabling the quantification of sea surface salinity and temperature, their horizontal gradients, and sea ice signals.