

- HOME
- SCIENCE
- HIGHLIGHTS
- DATA & MAPS
- DATA FOR YOU
- MEETINGS
Version 5 (V5) is the official end-of-mission dataset, spanning the complete 45-month period of Aquarius science data availability from 25-Aug-11 to 07-Jun-15. Improving the accuracy of Aquarius measurements has been a key activity to ensure that the data are most useful for science and society. Scientists and engineers have worked together to test and refine algorithms – or step-by-step procedures for calculations – used to process Aquarius's ocean surface salinity data. V5 data represents the state-of-the-art in remote sensing of salinity and, although the Aquarius Project has ended, the raw data are available and plans exist to continue working on improvements.
Key processing steps that have been improved in the V5 data release are shown in bold the flow diagram in the blue box. Italics show interim values calculated during the stepwise process.
AQ V4 Release AQ V3 ReleaseUpdating processing algorithms requires calibration, the process of correlating instrument readings with a standard to check their accuracy. For Aquarius V5 data, this has been accomplished using data from in-water buoys as its reference sea surface salinity field (i.e., analyzed monthly Argo sea surface salinity from Scripps Institution of Oceanography).

The movie above features JPL engineer, Dr. Sid Misra, who discusses corrections for instrument drift over time and correctin for "wiggles" in the calibration of radiometer data (see blue box). He also addresses rationale for no longer usin the HYCOM model as the reference sea surface salinity field in V5 processing. This 34-minut video will be of interest to users of Aquarius data (transcript).
The movie at right features JPL engineer, Dr. Sid Misra, who discusses corrections for instrument drift over time and correctin for "wiggles" in the calibration of radiometer data (see blue box). He also addresses rationale for no longer usin the HYCOM model as the reference sea surface salinity field in V5 processing. This 34-minut video will be of interest to users of Aquarius data (transcript).
As indicated in the "Processing Steps" table, Aquarius's radiometer data go through several steps before being converted to sea surface salinity.
One of these steps is removing space contributions, including reflection of radiation from the galaxy on the ocean surface. This was first addressed in V3 processing after comparing data collected over the same area when the satellite was ascending versus descending in its orbit. Why? The Aquarius pointing geometry was tilted (i.e., not pointing straight down) and the ocean surface can act like a mirror. Depending on which direction the satellite was moving, galactic radiation could be reflected toward or away from the instrument. For V5, the ascending-descending differences have been recalculated based on improved knowledge of the reflected galaxy.
Interestingly, the January 2015 launch of another L-band radiometer mission, NASA's SMAP (Soil Moisture Active Passive), has contributed to improved processing of Aquarius data. For V5, the model of reflected galactic radiation has been updated based on data derived from different SMAP viewing directions (i.e., comparison of data from the same location on Earth based on SMAP’s forward-looking and backward-looking observations). The advantage of this approach is that it encompasses effects of the model for galactic radiation.
Another step in Aquarius processing is removing atmospheric contributions, including correcting for oxygen absorption. Salinity signals - detected by Aquarius as microwave energy emission - originate from the ocean and propagate through Earth's atmosphere. Comprised of about 20% oxygen, the atmosphere absorbs some of this energy and re-emits it based on air temperature. Thus, to better calculate salinity in V5, the model for absorption of atmospheric oxygen has been changed to Liebe et al. (1992).
Another change to the V5 product is a new source of ancillary sea surface temperature (SST), the Canadian Meteorological Center (CMC). The CMC product has better quality SST at high latitudes when compared to previous processing versions.
The surface roughness correction model uses data collected by the Aquarius scatterometer to estimate the effect of wind-roughened ocean surface on Aquarius brightness temperature measurements. Scatterometers operate by transmitting a pulse of microwave energy towards Earth's surface and measuring the reflected energy (i.e., backscatter). In general, rougher ocean conditions will scatter more energy than smoother, more reflective, mirror-like ocean surfaces. For Aquarius V5 data, various components of the surface roughness correction model were updated, in particular the SST dependence of wind-induced emission from the ocean surface.

A targeted analysis of Aquarius data demonstrated a high correlation between the spatial distribution of rain and patterns of reduced sea surface salinity. Thus, the Rain Impact Model (RIM) was developed to predict the effect of precipitation on Aquarius's salinity measurements. Available from NASA's Physical Oceanography Distributed Active Archive Center (PO.DAAC), Aquarius V5 data include instantaneous rain rates, which are used to filter for rain in the calibration of radiometer data and also for validation of Aquarius salinity data (see "Validation of Aquarius Data," below). In addition, for Aquarius V5 data, rain masks are applied to remove the biases that are caused by the strong precipitation (i.e., are "rain-flagged").
To learn more about RIM, please view the 16-minute video featuring scientist Maria Jacob (transcript).
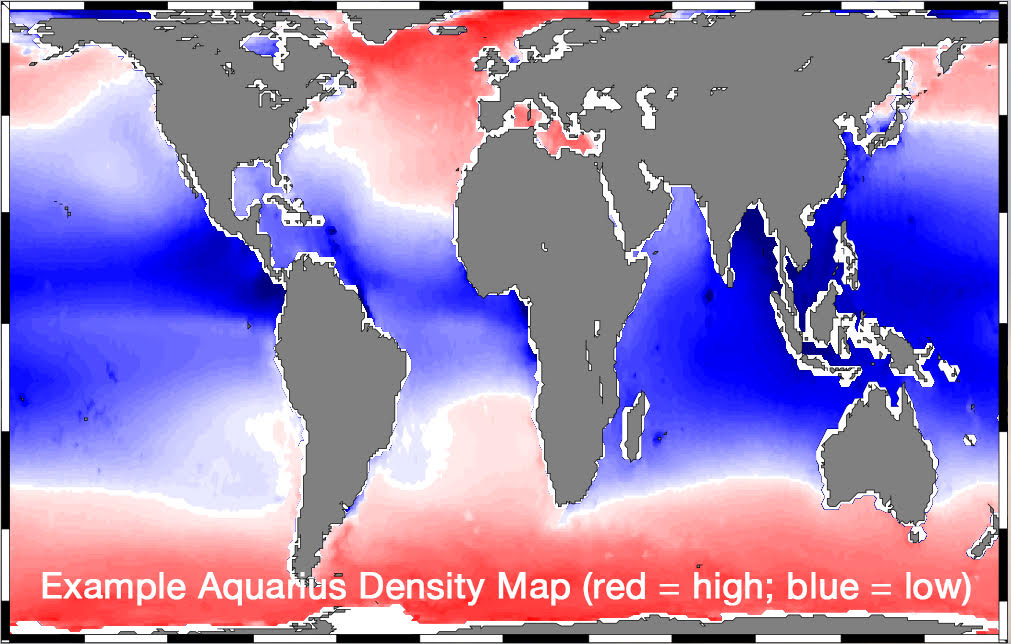
The previous Aquarius data release (V4) included a density product derived from Aquarius sea surface salinity and ancillary SST. Figure 1 shows that areas of colder, saltier water have higher densities (red colors) while the tropics - where water is generally warmer and less salty due to rain - have lower densities (blue colors).
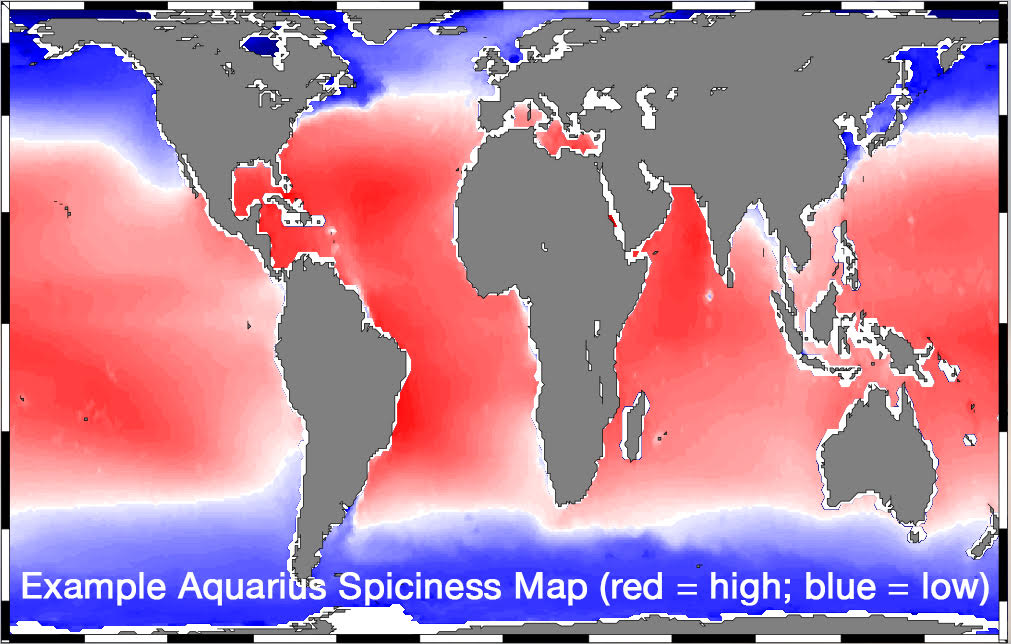
V5 includes a new, complementary "spiciness" product (see Fig. 2). Red colors indicate surface water that is warm and salty. Blue colors indicate colder, less salty seawater at the ocean surface. Spiciness data are uniquely suited to study the formation and movement of water masses and are available from the PO.DAAC.
In his 28-minute video, Dr. Julian Schanze provides background on Aquarius's density and spiciness data, including how they are used to better understand our ocean (transcript).
Calibration of Aquarius data goes hand-in-hand with validation, interrelated processes commonly known as "Cal/Val". Validation occurs when the instrument's data accuracy is proven by independent means. The V5 Salinity Data Validation Analysis, led by Dr. Hsun-Ying Kao, documents the progressive improvement from processing versions 2.0 to 5.0 by comparing each version of Aquarius data with in-situ data.
Forty-five months of data - including mapped, averaged (monthly, seasonal), and time-series data - are used for various validation analyses, some of which are described briefly here:
The report also includes important "Notes of Caution" (Section 12.2) for data users such as radio frequency interference, rain masks, land contamination close to coasts, and regionally dependent static and time-varying biases.