- HOME
- SCIENCE
- HIGHLIGHTS
- DATA & MAPS
- DATA FOR YOU
- MEETINGS


This 2019 publication includes the first systematic analysis of six commonly used, gridded (i.e., Level-3) SSS products from NASA (Aquarius and SMAP) and the European Space Agency (SMOS). The products are evaluated in terms of their consistency among one another and with in-water data.
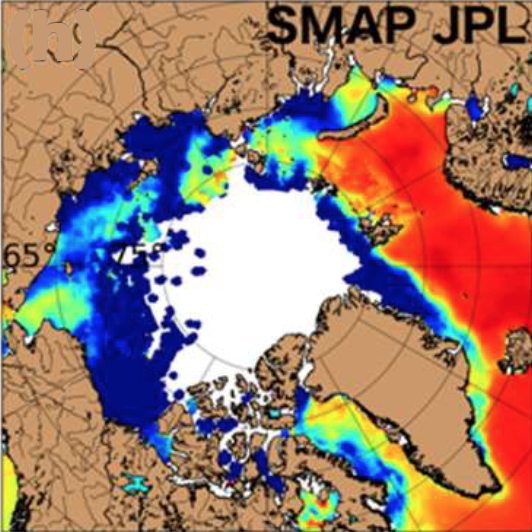
The study is performed in areas where SSS retrievals are available for each product. Availability of SSS data – i.e., "ice-free" or non-masked ocean areas – varies considerably among products as shown in the following table.
| SMOS | Aquarius | SMAP | ||||
|---|---|---|---|---|---|---|
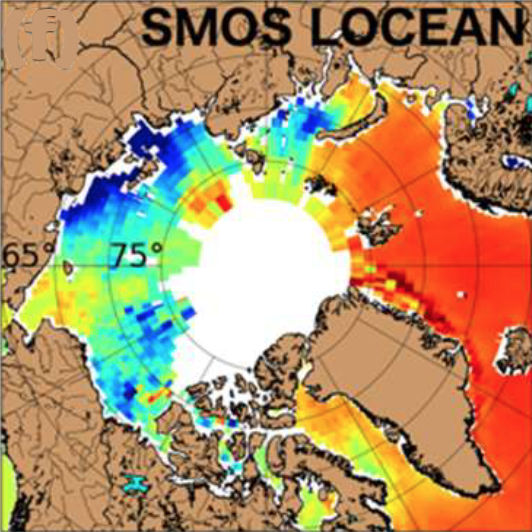
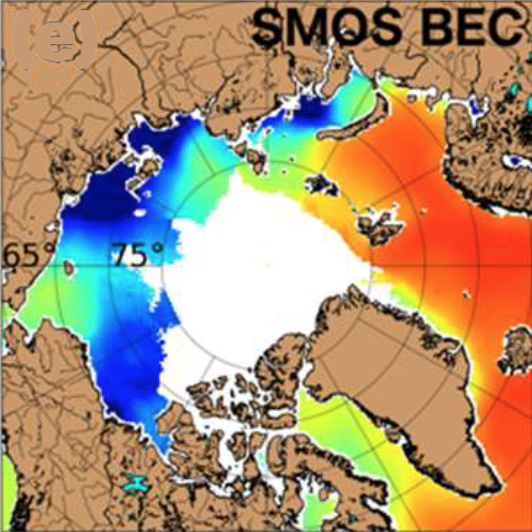
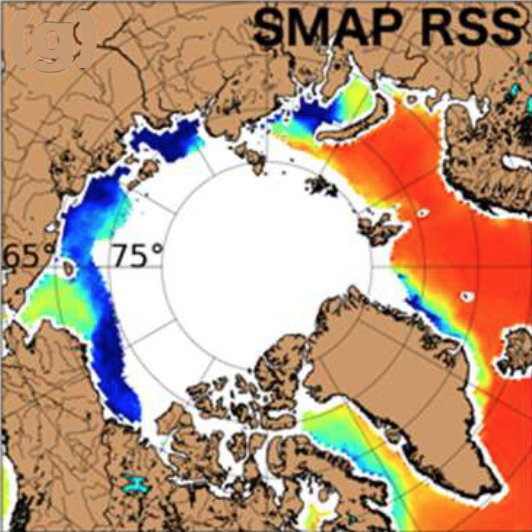
| Data product used in study | Debiased Version 3 (LOCEAN) | Version 2 – Barcelona Expert Center (BEC) | Version 5 – RSS (native) | Version 5 – JPL (smoothed) | Version 3 – RSS (smoothed) | Version 4.2 - JPL |
| Ancillary product | ECMWF sea surface temperature (SST) | EUMETSAT Ocean and Sea-ice Satellite Application Facility sea-ice concentration | 1/12° sea-ice concentration data from NOAA NCEP is integrated over the Aquarius satellite footprint and weighted by the antenna gain to obtain an ice fraction | Daily AMSR-E/AMSR2 sea-ice concentration data are integrated over SMAP footprint and weighted by the antenna gain to give an ice fraction | 1/12° NOAA NCEP sea-ice concentration (re-gridded to 0.5° x 0.5°). For each SMAP footprint, the nearest sea-ice concentration value is found | |
| Ice mask or flag | Ice mask based on dielectric constant* and ancillary SST | Masks sea-ice concentrations higher than 15% | Flagged if ice fraction exceeds 0.1% | Flagged if ice fraction exceeds 3% | Pixels are flagged if ice fraction exceeds 0.1% | Pixels are flagged where sea-ice concentration exceeds 3% . |
| Notes | *Uses Klein & Swift (1977) dielectric constant model. Others use Meissner & Wentz (2004). | BEC products are dedicated to high latitudes. | Official end-of-mission product from Remote Sensing Systems. | Investigator-led product (also known as "CAP"). | 40-km resolution mean product used for this study. | 60-km resolution investigator-led product (also known as "CAP"). |
When averaged over the Arctic Ocean, the six products show excellent consistency in capturing seasonal and year-to-year variations (Fig. 1). The products also consistently identify regions with strong SSS variability over time.
Primary challenge for Arctic Ocean SSS: Cold seawater. This is because brightness temperature (TB) has lower sensitivity in colder waters at the frequency employed by today's SSS satellites (L-band). As expected, root-mean square differences of satellite SSS with respect to in-water measurements improves with increasing seawater temperature.
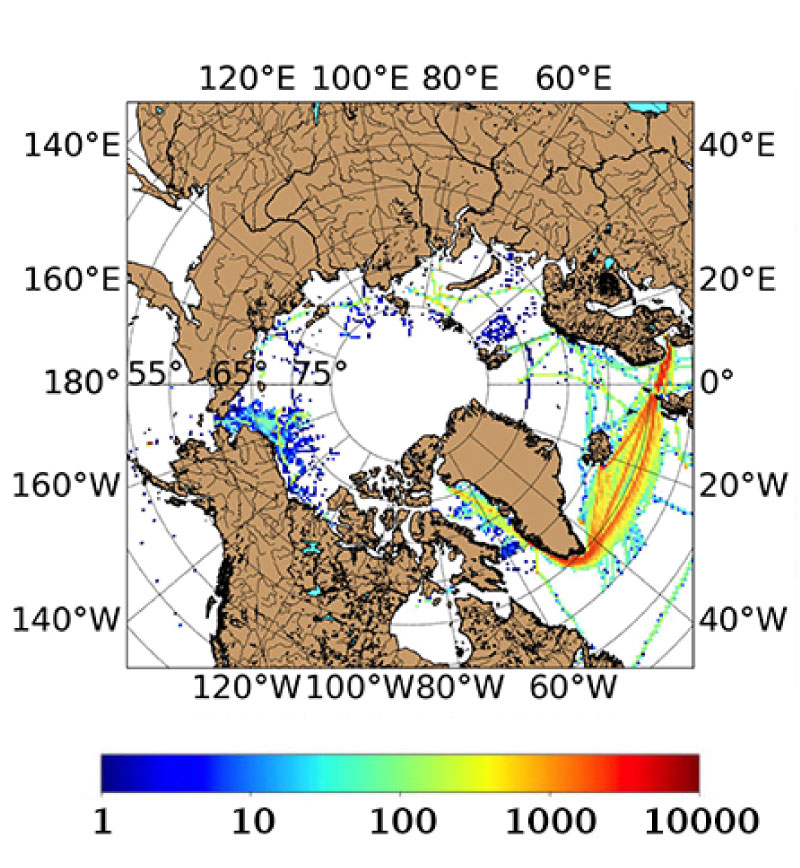
In the Arctic Ocean, in-water data are sparse as illustrated in a map showing the number of observations from 2011 to 2017 (Fig. 2). So, the study team focused on comparing satellite SSS with in-situ salinity measurements along ship transects (red lines in the map). Based on these transects, the data suggest that satellite SSS captures salinity gradients away from regions with significant sea-ice concentration.
Surprised in a positive sense that all the products are pretty consistent with each other. It was generally thought beforehand that satellite salinity products would not have good quality at high latitudes. So, it was actually a pretty good finding – a positive one – in that sense.
That's a very good question. The biggest challenge, I would say, in the Arctic for calibration and validation of satellite-derived salinity is locating in-situ data. There is a lot of data but it is not necessarily publicly available. Principal Investigators (PIs) who have campaigns in the Arctic often put their data in well-known databases (e.g., NOAA's World Ocean Database, CORIOLIS). We should work on making sure that PIs funded to research the Arctic at international levels are required to put their data in databases that are well known in the community. That would be a great thing because it was very tough to find these data. I had to contact a lot of people, which is not ideal. And at times, the data that I was finding was replicated in other databases, so there was a lot of redundancy.
Yes, I have done that in different river plume regions like the Amazon, Gulf of Mexico, Bay of Bengal, and Maritime Continent. I haven't yet done that in the Arctic but it is important to first be sure of what we can do with SSS, to what extent it can be used to reliably address science questions. But continuing to look in the Arctic Ocean would definitely be something of interest. There are some studies using SSS and ocean color to try to discriminate between freshwater coming from melted sea ice and river plumes, for example. That kind of research is very interesting to me.
These are connections that are not really well known and I have been discussing them recently with colleagues. We are just starting to look at SSS in the Arctic Ocean and we need to better understand all of these questions. For example, what is the influence of salinity on sea ice formation, sea ice melt, and also the impact of sea ice melt on salinity and stratification? Unfortunately, there are not enough data to date to answer these questions. The thing that is needed right now would be a field campaign that really looks at these types of science questions and processes.
I worked with Thomas Meissner (RSS) to examine preliminary versions of SMAP SSS prior to the release of V4. But I have not looked specifically at the Arctic Ocean coverage of RSS V4.
It depends on the type of publication. If it is for validation or inter-comparison, it would be good to have some kind of code that can be re-run with a new version. That's what we did with Jorge Vazquez's Gulf of Mexico study. We also did it for the Arctic. When Thomas sent preliminary versions of RSS SMAP data products, I re-ran my computations. I did this not to update the paper but to inform the calibration/validation team, letting them know how newer versions of their algorithms compare with previous versions and data from other satellites. I think it's good to be prepared, making it easier to help inform the SSS retrieval teams... even if your scientific conclusions don't change.
For example, in our paper when I looked at SSS and sea surface temperature lower than 5°C, we saw a degradation in the comparison between SSS and in-situ data. That could potentially help to define the threshold – or give more confidence in data higher than 5°C. Also, this type of study gives SSS retrieval teams information about the thresholds for sea ice concentration, above which they eliminate data. At the moment, it's hard to directly compare Arctic Ocean data because they are computed in different ways. Each product developer chose their threshold numbers. Perhaps a study like this can help them to refine or better justify their threshold numbers.
I would say yes, of course. It is good as a scientist to be also involved with the algorithm part of how a product is made. If I can help with that, it is gratifying. These developers are making products for scientists, so they need feedback. If the whole community works together, it just makes sense.
The Arctic Ocean is a challenging area that is changing a lot. We have shown that satellite-derived salinity is a measurement with good quality in this region, something we didn't have before. We still have a lot to learn and that's challenging in terms of science, technology, and SSS product improvement. For future campaigns, we need to look at how to improve technology to really understand the Arctic. These are new science questions that are waiting to be answered. That's very exciting.