- HOME
- SCIENCE
- HIGHLIGHTS
- DATA & MAPS
- DATA FOR YOU
- MEETINGS
Salinity data have been used to understand not only oceanography but a broad range of topics. Over 700 publications have been amassed since satellites began measuring salinity over a decade ago.
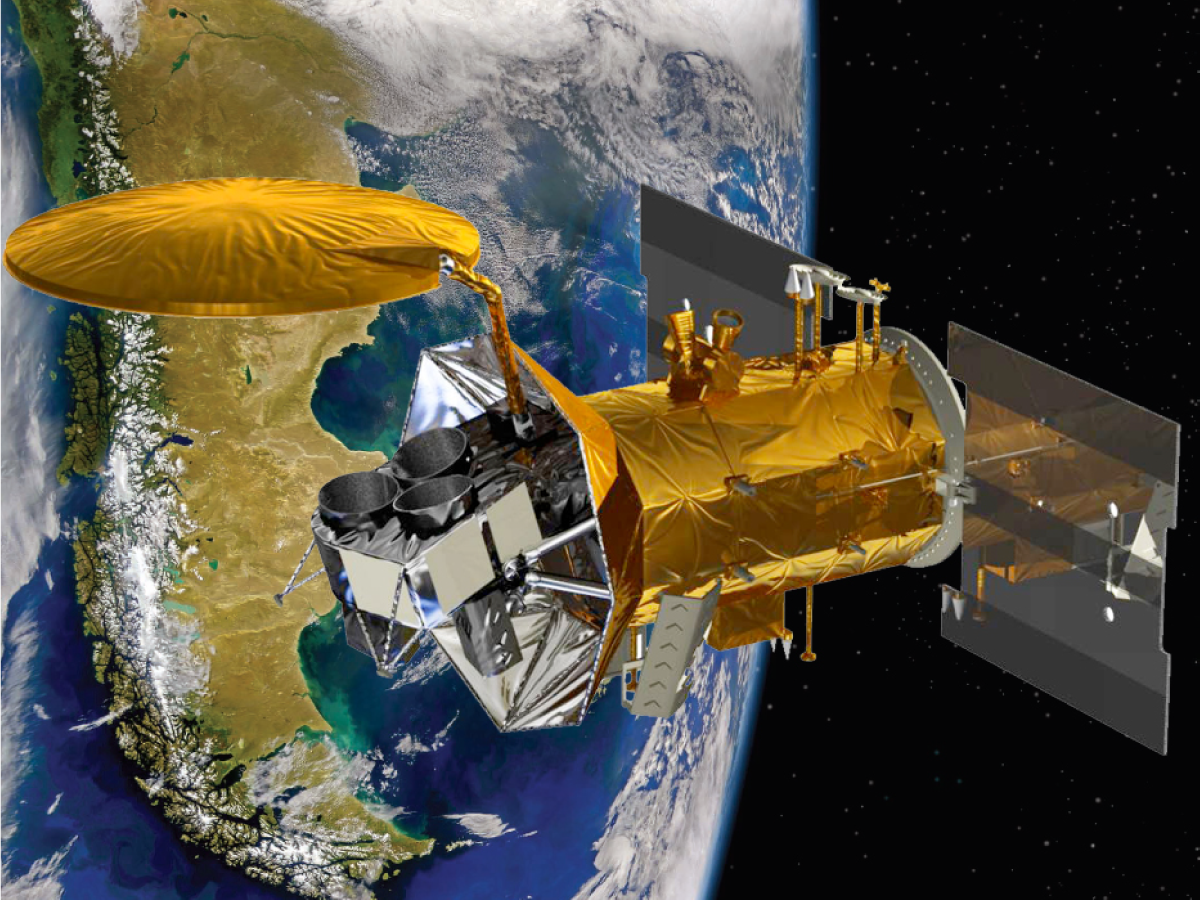
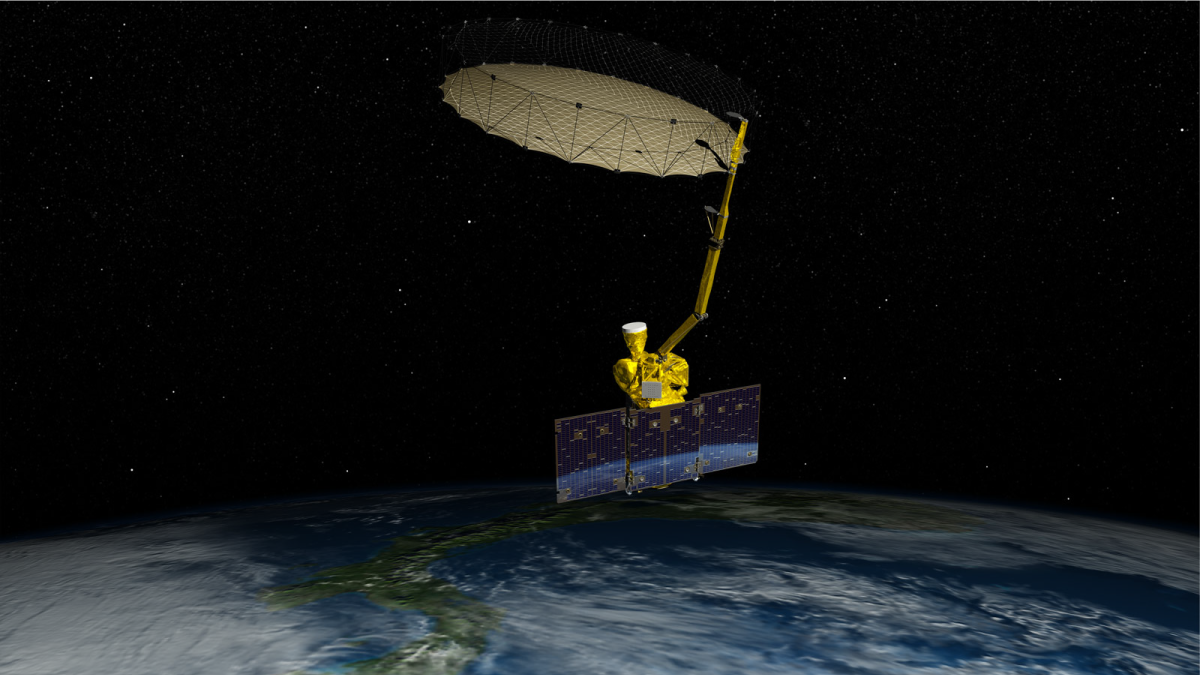
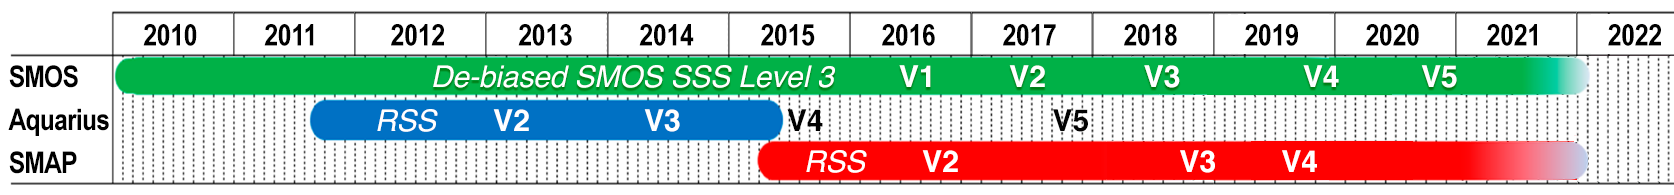
There have been three spaceborne sensors that measure sea surface salinity (SSS), each with the same frequency (1.4 GHz, L-band) but with different technologies:
Accurately detecting SSS is an ongoing research activity. This has resulted in continuous improvement in products as new data versions are released.
| SMOS | Aquarius | SMAP | |
|---|---|---|---|
| Agency | European Space Agency | NASA | NASA |
| Antenna type | Microwave Imaging Radiometer using Aperture Synthesis (MIRAS) | Stationary; 3 beams; 100% reflective | Spinning; 99% reflective (1% emissive) |
| Global coverage / Repeat orbit | ~4 days / 18 days (sub-cycle) | 7 days / 7 days (exact) | 3 days / 8 days (exact) |
| Spatial resolution | ~50 km | ~150 km | ~40 km native |
| Comments | Strong land-sea emissivity contrasts have hampered SSS retrievals. Methodologies to mitigate systematic errors have improved data product quality over time (e.g., SMOS Debiased V4). | Onboard scatterometer provided internal wind correction. This helped achieve a high overall SSS accuracy (0.13 psu). | SMAP data are spatially averaged to larger footprints to reduce noise. Visit "SMAP Processing" section for more detailed information. |
When determining which SSS data to use, here are some key questions to consider...
SMOS has the longest continuous coverage of these satellites as shown in the timeline. NASA's Aquarius and SMAP data have been acquired using similar technology and processed in similar ways. Both satellites operated simultaneously during mid 2015.
In such cases, gridded (i.e., Level-3) data is likely to be sufficient for your needs.
There are distinct differences among SSS data products associated with coastal and high latitude retrievals. These differences are associated with land contamination and ice contamination. It is important to note, however, that each SSS product deals with such contamination sources differently.
To better understand differences between data products' Corrections and Flags, Filters & Masks, visit SSS Retrieval - It's Complicated.
To see an example of how land contamination affected various SSS products, check out Research Insights – Gulf of Mexico: A River-Influenced System.
To seen an example of how ice contamination affected various SSS products, check out Research Insights – Arctic Ocean.
If yes, then you may prefer to use a rain-filtered Level-3 product (e.g., SMAP data processed by Remote Sensing Solutions, RSS).
Alternatively, if you may want to apply your own quality flags, you will need to use swath (i.e., Level-2) data.
Looking at multiple SSS products from your own research perspective (i.e., doing parallel analysis) may be the best way to determine which data suit your purposes. In addition to providing multi-faceted information about your area of interest, these types of studies have collectively improved SSS retrievals. How? The teams who process SSS data from currently operational missions rely on the research community – for example, multi-satellite studies that identify deficiencies in retrieval algorithms – to help achieve the best data products possible.
Many studies include collocated in-water salinity data as a means of validating SSS data. However, in-water salinity data are not available everywhere. For example, Argo profiling floats are commonly used to validate SSS data. While these instruments accurately capture large-scale salinity in the open ocean, they "under-sample mesoscale variability, coastal oceans and marginal seas, and energetic regions such as boundary currents and fronts" (Vinogradova et al., 2019).
Polar oceans also have a dearth of in-water salinity data, making SSS validation there a challenge. SSS research in key regions such as the Arctic may provide much-needed "alternative validation" where in-water salinity data are sparse.
"Research Insights" from the Gulf of Mexico and Arctic Ocean show how scientists have validated SSS data using data other than Argo.
If yes, then SMOS data can be used because they have a long time series. As a result, they can reliably calculate anomalies from their own data. SMAP, on the other hand, doesn't have a long enough data record to create anomalies from its own data. So, one would use an external data set since SMAP itself doesn't have a long enough time series yet.
Wind speed data from SMAP is especially good for high winds – for example looking at tropical cyclones. The SMAP JPL product retrieves both salinity and winds in their algorithm. The RSS SMAP product does not include winds in their salinity product. RSS SMAP wind is a separate product, which is distributed on their website and documented here.
Highlighted researchers have helped to characterize salinity variability in challenging environments. Not only that, their findings have benefited the research community by informing SSS processing algorithms. Their personal insights and other "tips" may help you to decide which salinity data to use in your own work.