Highlights

Monitoring Total Alkalinity & Ocean Acidification

  • Seascape
    Seascape
  • Smokestacks
    Smokestacks
    36 billion metric tons of CO2 is emitted into our atmosphere each year.
    36 billion metric tons of CO2 is emitted into our atmosphere each year. Approximately one quarter transfers into the ocean, resulting in a 26% increase in acidity since the Industrial Revolution.
  • Tiny phytoplankton, shown here as light blue and green blooms
    Tiny phytoplankton, shown here as light blue and green blooms
    Ocean acidification corrodes coral skeletons and dissolves reefs and shells.
    Ocean acidification - climate change’s equally "evil twin" - corrodes coral skeletons and dissolves calcium carbonate, weakening reefs and shells.
  • Salinity data are key for assessing ocean acidification.
    Salinity data are key for assessing ocean acidification. Routine measurements from space provide global, reproducible data and may be the most efficient way to monitor the ocean surface.
  • Total alkalinity correlates strongly with salinity.
    Total alkalinity correlates strongly with salinity allowing scientists to assess the marine carbonate system over time.
 «» 
1 2 3 4 5

"Ocean acidification ... is a slow but accelerating impact with consequences that will greatly overshadow all the oil spills put together." - Sylvia Earle

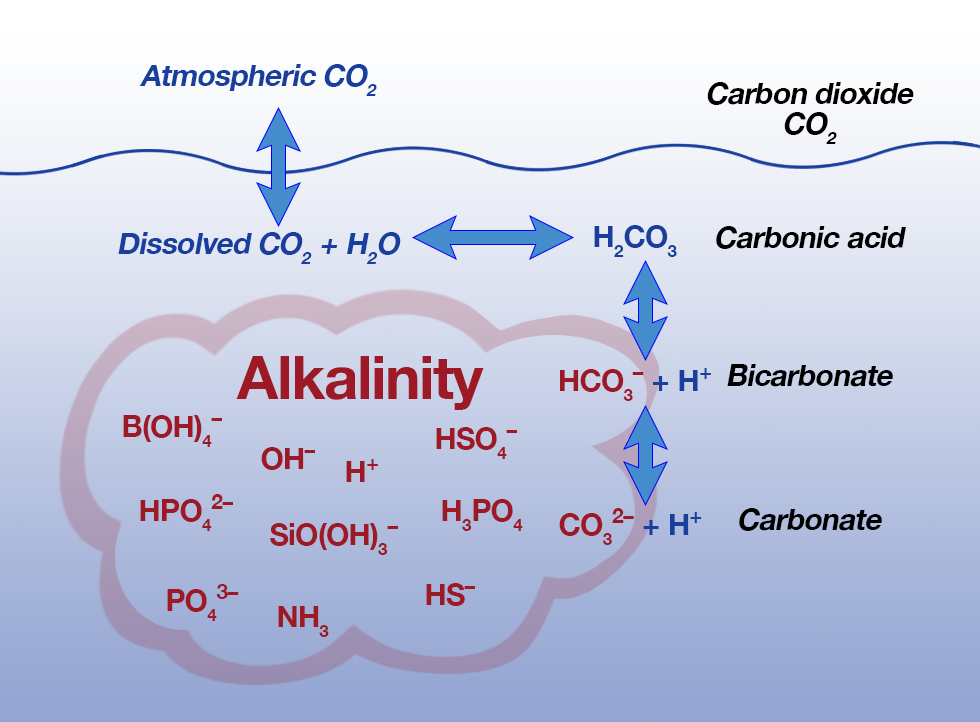
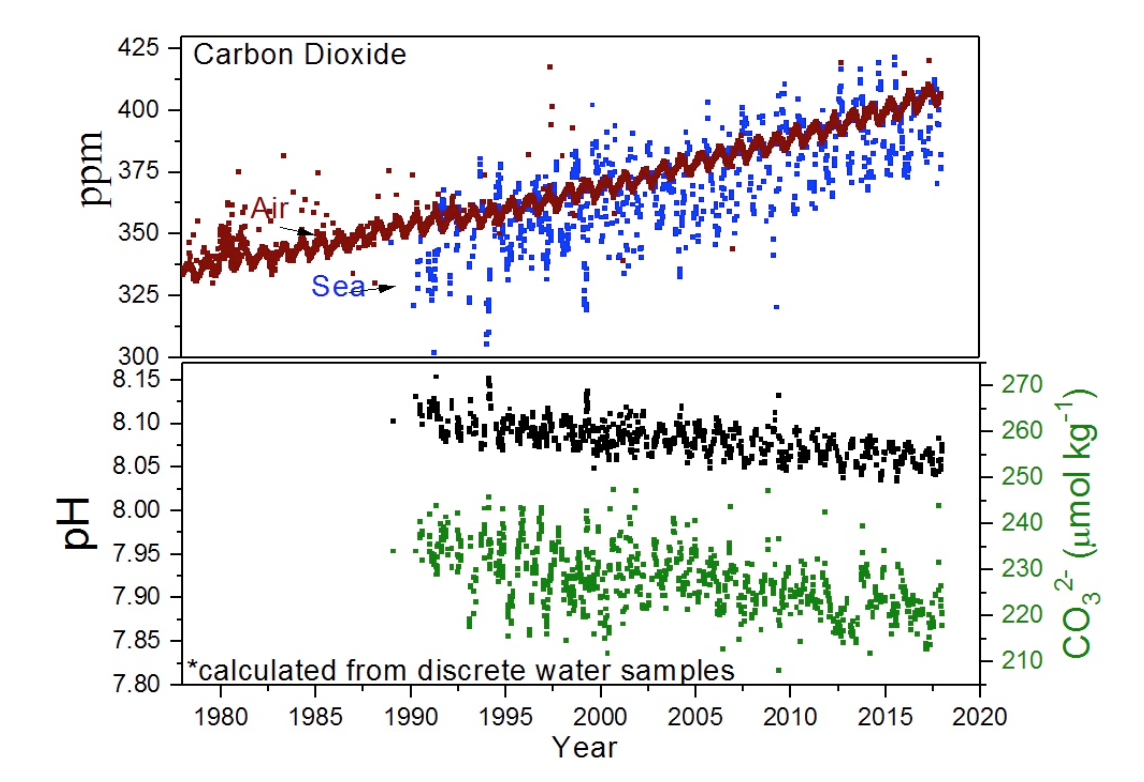
Approximately one quarter of the carbon dioxide (CO2) that we emit into the atmosphere is absorbed by the ocean. CO2 uptake can decrease seawater pH and the concentration of carbonate ions, a process known as ocean acidification (OA).

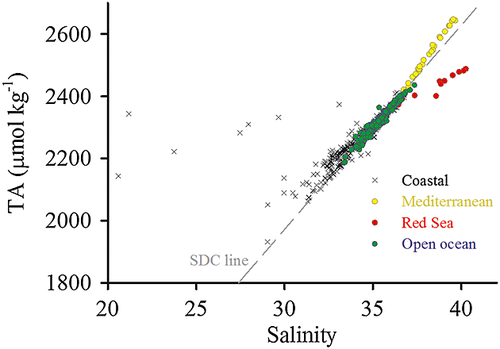
Four key parameters are necessary to assess OA: pH, total alkalinity (TA), dissolved inorganic carbon, and the partial pressure of CO2. All but pH have some dependency on salinity. Scientists can use any two of these parameters to evaluate changes in the ocean's carbonate system.

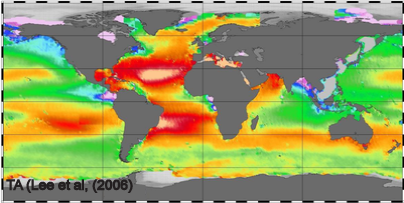
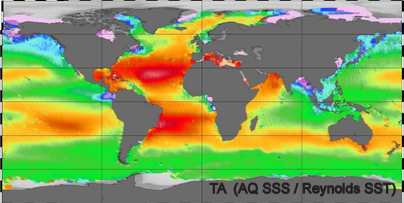
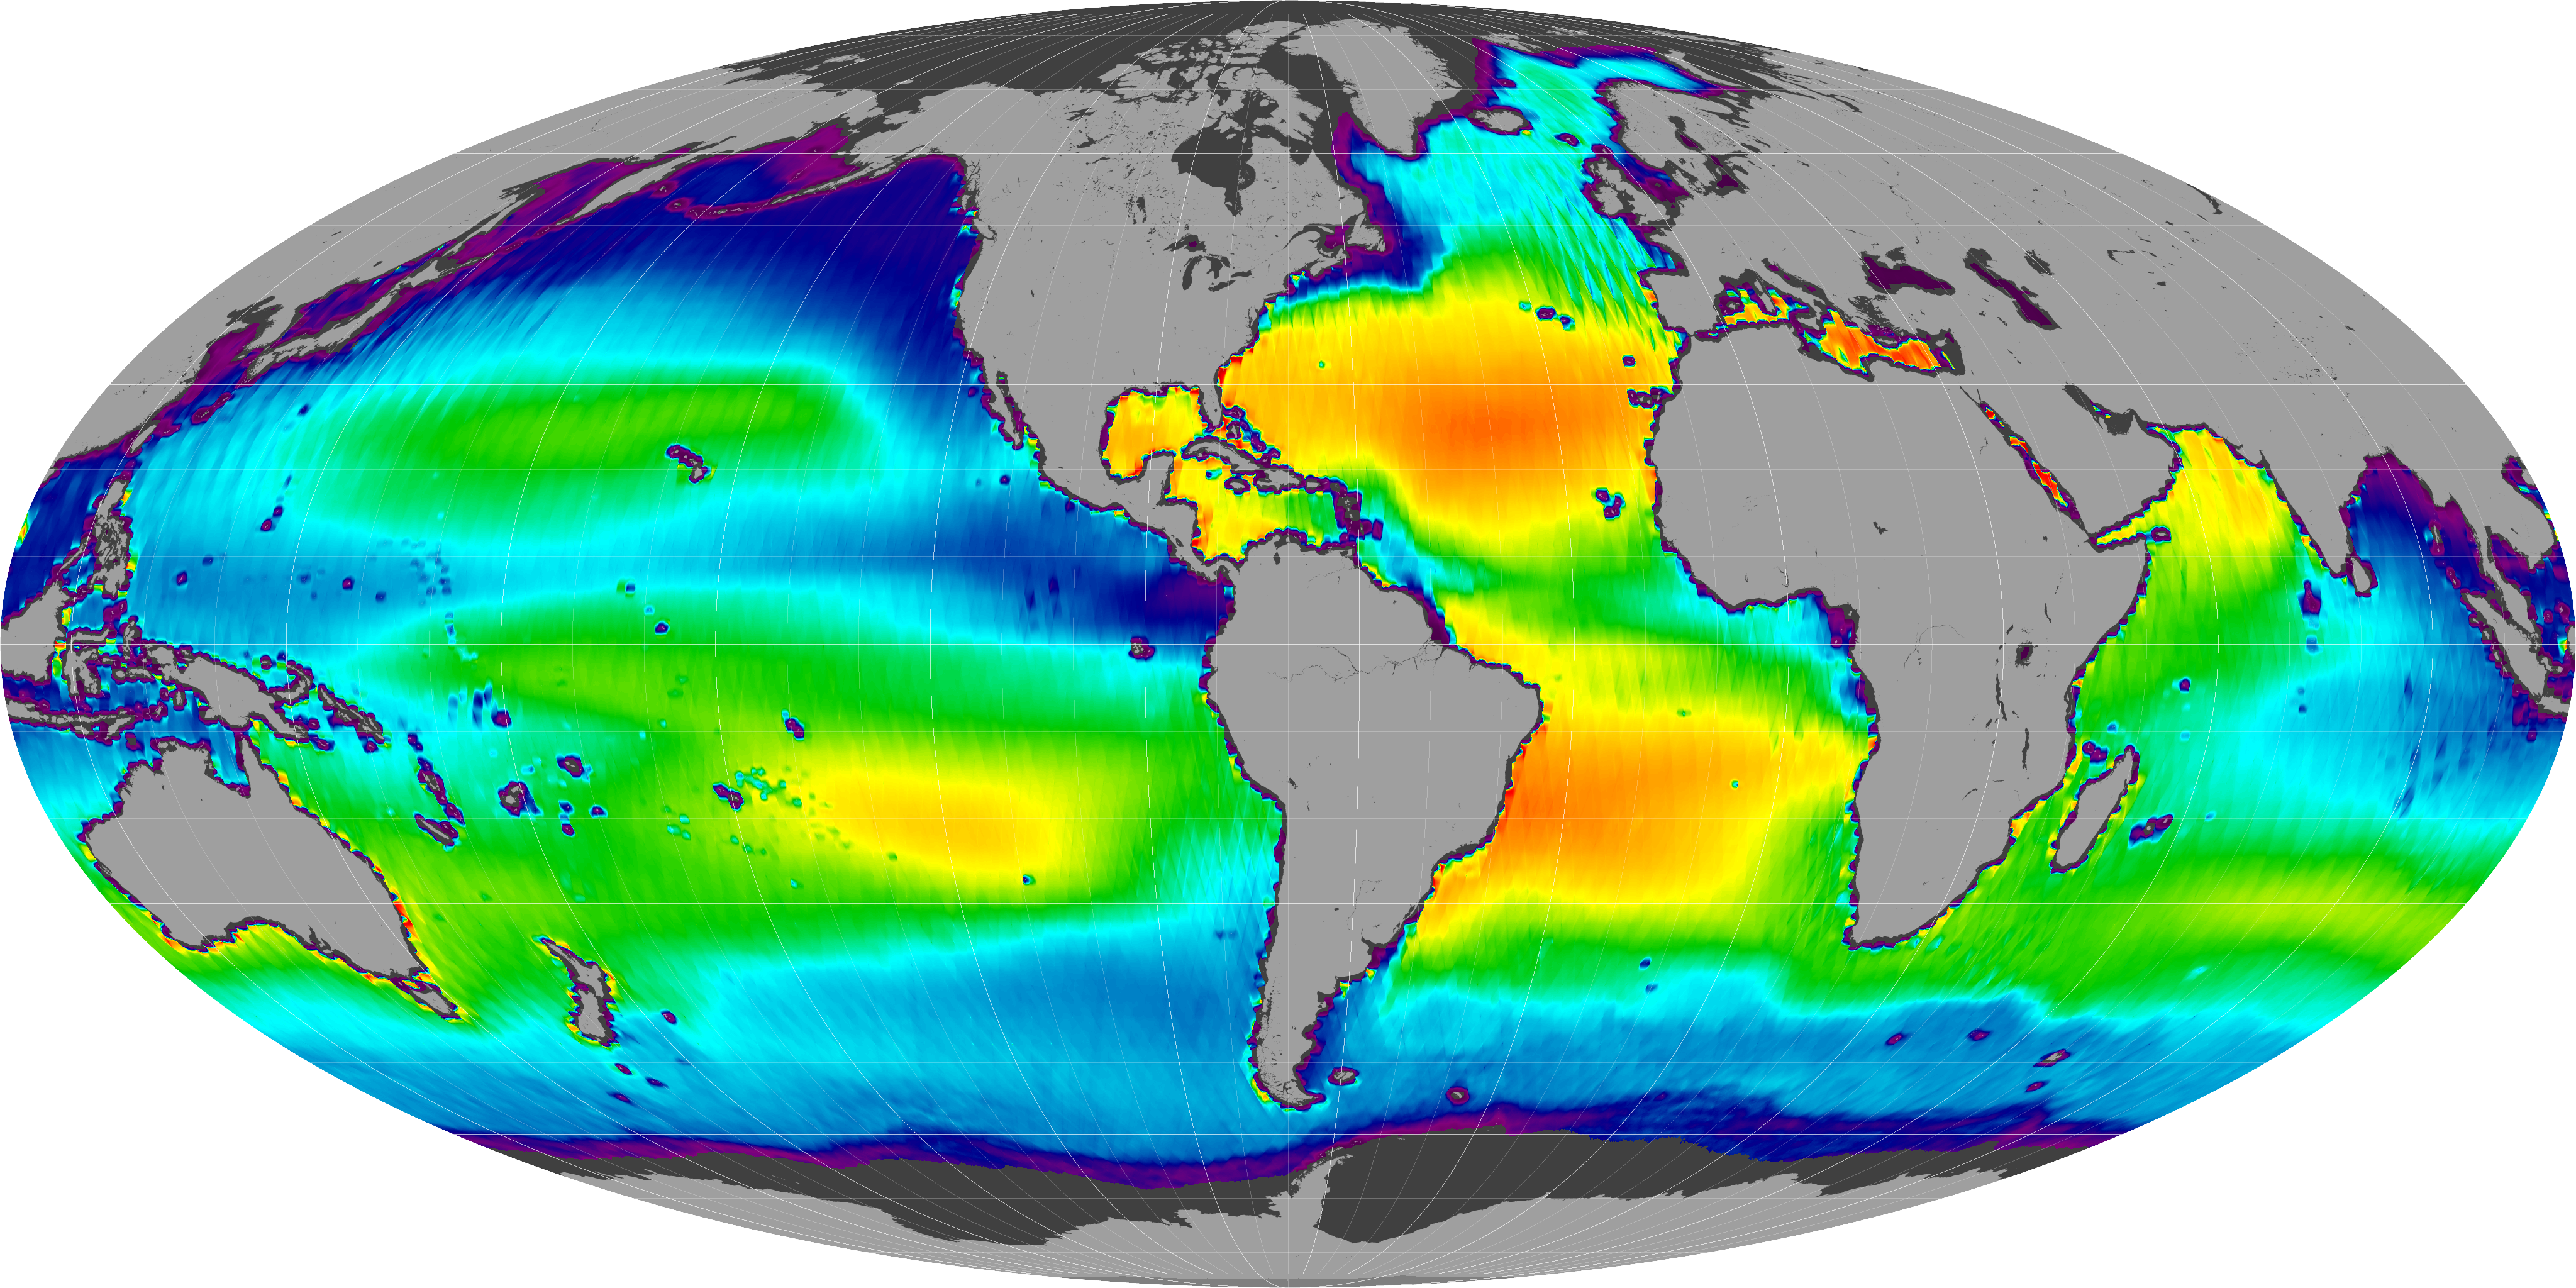
Today’s efforts to monitor OA chiefly rely on in situ data, which provide sparse geographic coverage. Satellites, however, have the potential to provide consistent, global data for OA studies. For example, recent studies show that global TA can be assessed using satellite-derived salinity data.

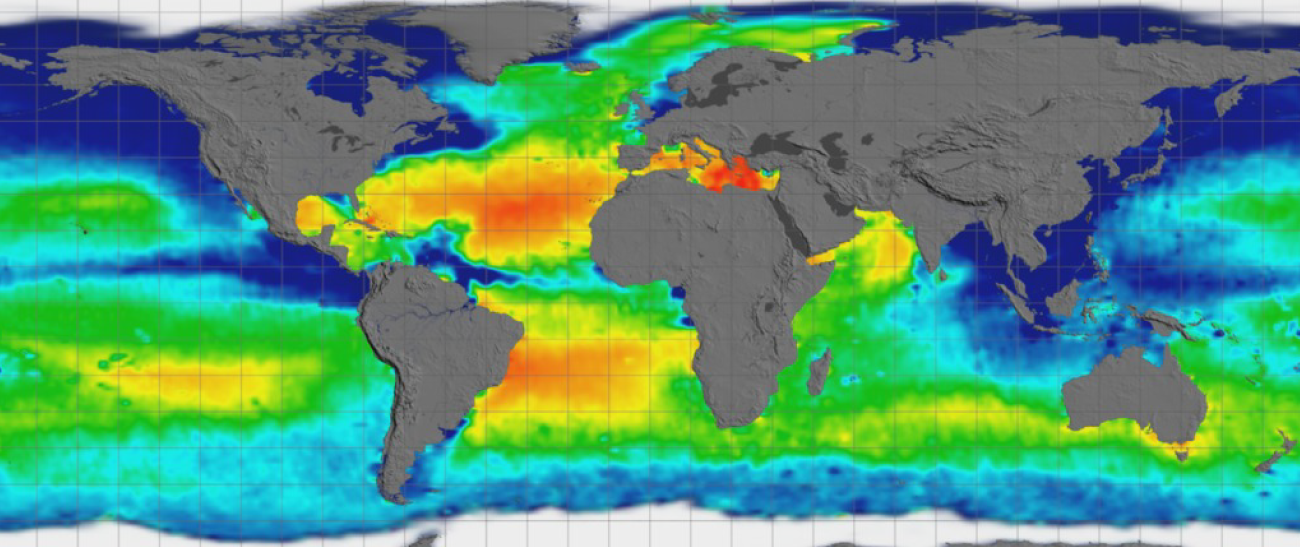
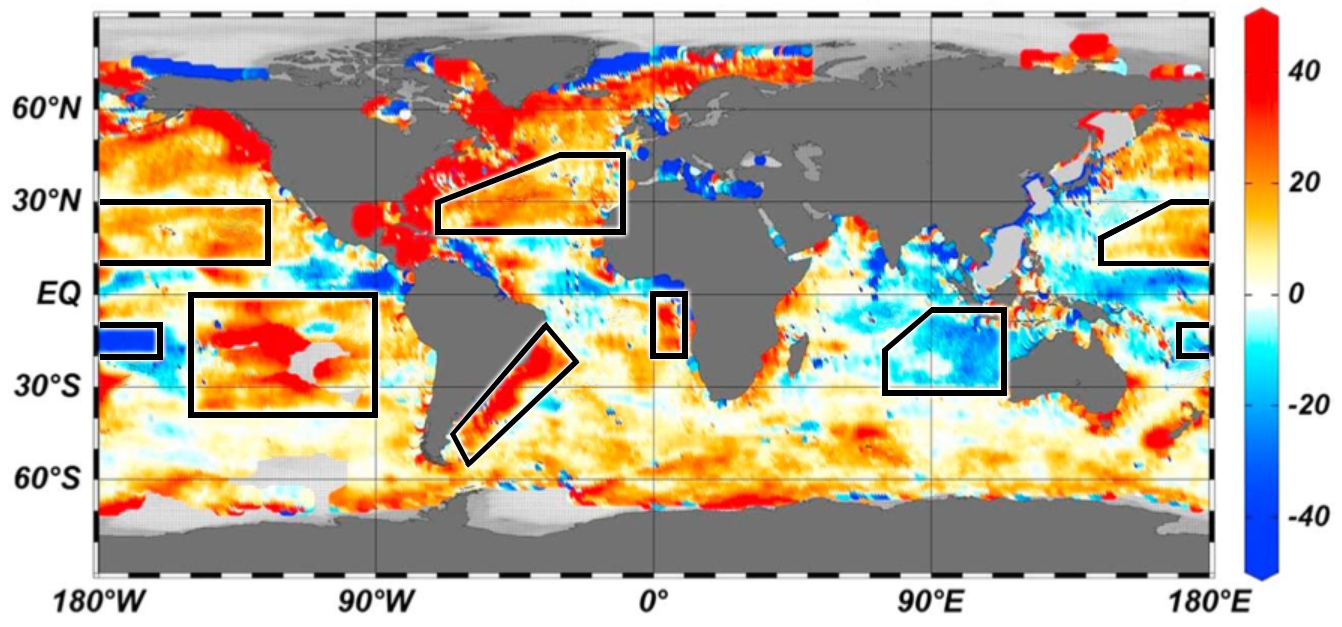
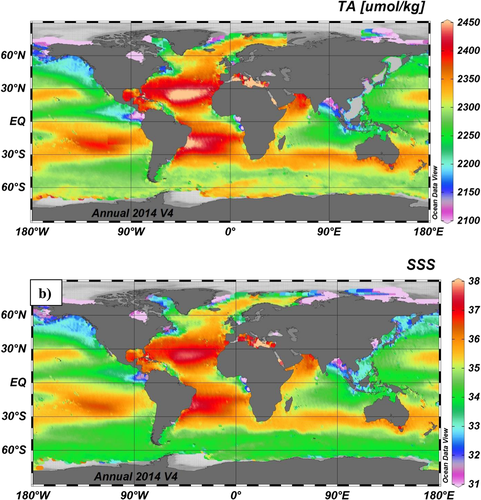
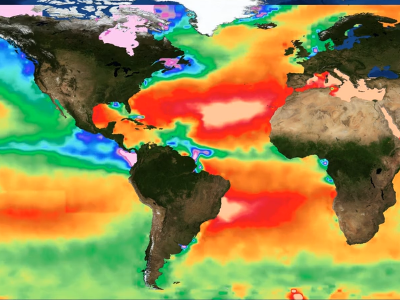
Research shows that OA - and changes in TA - are not occurring uniformly across the ocean. Some regions are acidifying faster than others (Land et al., 2016). Use the tool below – based on a study by Fine et al. (2016) - to see the difference between annual averaged satellite‐derived TA concentrations in 2014 and TA concentrations from the World Ocean Database (1975–1984). This includes increases in subtropical regions, consistent with large-scale trends in Earth's water cycle. Boxes are regions where there have been significant changes in TA. Single-headed arrows signify TA changes of 20-50 μmol/kg. Double-headed arrows signify TA changes greater than 50 μmol/kg.


TA areas Area 1 Area 2 Area 3 Area 4 Area 5 Area 6 Area 7 Area 8 Area 9

Related Publications

  • Lekshmi, K., Bharti, R., and Mahanta, C. (2023). Significance of Physico-Chemical and Biological Parameters on Spatio-Temporal PCO2 Distribution in the Northeastern Indian Ocean, J. Indian Soc. Remote Sens., doi: 10.1007/s12524-023-01780-3.
  • Zhang, Q., Jia, S., Chen, W., Mao, J., Yang, L., Krishnan, P., Sarkar, S., Shao, M., and Wang, X. (2023). Contribution of marine biological emissions to gaseous methylamines in the atmosphere: An emission inventory based on multi-source data sets, Sci. Total Environ., 898, 165285, doi: 10.1016/j.scitotenv.2023.165285.
  • Sims, R., Holding, T., Land, P., Piolle, J.-F., Green, H., and Schutler, J. (2023). OceanSODA-UNEXE: a multi-year gridded Amazon and Congo River outflow surface ocean carbonate system dataset, Earth Syst. Sci. Data, 15(6), 2499-2516, doi: 10.5194/essd-15-2499-2023.
  • Krishna, K., and Shanmugam, P. (2023). Robust Estimates of the Total Alkalinity From Satellite Oceanographic Data in the Global Ocean, IEEE Access, 11, 42824-42838, doi: 10.1109/ACCESS.2023.3271516.
  • Dash, P., Devkota, M., Mercer, A., and Ambinakudige, S. (2021). A Geographic Weighted Regression Approach for Improved Total Alkalinity Estimates in the Northern Gulf of Mexico, Environ. Model. Softw., 148, 105275, doi: 10.1016/j.envsoft.2021.105275.
  • Wirasatriya, A., Sugianto, D., Maslukah, L., Ahkam, M., Wulandari, S., and Helmi, M. (2020). Carbon Dioxide Flux in the Java Sea Estimated from Satellite Measurements, Remote Sensing Applications: Society and Environment, 20, 100376, doi: 10.1016/j.rsase.2020.100376.
  • Ho, D. and Schanze, J. (2020). Precipitation-Induced Reduction in Surface Ocean pCO2: Observations From the Eastern Tropical Pacific Ocean, Geophys. Res. Lett., 47(15), e2020GL088252, doi: 10.1029/2020GL088252.
  • Liao, E., Resplandy, L., Liu, J. and Bowman, K. (2020). Amplification of the Ocean Carbon Sink During El Niños: Role of Poleward Ekman Transport and Influence on Atmospheric CO2, Global Biogeochem. Cycles, e2020GB006574, doi: 10.1029/2020GB006574.
To view all salinity publications, visit the publications page.
Annual averaged surface TA from the empirical relationship of Lee et al. (2006) Annual averaged surface from 2014 Aquarius SSS and Reynolds SST
Use the slider to compare annual averaged surface TA from the empirical relationship of Lee et al. (2006) [left] and 2014 Aquarius SSS and Reynolds SST [right]. TA is highly correlated (~94%) with annual averaged SSS from Aquarius. TA is highest in the high evaporative, salinity maximum cells within subtropical gyres. Low TA/SSS in the southeastern Indian subtropics may be due to increased Pacific to Indonesian throughflow. Credit: Fine et al. (2017). Colorbars: TA (μmol/kg) | SSS (psu).

Featured Publications

Photo mosaic

Routine measurements from space can provide quasi-synoptic, reproducible data for investigating processes on global scales; they may also be the most efficient way to monitor the ocean surface. As the carbon cycle is dominantly controlled by the balance between the biological and solubility carbon pumps, innovative methods to exploit existing satellite sea surface temperature and ocean color, and new satellite sea surface salinity measurements, are needed and will enable frequent assessment of ocean acidification parameters over large spatial scales.

Reference

Land, P.E., Shutler, J.D., Findlay, H.S., Girard-Ardhuin, F., Sabia, R., Reul, N., Piolle, J.-F., Chapron, B., Quilfen, Y., Salisbury, J., Vandemark, D., Bellerby, R., and Bhadury, P. (2015). Read the full paper.

Global SSS averaged from Aquarius

This work demonstrates how large‐scale Aquarius satellite salinity data have provided an unprecedented opportunity when combined with total alkalinity (TA) equations as a function of salinity and temperature to examine global changes in the CO2 system.

Reference

Fine, R.A., Willey, D.A., and Millero, F.J. (2016). Read the full paper.

Some satellites used to study the ocean carbonate system

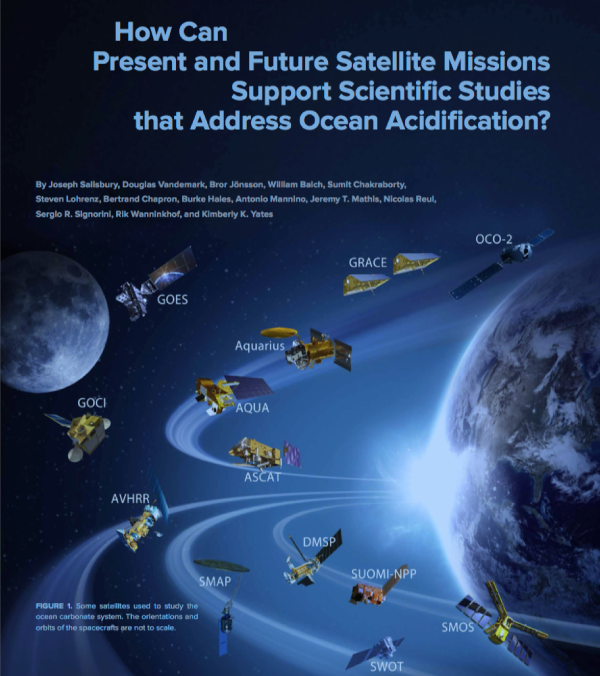
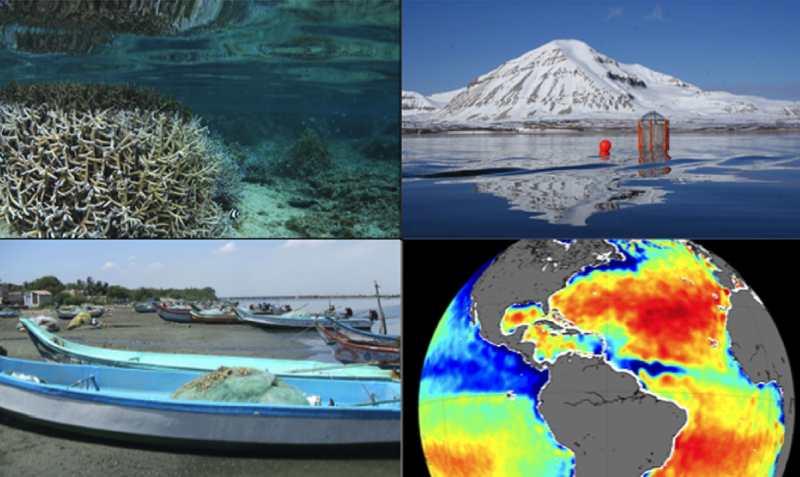
Space-based observations offer unique capabilities for studying spatial and temporal dynamics of the upper ocean inorganic carbon cycle and, in turn, supporting research tied to ocean acidification (OA). Satellite sensors measuring sea surface temperature, color, salinity, wind, waves, currents, and sea level enable a fuller understanding of a range of physical, chemical, and biological phenomena that drive regional OA dynamics as well as the potentially varied impacts of carbon cycle change on a broad range of ecosystems. Here, we update and expand on previous work that addresses the benefits of space-based assets for OA and carbonate system studies.

Reference

Salisbury, J., Vandemark, D., Jönsson, B., Balch, W., Chakraborty, S., Lohrenz, S., Chapron, B., Hales, B., Mannino, A., Mathis, J.T., Reul, N., Signorini, S.R., Wanninkhof, R., and Yates, K.Y. (2015). Read the full paper.