Gallery
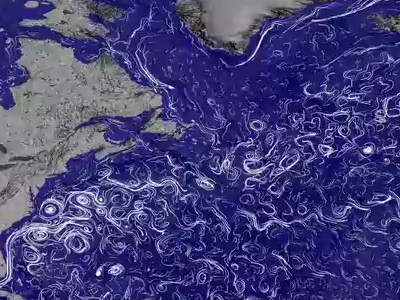
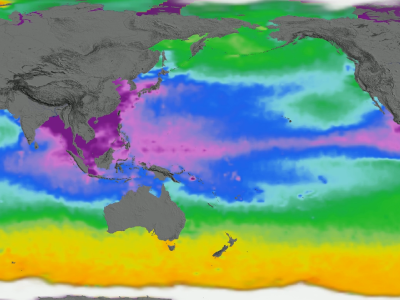
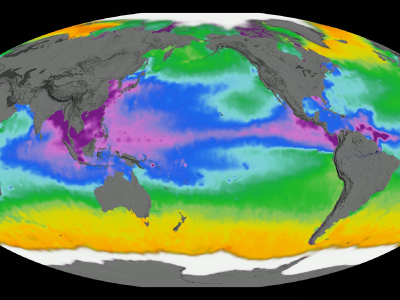
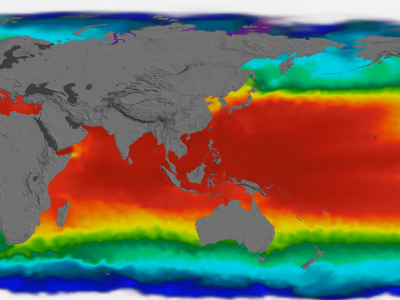
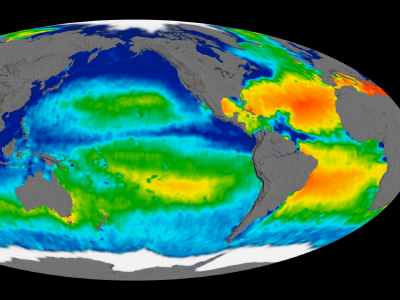
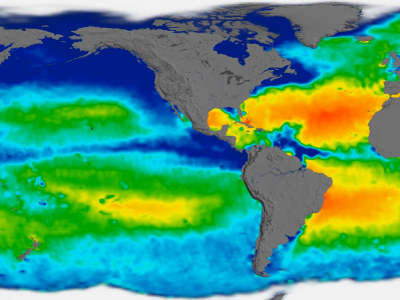
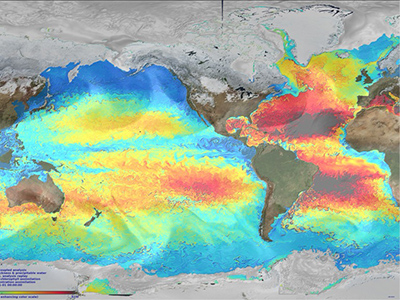
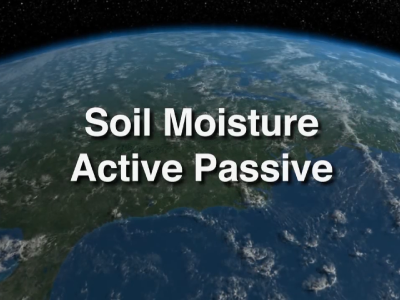
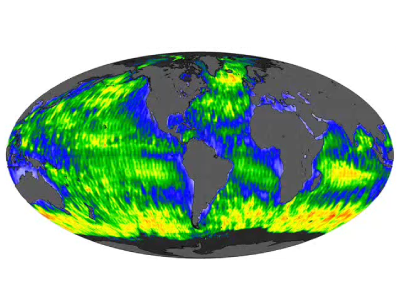
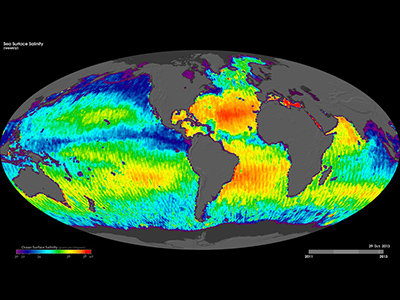
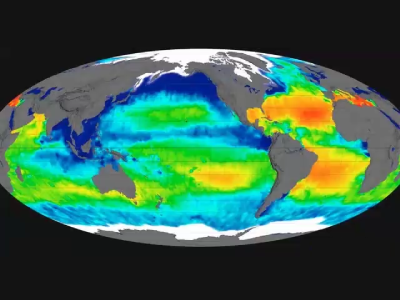
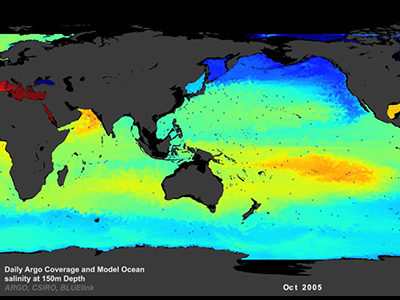
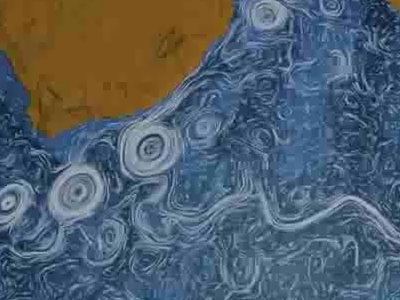
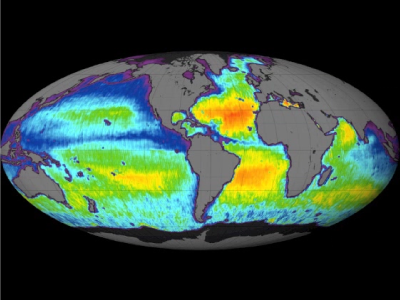
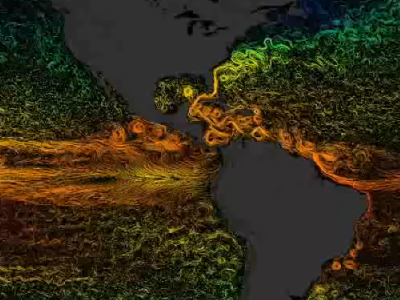
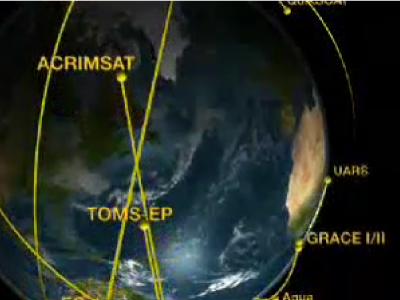
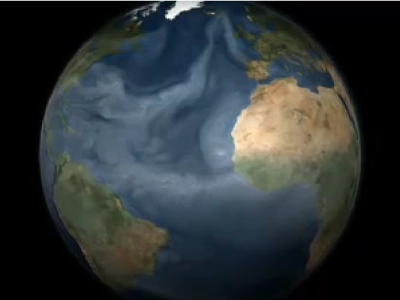
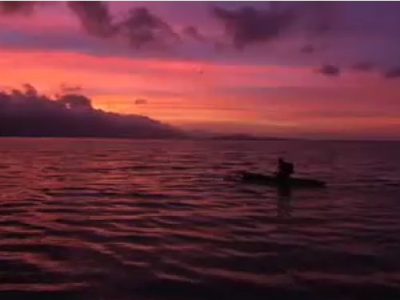
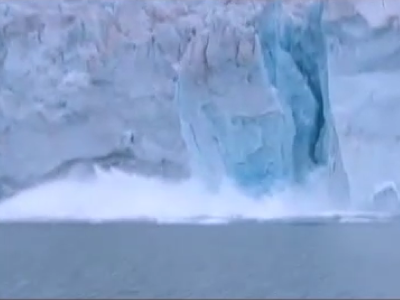
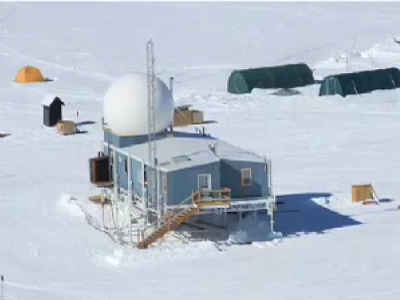
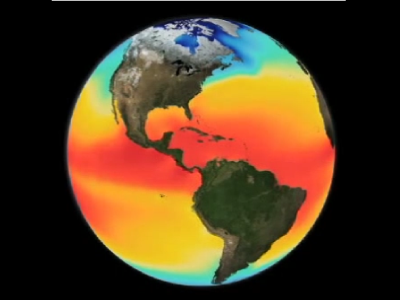
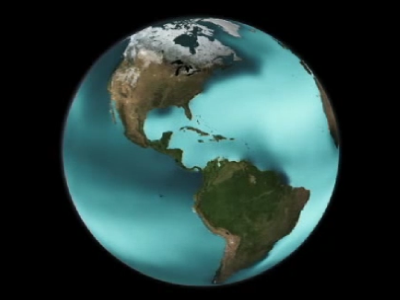
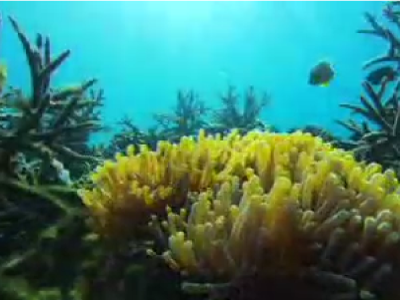
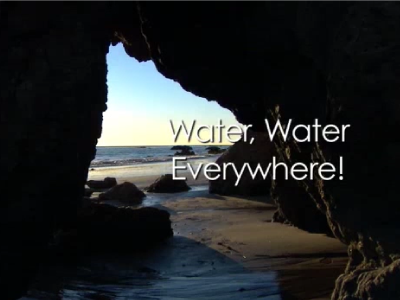
This gallery displays e-brochures, movies, images, storymaps, podcasts, and slideshows relevant to NASA's salinity missions. Click on the images for enlarged views or to play e-brochures, movies and podcasts. Click on the [more] links for additional information.
Saildrone ATOMIC Field Campaign Along-track Measurement Data - SST and SSS Observations (SD1026) [more]
Saildrone ATOMIC Field Campaign Along-track Measurement Data - SST and SSS Observations (SD1060) [more]
Saildrone ATOMIC Field Campaign Along-track Measurement Data - SST and SSS Observations (SD1061) [more]
Saildrone Arctic Along-track Measurement Data [more]
Saildrone SPURS-2 Data Animation [more]
Sea Surface Salinity from SMAP RSS V4 (2015-2019) [more]
Sea Surface Salinity Response to 2018 Atlantic Hurricane Season [more]
SMAP Salinity / Soil Moisture Animation: April 2015 to June 2019 [more]
SMAP Sea Surface Salinity and Soil Moisture Time Lapse [more]
ENSO Teleconnections in South East Asia [more]
SMAP JPL v4.2 SSS Animation [more]
Saildrone Data Animation from Baja Campaign [more]
NASA's SMAP Mission Captures the Land/Ocean Response to 2017 Hurricanes [more]
Earth's Water Cycle [more]
Optimally Interpolated Sea Surface Salinity (OISS) Animation [more]
Oceanic Niño Index [more]
Amazon River Freshwater Discharge [more]
RSS SMAP Sea Surface Salinity 70km 8-Day Global Animation [more]
Tracking El Niño [more]
SMAP in Earth Orbit [more]
Ocean Surface and Deep Currents [more]
Aquarius Sea Surface Density [more]
Aquarius Sea Surface Density (Mollweide) [more]
Aquarius Sea Surface Temperature [more]
Aquarius Sea Surface Temperature (Mollweide) [more]
The Ocean: A Driving Force for Weather and Climate [more]
Ocean Alkalinity, 2011 to 2015 [more]
ENSO Sea Surface Temperature Anomalies [more]
Aquarius Sea Surface Salinity, 2011-2015 (Flat Map) [more]
Aquarius Sea Surface Salinity, 2011-2015 (Mollweide) [more]
Launch, Deploy and Scan Pattern of the SMAP Satellite [more]
Sea Surface Temperature Anomalies and Patterns of Global Disease Outbreaks: 2009-2018 [more]
Aquarius Sea Surface Salinity, 2011-2014 (Rotating Globe) [more]
Aquarius Sea Surface Salinity, 2011-2014 (Flat Map) [more]
Aquarius Soil Moisture (Narrated) [more]
Aquarius Soil Moisture [more]
Seasonal Variation of Wind Speed [more]
KCTS Interview with Gary Lagerloef, Part 1 [more]
KCTS Interview with Gary Lagerloef, Part 2 [more]
KCTS Interview with Gary Lagerloef, Part 3 [more]
KCTS Interview with Gary Lagerloef, Part 4 [more]
KCTS Interview with Gary Lagerloef, Part 5 [more]
Aquarius Sea Surface Salinity Flat Maps 2012 [more]
Changes in Global Sea Surface Salinity [more]
Aquarius Sea Surface Salinity Tour 2012 (Spanish Language) [more]
Aquarius Sea Surface Salinity Tour 2012 (English Language) [more]
Perpetual Ocean [more]
Global View of Sea Surface Salinity From September to December 2011 [more]
Temperature and Surface Currents: Atlantic & Eastern Pacific Ocean [more]
Temperature and Surface Currents: Indian & Western Pacific Ocean [more]
Hyperwall Show: Earth Observing Fleet with Suomi NPP and Aquarius [more]
Thermohaline Circulation Using Improved Flow Field [more]
Aquarius Yields NASA’s First Global Map of Ocean Salinity [more]
Collection of Data Swaths Using the Aquarius Instrument [more]
Large Scale Salinity Distribution Features Measured by Aquarius [more]
The Power of Sea Salt [more]
Launch of Aquarius! (YouTube) [more]
Aquarius Launch Update: Episode 5 [more]
Aquarius Prepares for Launch: Episode 4 [more]
Aquarius Prepares for Launch: Episode 3 [more]
Aquarius Prepares for Launch: Episode 2 [more]
Aquarius: Studying the Salt of the Sea [more]
Ocean Circulation [more]
Aquarius Satellite & Data Pre-launch Beauty Shot [more]
Aquarius [more]
Water Cycle [more]
Climate [more]
Aquarius Prepares for Launch: Episode 1 [more]
Importance of Salinity [more]
Fluids that Moderate Climate [more]
Salinity and Climate [more]
Satellites View Earth in a Different Light [more]
Monitoring Impacts By Satellite [more]
Viewing Phytoplankton From Space [more]
Excitement About Aquarius Launch [more]
Aquarius Satellite Sensor [more]
How Aquarius Works [more]
Oceanographers Will "Catch Up" [more]
Climate Change and the Global Ocean [more]
Getting the Full Picture [more]
Ocean Overturning and Heat Distribution [more]
Viewing Ocean Change by Satellite [more]
Geographic Variation in Salinity [more]
Density Effects [more]
Salt of the Earth: Salinity, Temperature & Density [more]
Salt of the Earth: Ocean Atmosphere Circulation Helps Moderate Climate [more]
Salt of the Earth: Climate Change Impacts on Salinity [more]
Melting Ice, Rising Seas: Global Warming & Ocean Change [more]
Melting Ice, Rising Seas: Studying Change in Ice Sheets & Glaciers [more]
Melting Ice, Rising Seas: Ice Melt & Sea Level Rise [more]
Melting Ice, Rising Seas: Coastal Impacts of Sea Level Rise [more]
Melting Ice, Rising Seas [more]
Salt of the Earth [more]
Water, Water Everywhere: Condensation & Precipitation [more]
Water, Water Everywhere: Sun Fuels Evaporation [more]
The Water Cycle [more]
Water, Water Everywhere: Water Cycle & Climate Change [more]
Water, Water Everywhere! [more]
Keeping Up With Carbon [more]
Thermohaline Circulation - The Great Ocean Conveyor Belt [more]
Sea Surface Density [more]
Sea Surface Temperature [more]
Sea Surface Salinity [more]
The Carbon Cycle [more]
ARGO Float Animation [more]
Indian Ocean Dipole [more]
Indian Ocean Dipole Positive Phase [more]
Indian Ocean Dipole Negative Phase [more]
Indian Ocean Dipole Neutral Phase [more]
Strong Positive Indian Ocean Dipole Event, May-Dec 2019 [more]
Global Heating Supercharging Indian Ocean Climate System [more]
Aquarius Mission Composite Image: 25-Aug-11 to 05-May-15 [more]
Radiometer Measurement Geometry of the Aquarius Sensor [more]
SMAP Measurement Geometry Showing Radiometer and Low-Resolution Swath [more]
Where is the Water on Earth? [more]
Aquarius Mission Composite Image: 25-Aug-11 to 05-May-15 [more]
Major Constituents of Seawater [more]
SMAP Antenna Beam Footprint [more]
SMAP Instrument [more]
Madden-Julian Oscillation [more]
SMAP Sea Surface Salinity - June 12, 2015 [more]
Aquarius at AGU 2015 - Hyperwall [more]
Long Term Composite Image: 01-Jan-12 to 31-Dec-12 [more]
Indian Ocean Dipole "Positive" Phase [more]
Aquarius/SAC-D Logo [more]
Long-Term Composite Image: 25-Aug-11 to 07-Jul-12 [more]
Aquarius Satellite Maps Ocean Salinity Structure [more]
Aquarius/SAC-D Tracks [more]
Brightness Temperature vs. Sea Surface Temperature [more]
Ground Station in Córdoba, Argentina (View at Night) [more]
Long-Term Composite Image: 28-Aug-11 to 29-Nov-11 [more]
Average Salinity From Historical Ship and Buoy Data [more]
Comparison of Historical and Simulated Sea Surface Salinity [more]
The Earth Science Satellites of NASA (2011) [more]
First Light Map [more]
Launch of Aquarius/SAC-D Satellite [more]
Aquarius/SAC-D Satellite in Launch Fairing [more]
Aquarius Instrument at Vandenberg Air Force Base [more]
Aquarius/SAC-D Inside Environmental Test Chamber [more]
Aquarius/SAC-D Outside Environmental Test Chamber [more]
Long-Term Composite Image: 25-Aug-11 to 04-Jun-12 [more]
Aquarius Instrument [more]
Aquarius/SAC-D - Stowed and Deployed Configurations [more]
Evaporation and Precipitation in the Western Hemisphere [more]
Annual Mean Surface Salinity Data [more]
Visualization of Aquarius/SAC-D Solar Panels [more]
Surface Salinities of the Oceans [more]
Aquarius/SAC-D in INVAP Clean Room [more]
Aquarius Detects Possible Effects of Tropical Storm Lee [more]
Aquarius Instrument in JPL Clean Room [more]
Water Cycle Diagram [more]
Sea Surface Temperature of the Gulf Stream [more]
Artist Depiction of Aquarius/SAC-D Observatory in Orbit [more]
Global Sea Surface Salinity Values [more]
HMS Challenger [more]
Historical Surface Salinity Measurements [more]
Water Cycle Effects on Ocean Salinity [more]
Evaporation Minus Precipitation 1981-2002 [more]
Aquarius/SAC-D Observatory Diagram [more]
Schematic Diagram of Aquarius in Deploy-ready Mode [more]
Geophysical Contributions to Satellite Salinity Measurements [more]
CONAE and NASA Components of the Aquarius/SAC-D Observatory [more]
Aquarius Instrument Diagram [more]
Aquarius Prototype, PALS [more]
Mission Operations Center, Córdoba, Argentina [more]
Command and Telemetry Antenna, Córdoba, Argentina [more]
Aquarius Prototype in C-130 [more]
Visualization of the Aquarius/SAC-D Spacecraft [more]
Aquarius PI Gary Lagerloef and the SAC-D Service Platform [more]
Average Evaporation Minus Precipitation [more]
Passive-Active L- and S-Band (PALS) Sensor - Aircraft Validation [more]
Global Sea Surface Temperature Values [more]
Scenes from the JPL Clean Room [more]
Observatory Integration and Testing [more]
Shipment to Sáo José dos Campos, Brazil [more]
Final Environmental Testing [more]
Transport to Vandenburg AFB [more]
Observatory Integration [more]
Launch Activities [more]
Aquarius Presentations [more]
Aquarius Pre-Launch Workshop [more]
JPL Salinity Workshop [more]
Aquarius Scientist Receives International Award [more]