Salinity in rivers, lakes, and the ocean is conceptually simple, but technically challenging to define and measure precisely. Historically, salinity was measured from thermosalinographs located on board research vessels or ships of opportunity, and on moorings. Today, this key parameter is also measured from satellites, which provides a continuous view of sea surface salinity and how it changes over time. These resources look at the history of salinity observations.
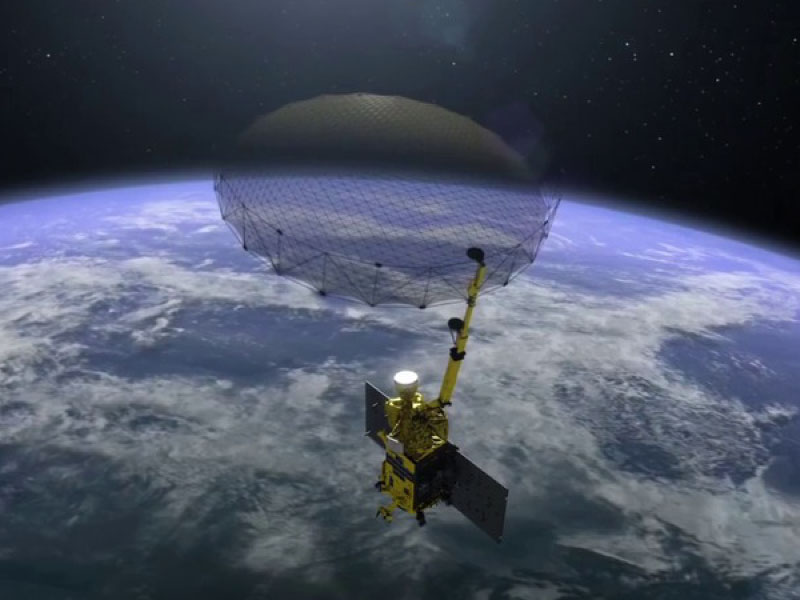
Salinity is normally measured from a ship. We measure the conductivity of seawater. Well, we can get a estimate of the conductivity of the seawater from space. As the conductivity changes, the microwave emissions change and we put a very sensitive radiometer in space that measures the microwave emissions from the sea surface and we can back that out into a salinity estimate. It's a very daunting remote sensing measurement. We have to have a very sensitive radiometer and we have all sorts of conflicting issues: the roughness of the surface, the temperature of the surface, the galactic background radiation. Read more here.
Once you start turning on the instruments, there are a number of different calibration processes to complete. There are the orbital parameters and the pointing of the instrument. You want to make sure you're pointing in the right direction, and to calibrate the antenna patterns and the antenna temperatures. All of this is first tested on the ground and in the lab. Then, in space, we have to make sure everything functions the way it was designed to. So, calibrating the stability of the radiometer is still ongoing at this point with less than a month of the data sets in. The first of the data sets began to come in almost a month into flight, around 21 July 2011. Now, we want to take a little more time and better understand how the instrument works.
Once we finish the calibration, then we start the validation. We have many independent surface measurement sources to verify calibration. Salinity readings taken by ships, buoys, robotic vehicles, and drifting vehicles in the ocean are vital to the process. With their conductivity sensors, they measure salinity at the surface, and then we compare the two. One is touching the water and one is four hundred miles in space. We are still in this calibration phase and working out some issues. Yesterday was our "first light" (Aquarius completed its first global mapping on Sept. 23, 2011). There are still some issues we need to work out. We need to understand the scatterometer data better. In first light, we only used the information from the radiometer. We're still working to calibrate the scatterometer so we can better utilize all the information. There's a variety of information you can feed into the retrieval program. So right now, we call it quick-look processing.
What we're measuring is natural radiation from the ocean surface. Everything has energy because it's not at absolute zero temperature and thus gives off radiation. An example of that is night vision. The military is able to see people at night not because they look at light but because they look at infrared radiation. The people are giving off energy at lots of frequencies. One of those (frequencies) is slightly below the optical and is called "infrared" and we use night vision to see that.
Another example of natural radiation is the heating of your electric stove. You turn on the burner, it warms up, and it glows red because it has gotten more energy and the added energy changes its frequency distribution. Now because it's so hot, it actually gives off more energy in the optical frequencies that our eyes are sensitive to. But it is also putting off radiation at all frequencies. So if we looked at it with night vision, then it would be overwhelmingly bright. And if you looked at it in the microwave frequency range (e.g., 1.41 GigaHertz, GHz like the Aquarius instrument measures), it would also look very bright. So it's giving off energy.
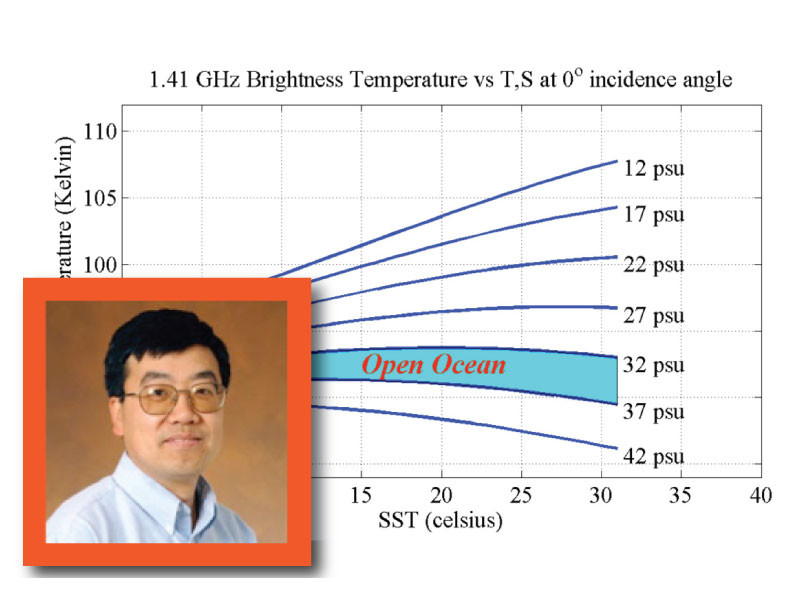
We talk about that energy as an equivalent temperature. So you can say that if the temperature is higher, there is more energy and if the temperature is lower, then there is less energy. The scale isn't so important because it depends on the frequency (e.g., the same temperature scale wouldn't work for the night vision scale at the infrared frequencies). But we have a scale called "Brightness Temperature" that is measuring the amount of energy that's being given off by the ocean surface at a fixed temperature.
So in the graph above right (click image to enlarge), go along the horizontal axis and stop at a sea surface temperature (SST) equal to 20 degrees Celsius (see blue box). If you go up to the blue line labeled "12 PSU" (practical salinity units, PSU), you'll see a purple arrow. If you read across to the vertical axis (i.e., follow the purple dashed line to the left), you see that lower salinity water gives off higher energy because the Brightness Temperature is about 104. At that same SST of 20 degrees Celsius, higher salinity water (see red arrow at 42 PSU), gives of relatively lower energy (i.e., follow the red dashed line to Brightness Temperature on the vertical axis at about 88).
Aquarius has a very precise instrument that tells us how much energy is coming off the ocean surface and we express that as a "Brightness temperature". If the brightness temperature is higher, then the seawater is fresher (i.e., less salty; see purple arrow / dashed line above). If the brightness temperature is lower, then the seawater has more salt (i.e., red arrow / dashed line). The graph shown at right was published in 1977. So an important new area of research is to develop a set of curves that are very carefully calibrated so we know exactly what energy corresponds to what salinity. And the instrument we use is very precise and makes these measurements accurately and consistently.