Maps: Overview

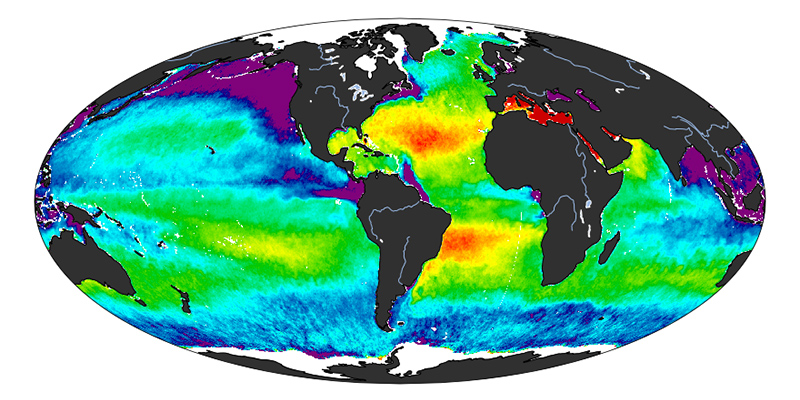
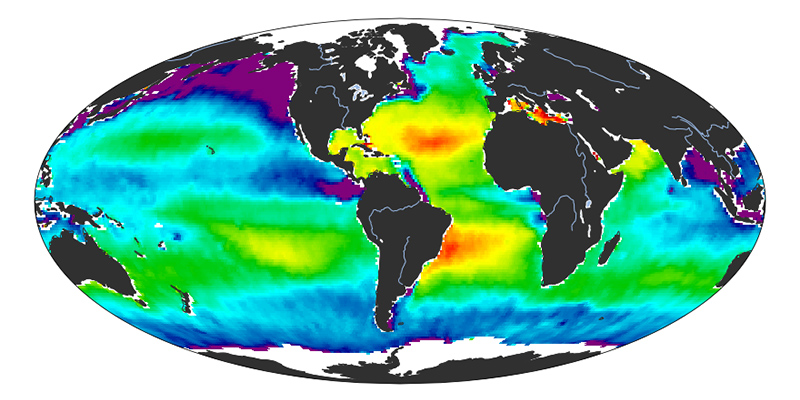
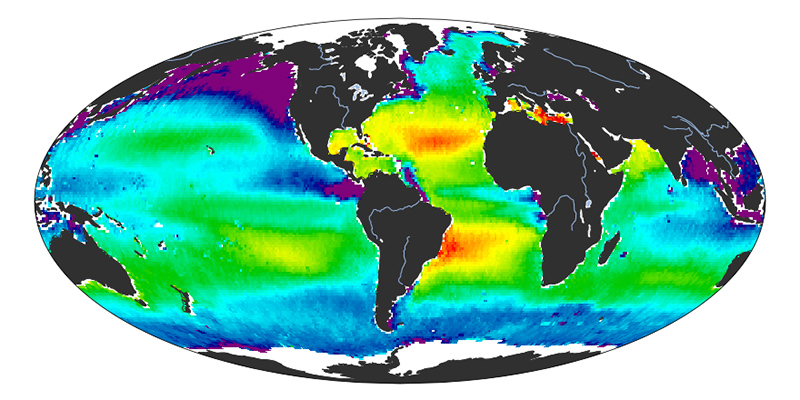
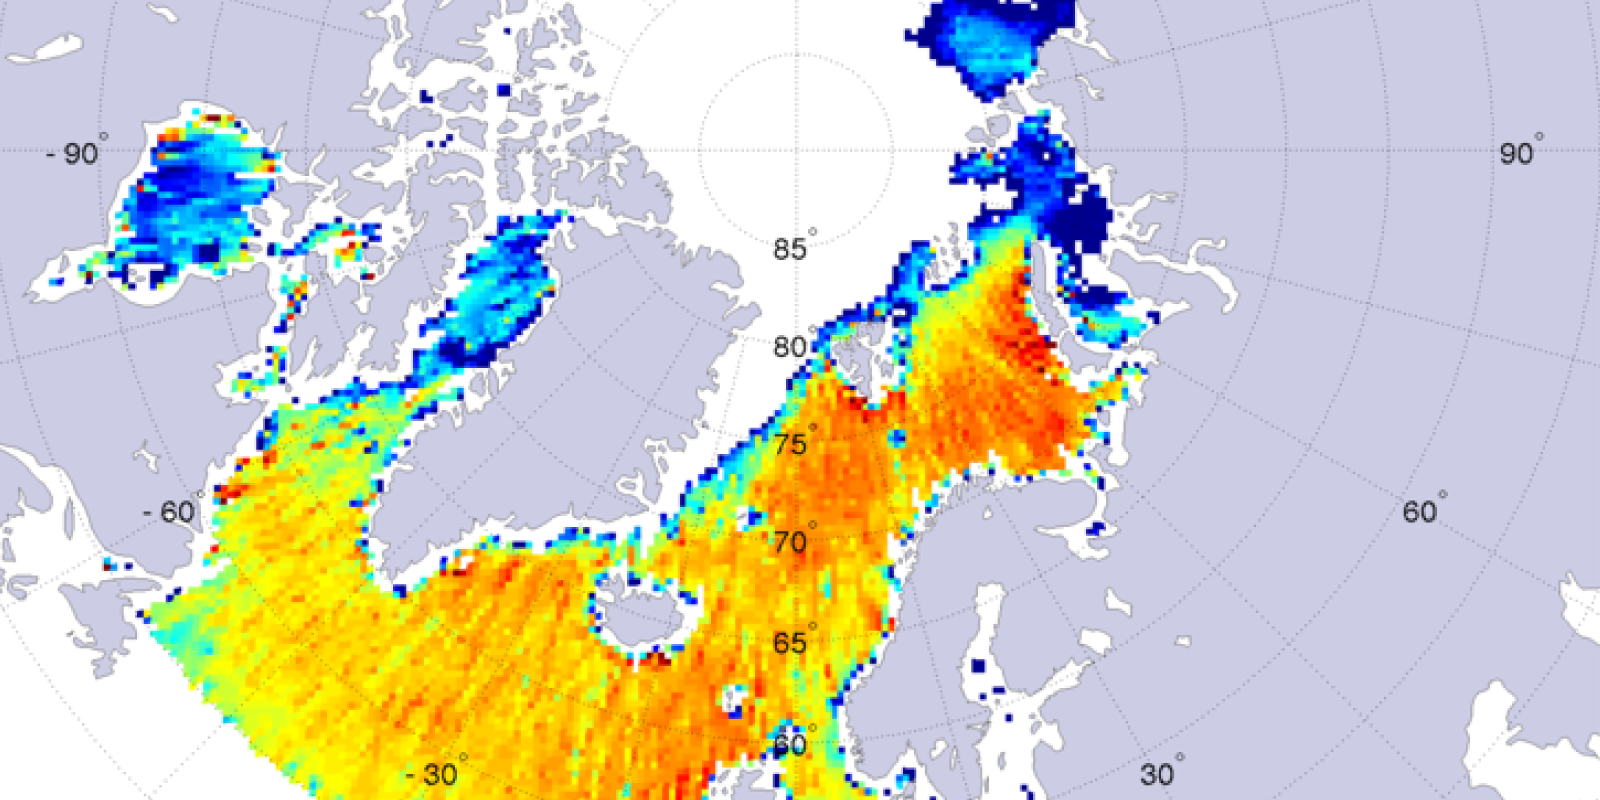
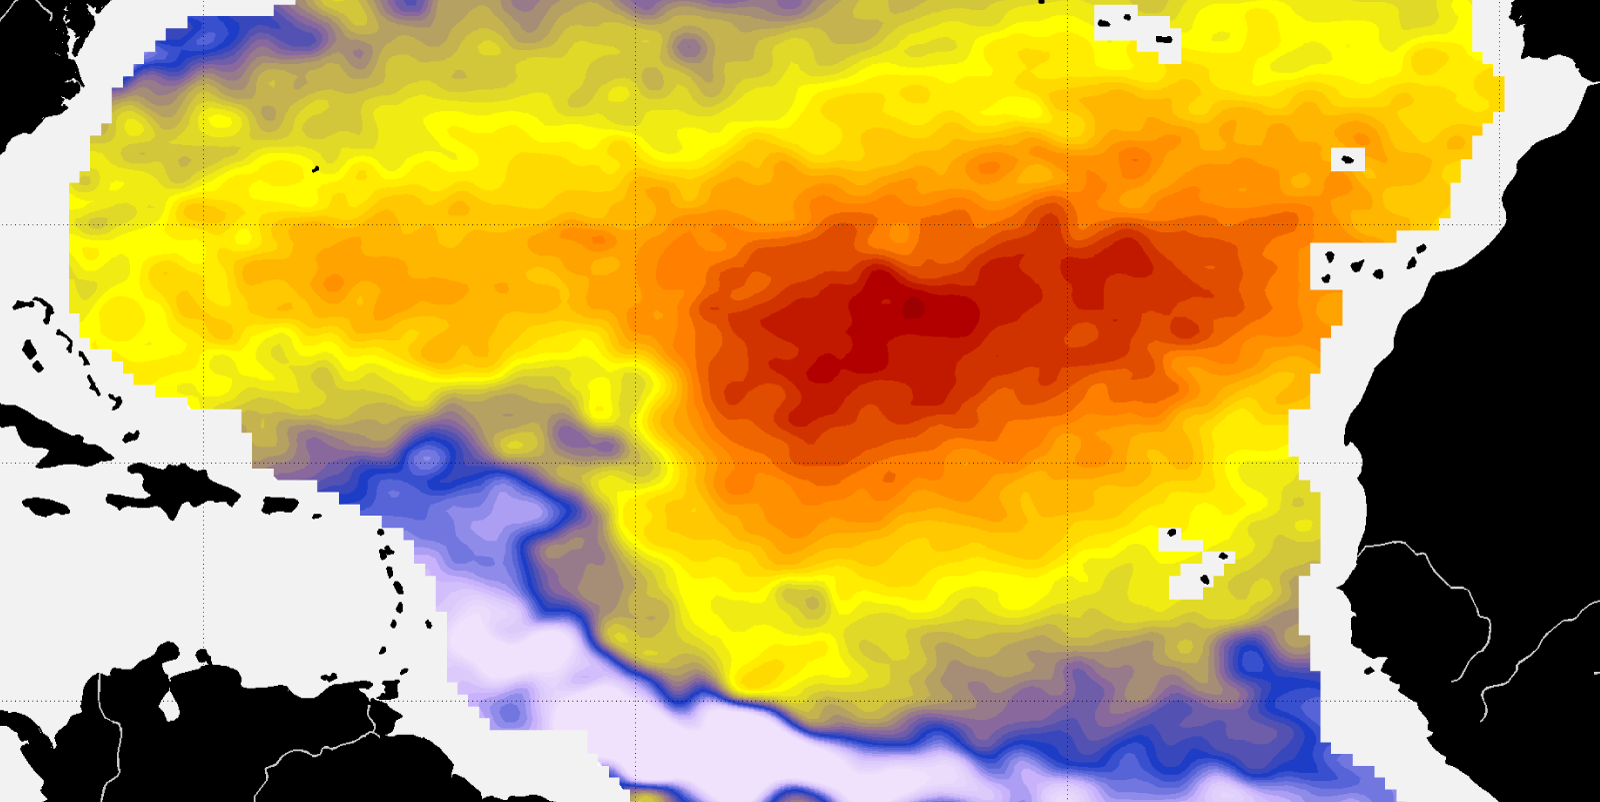
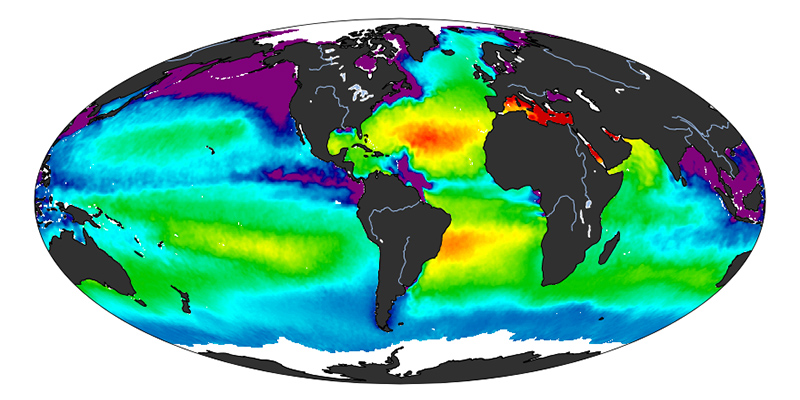
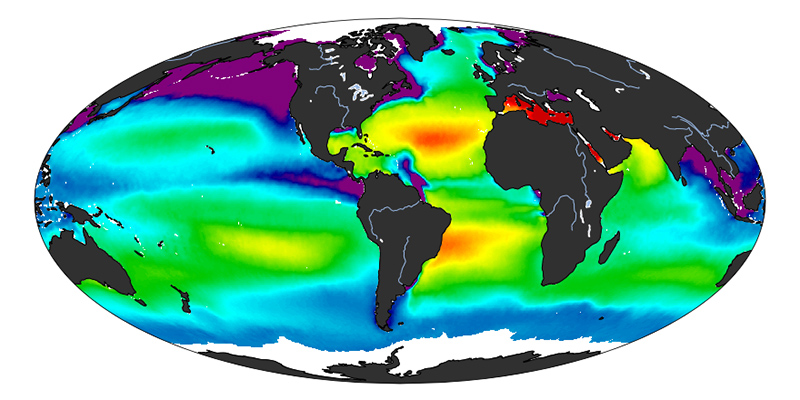
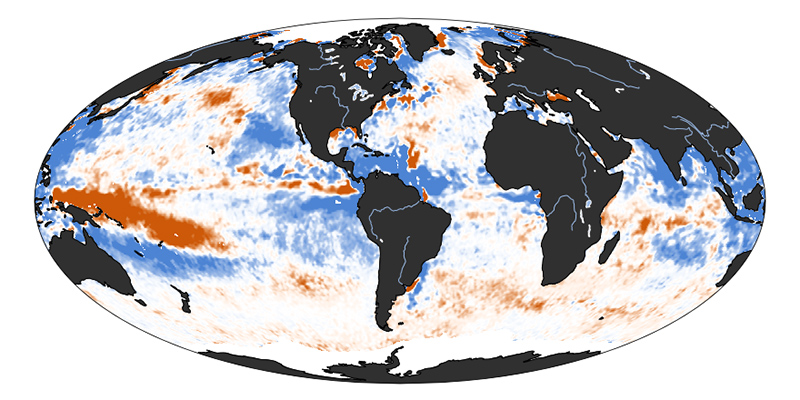
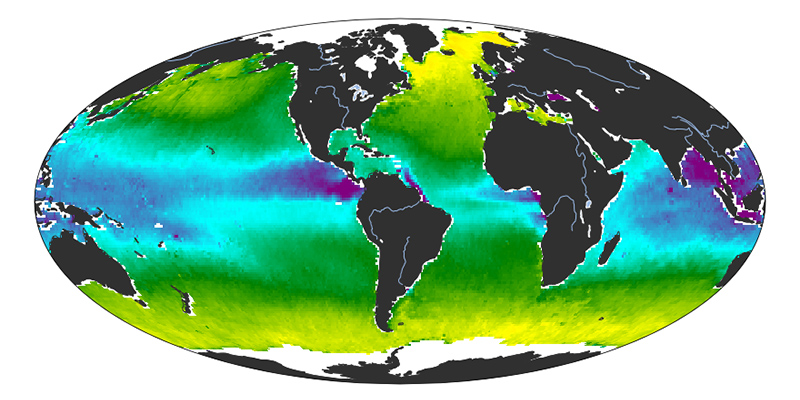
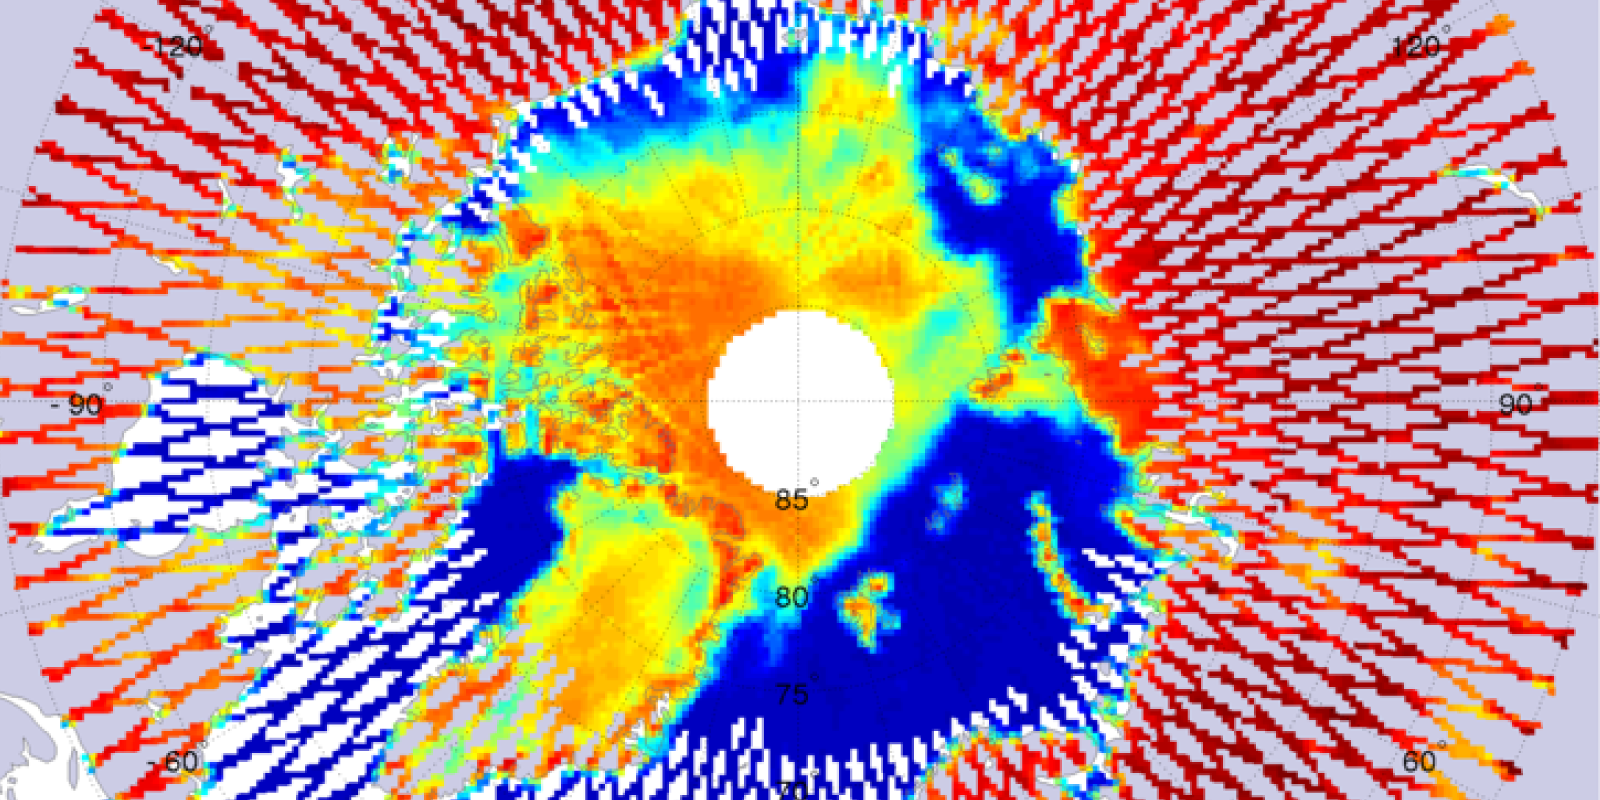
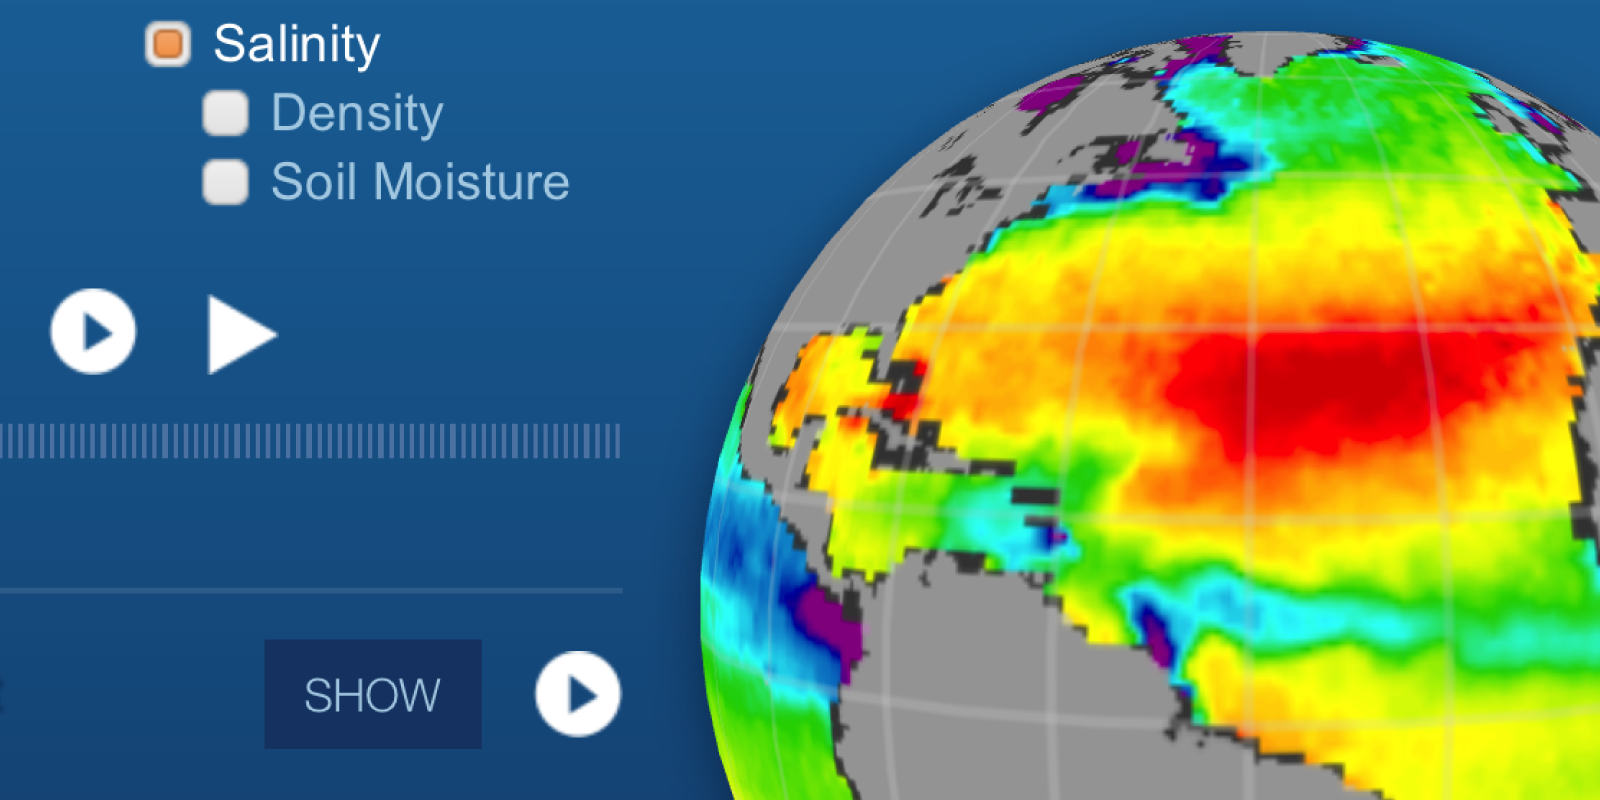
Scientists involved with the Aquarius/SAC-D mission have a wealth of data at their fingertips, owing in large part to the immense amount of instrumentation aboard the satellite. The main focus of the mission was to detect changes in ocean surface salinity on a global scale, as shown on monthly images produced by NASA's Goddard Space Flight Center. Scientists are also able to measure salinity variance and brightness temperature at high latitudes, which are depicted in weekly maps.

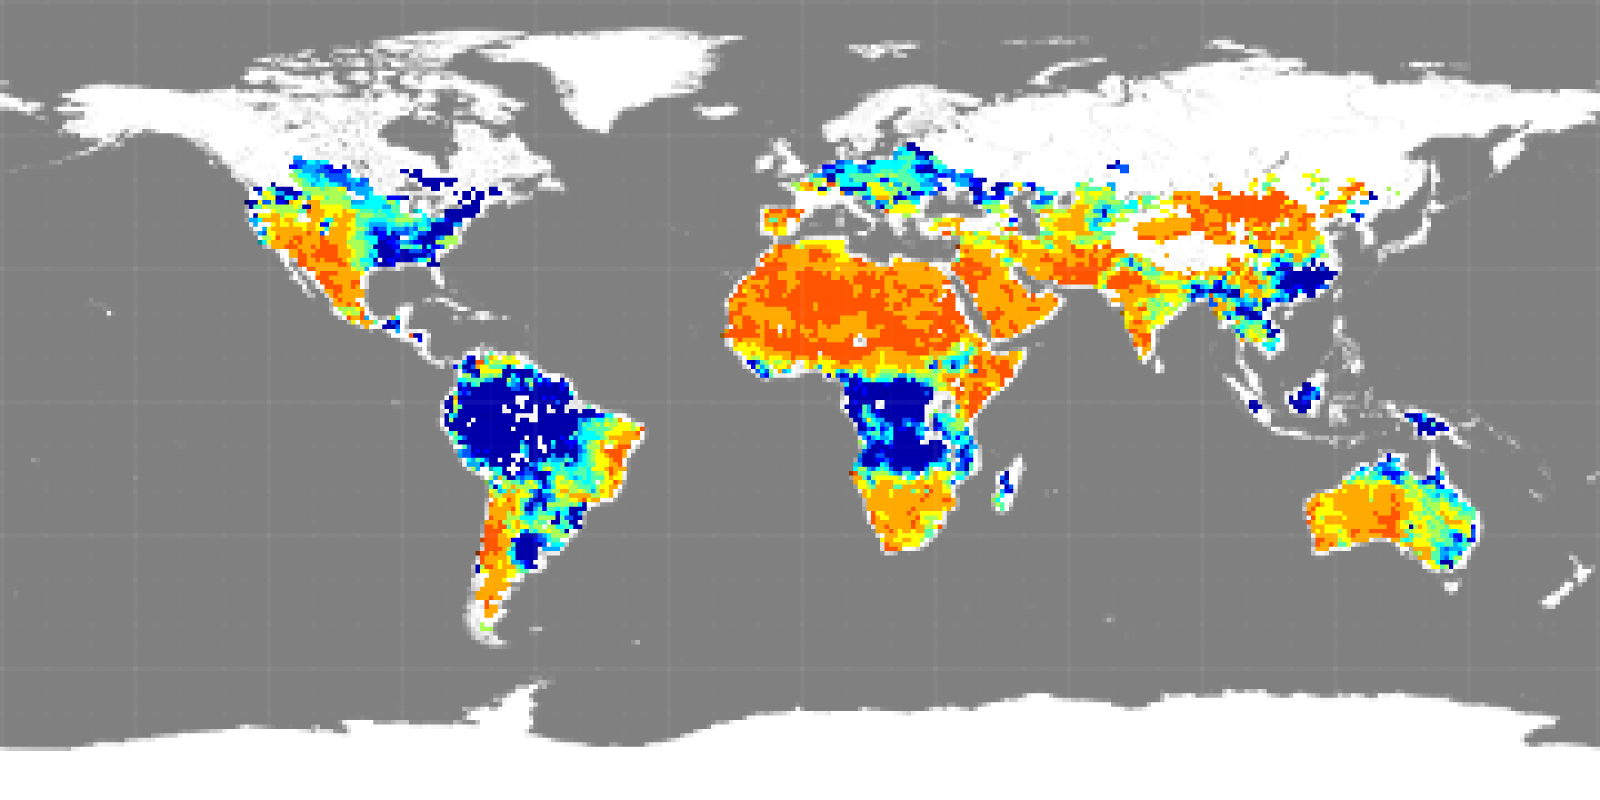
The Soil Moisture Active Passive (SMAP) platform and mission were launched on January 29, 2015. The onboard instruments began observations in April 2015. Although SMAP was designed to measure soil moisture, its L-band radiometer is also used to measure sea surface salinity, thus extending the data record of the Aquarius salinity mission.

Sea Surface Salinity (SSS)

Global sea surface salinity
SMAP Sea Surface Salinity
SMAP's monthly global salinity measurements continue the time series that began with Aquarius in August 2011, using the same frequency as Aquarius (L-band; 1.41 GHz) (309 images)
Global sea surface salinity
Aquarius Sea Surface Salinity
These maps show mission composite, monthly, seasonal, and annual data and based on the latest algorithms developed by the Aquarius Calibration/Validation Working Group (162 images)
Global sea surface salinity maps averaged by month and season
Aquarius Climatology
These maps show global sea surface salinity averaged by month and season. They are based on the latest algorithms developed by the Aquarius Calibration/ Validation Working Group (16 images)
Sea surface salinity at high latitude
Aquarius High Latitude SSS
These weekly maps were made using Aquarius sea surface salinity retrievals and show sea surface salinity at latitudes higher than 50° N (392 images)
Map of sea surface salinity in the North Atlantic Ocean
Aquarius North Atlantic SSS
These weekly gridded maps are based on the optimum interpolation (OI) analysis of Aquarius sea surface salinity data for the North Atlantic Ocean (195 images)

Aquarius/SMAP Optimum Interpolation

Global sea surface salinity map
Sea Surface Salinity
The SSS optimum interpolation (OI) product combines observations from NASA's Aquarius/SAC-D and Soil Moisture Active-Passive (SMAP) satellite missions into a continuous and consistent multi-satellite SSS data record (144 images)
Global sea surface salinity climatology map
SSS Climatology
Climatology data computed over a 9-year period from September 2011 to August 2020 (12 images)
Global sea surface salinity anomaly map
SSS Anomaly
Computed anomaly data relative to OI SSS product-based monthly climatology data (144 images)

Radiometer and Scatterometer RFI

Global radiometer RFI map
SMAP Radiometer RFI
These monthly maps show the percentage of SMAP samples that were flagged as radio frequency interference (RFI) and removed during data processing (104 images)
Global radiometer RFI map
Aquarius Radiometer RFI
These maps show global monthly RFI at 1.413 GHz, the frequency of the three radiometers on board Aquarius (45 images)
Global scatterometer RFI map
Aquarius Scatterometer RFI
These maps show global monthly RFI at 1.26 GHz, the frequency of the scatterometer on board Aquarius (45 images)

Sea Surface Density, Brightness Temperature, and Soil Moisture

Map of sea surface density
Aquarius Density
These monthly maps are derived from Aquarius sea surface salinity and ancillary sea surface temperature using TEOS-10 equation of state (47 images)
Brightness temperature at the south pole
Aquarius Brightness Temperature
These weekly maps show the Aquarius (L-Band, about 1.4 GHz) brightness temperature measurements recorded at vertical polarization at latitudes higher than 50° (392 images)
Map of soil moisture
Aquarius Soil Moisture
These monthly maps of soil moisture are derived from L-band horizontally polarized brightness temperature observations (47 images)

Interactive Globe

Globe
View monthly maps of sea surface salinity, density, and soil moisture on this interactive globe.