Aquarius Maps: Soil Moisture

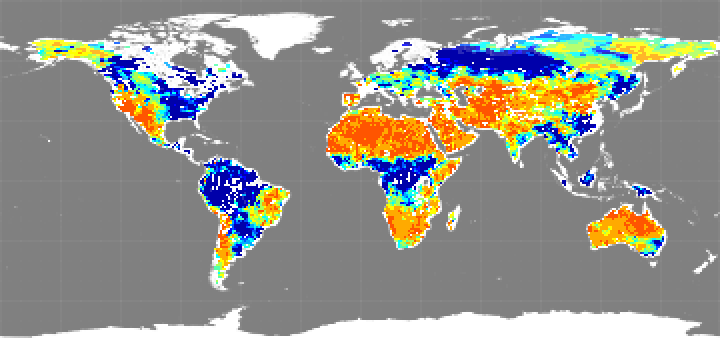
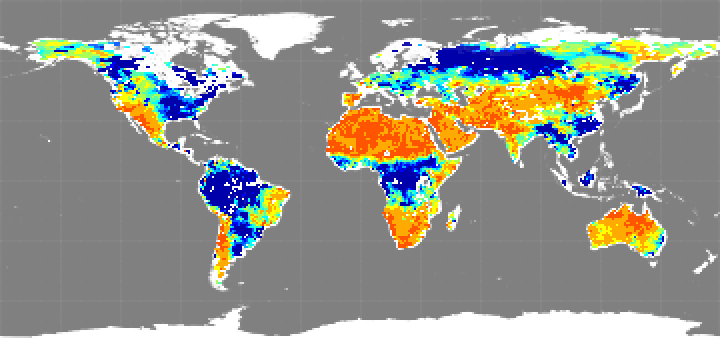
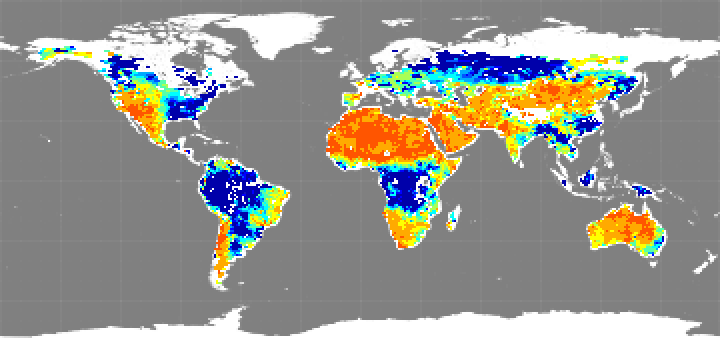
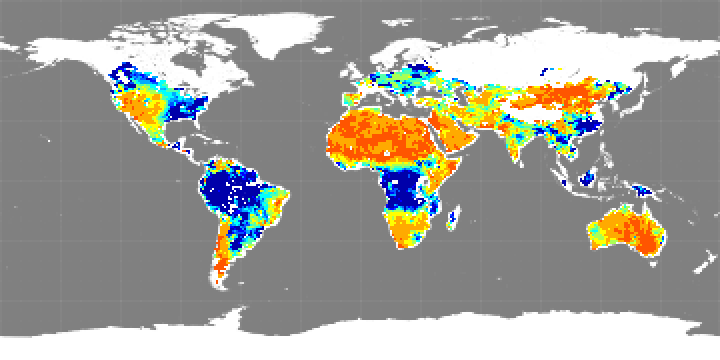
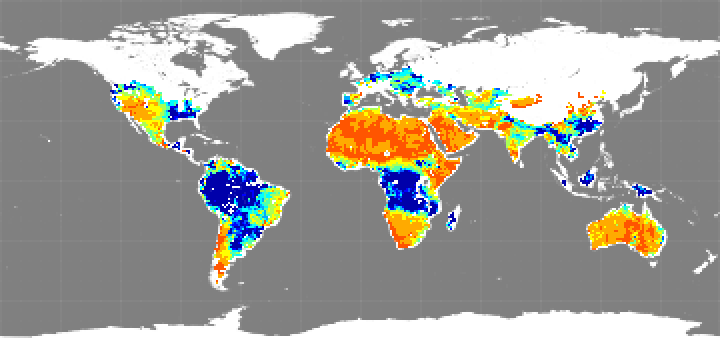
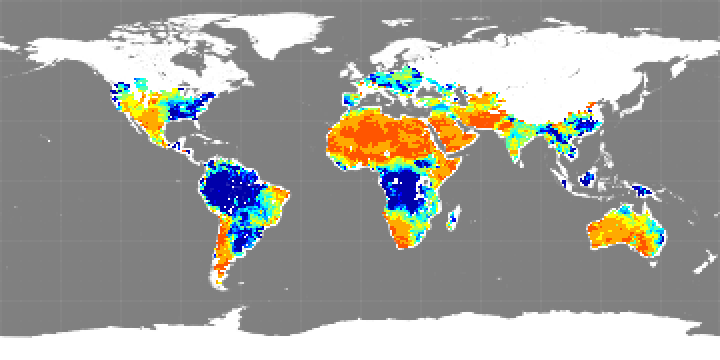
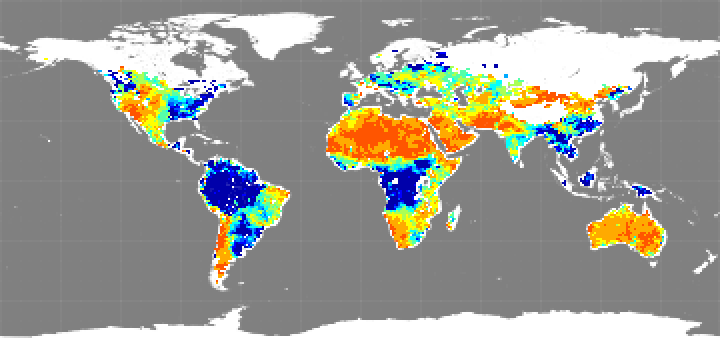
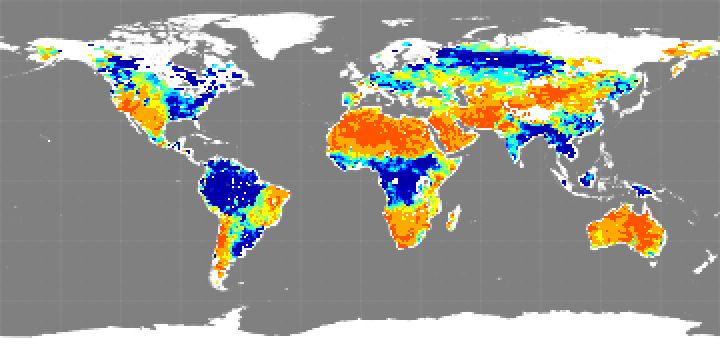
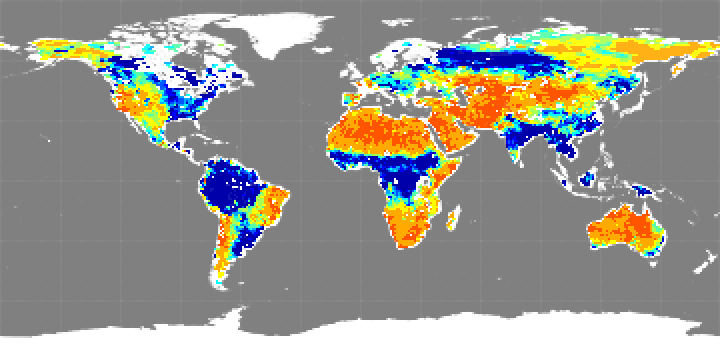
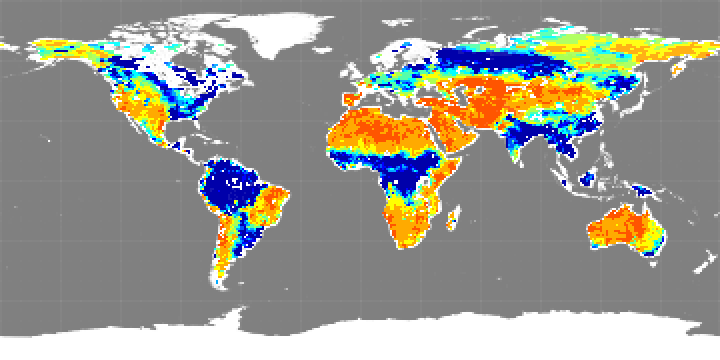
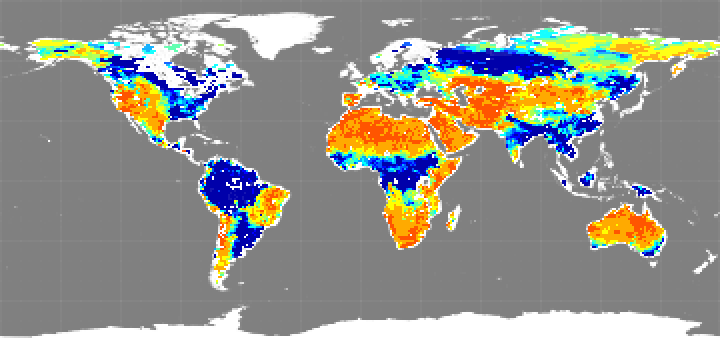
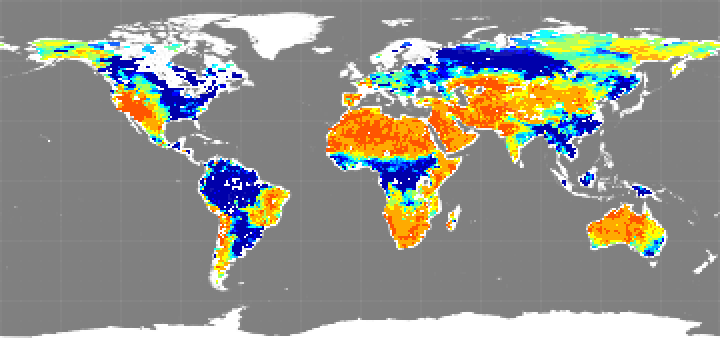
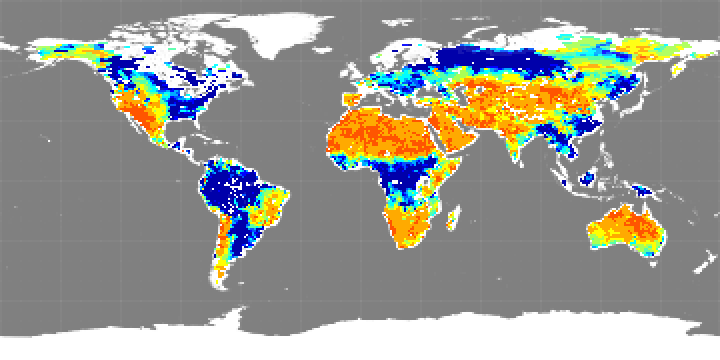
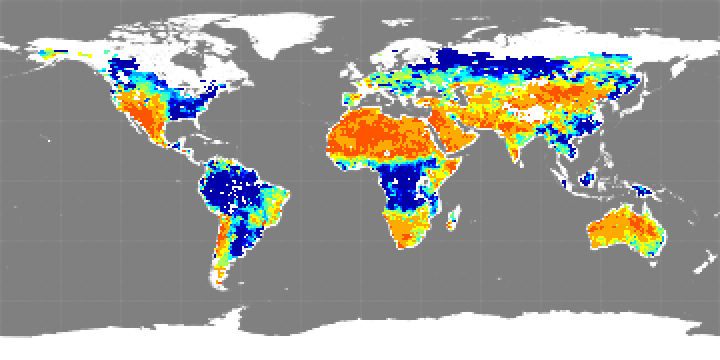
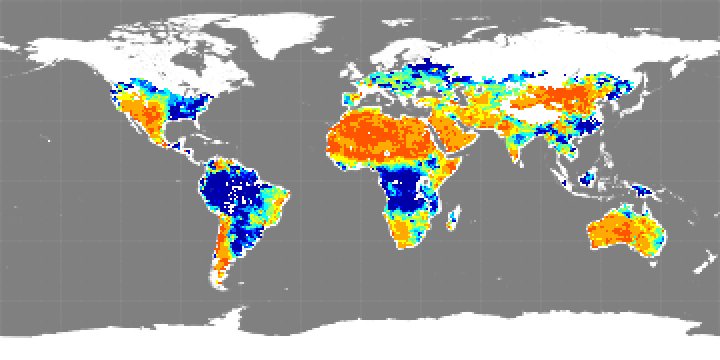
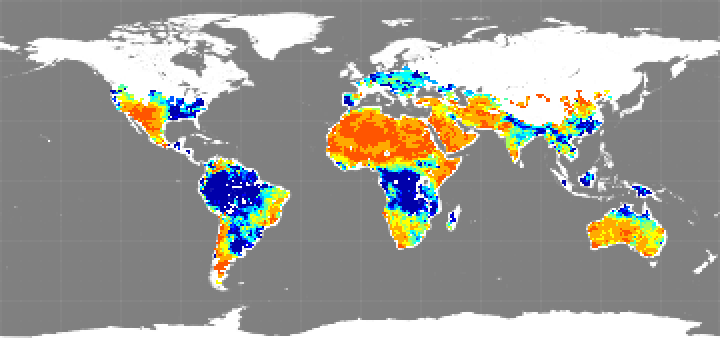
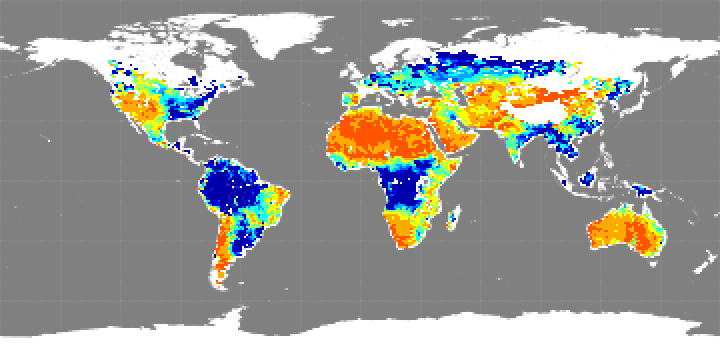
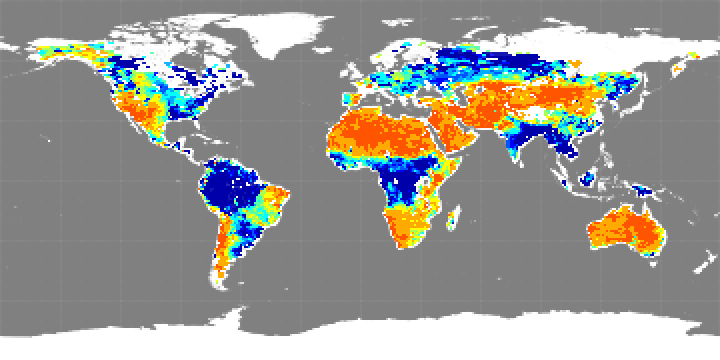
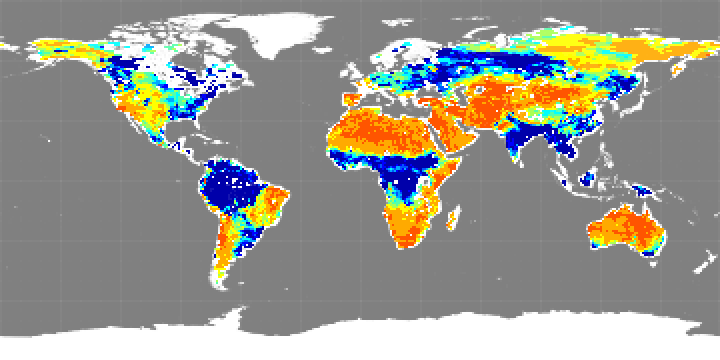
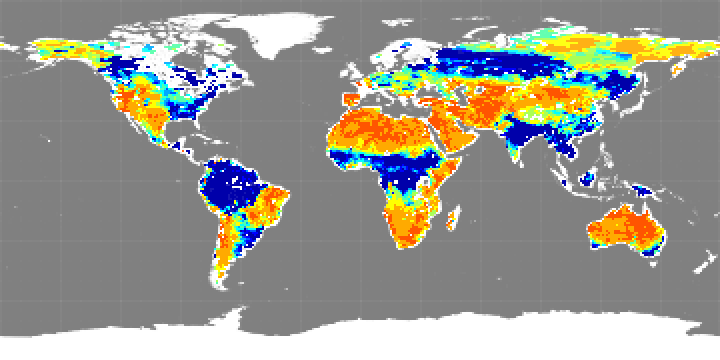
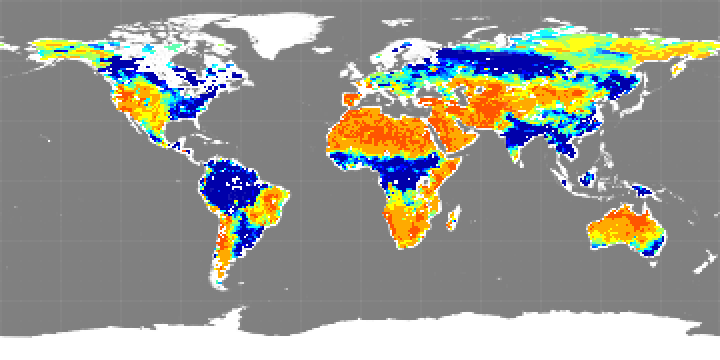
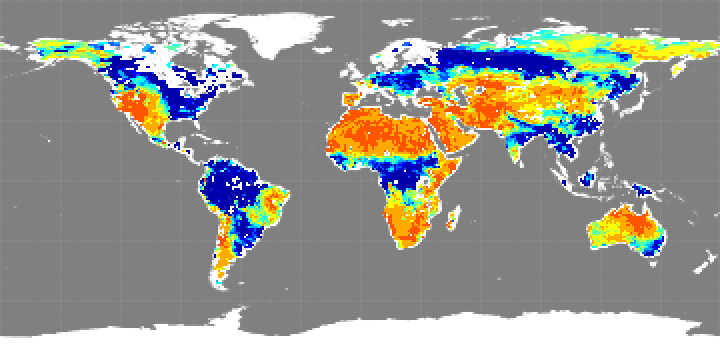
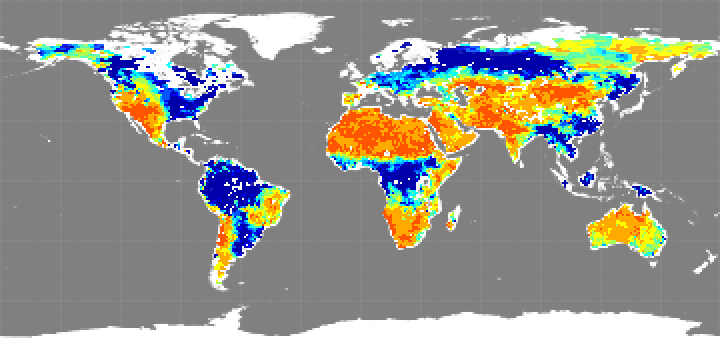
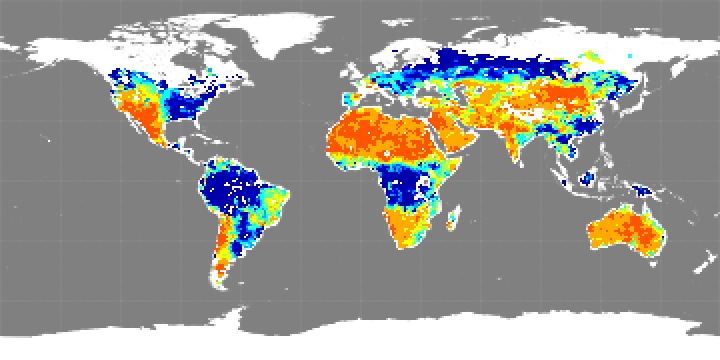
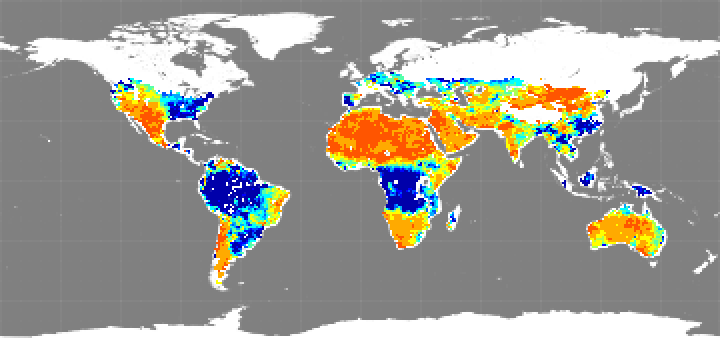
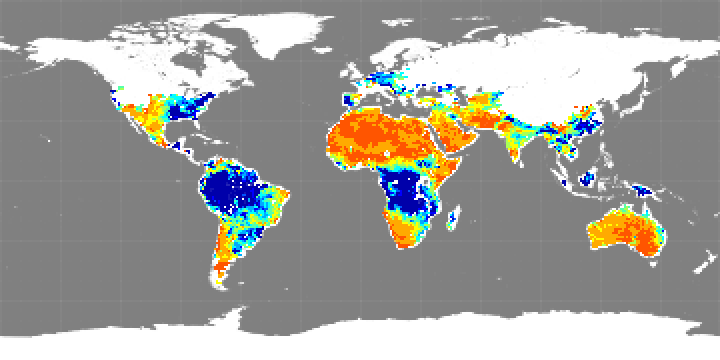
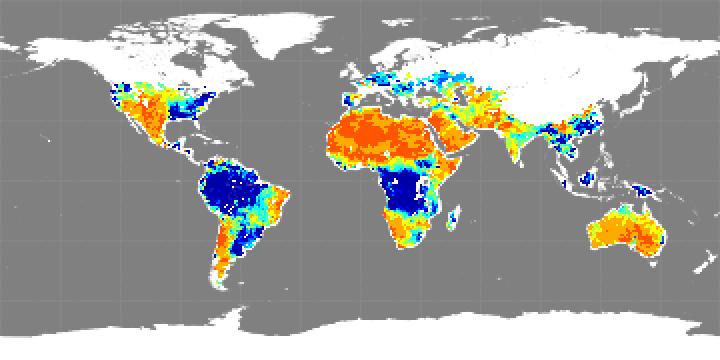
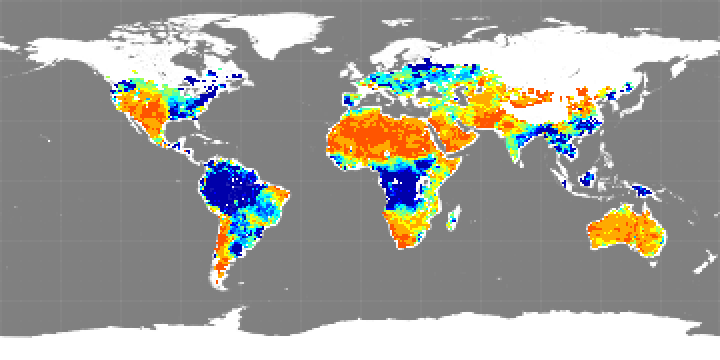
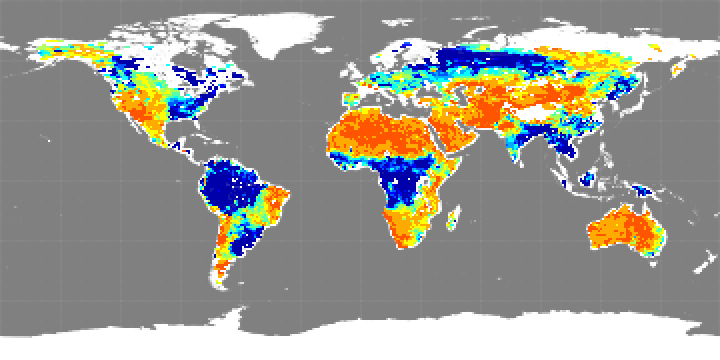
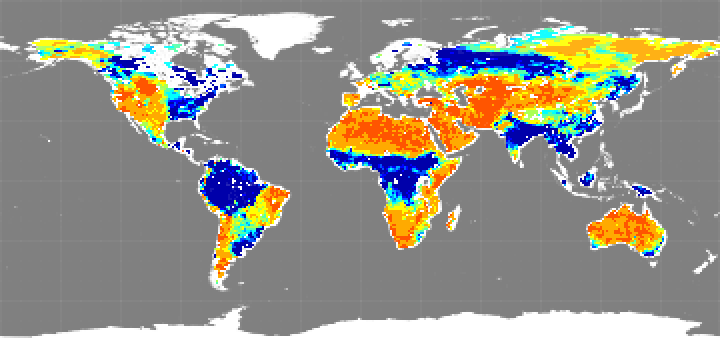
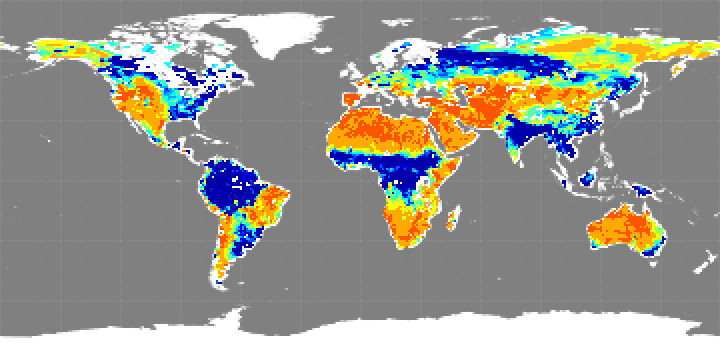
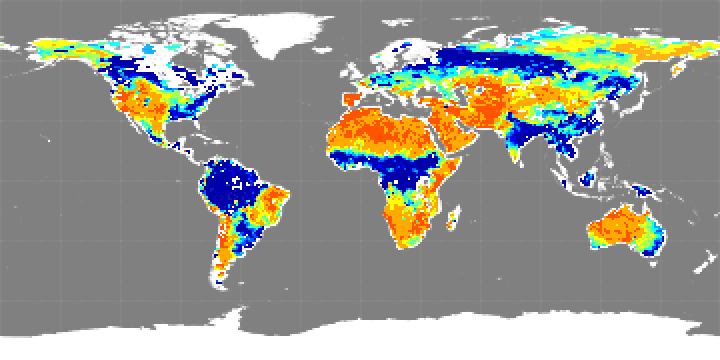
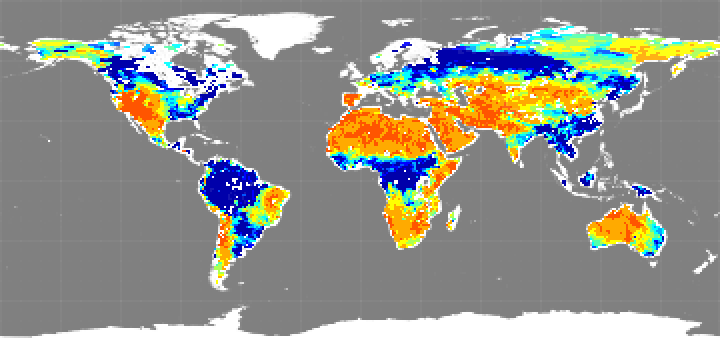
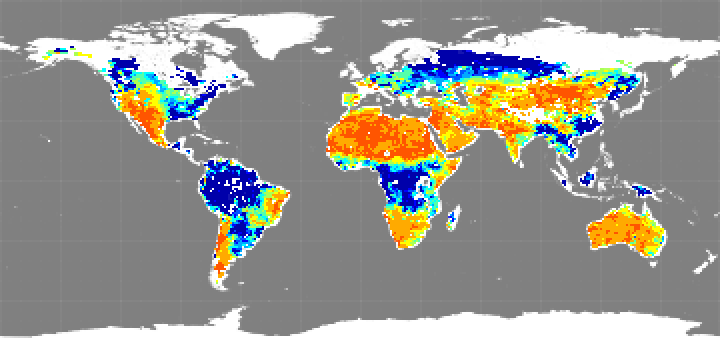
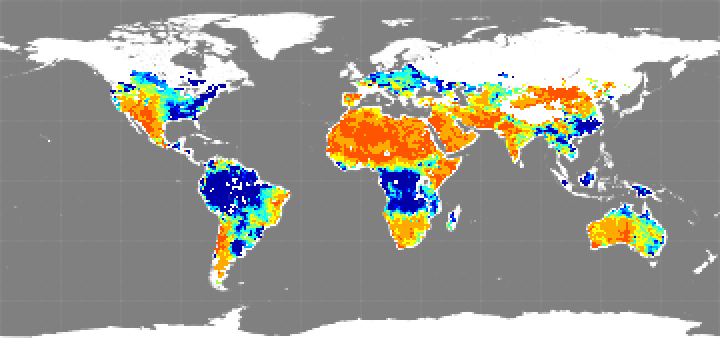
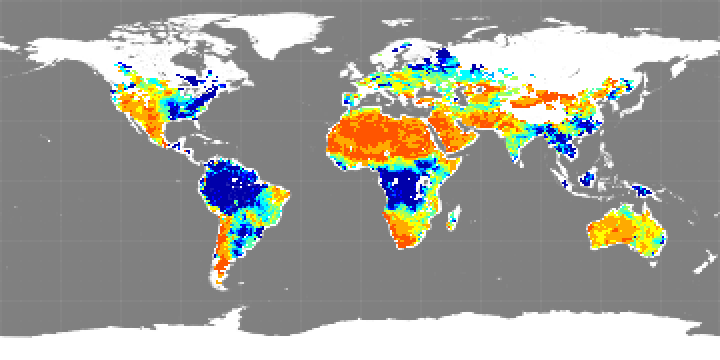
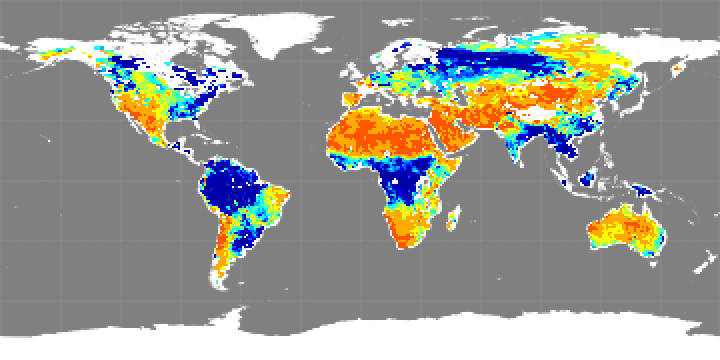
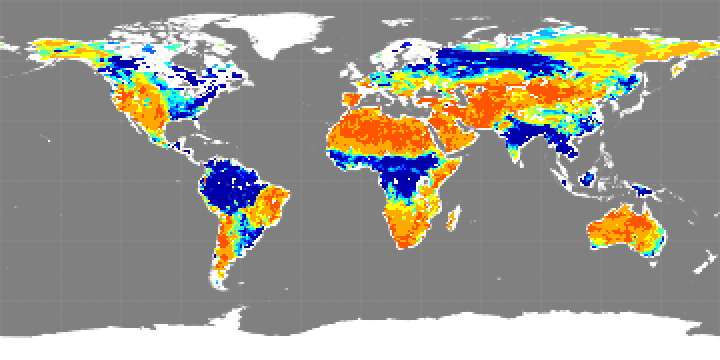
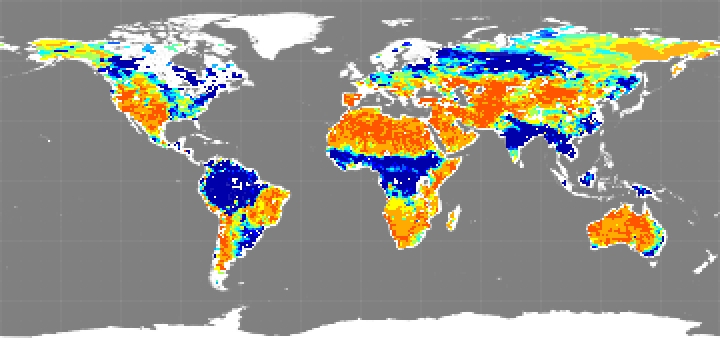
Monthly soil moisture map images, produced from Aquarius science products V5 and generated by the NASA Goddard Space Flight Center's Aquarius Data Processing System, are available here. These were derived from Aquarius' L-band horizontally polarized, brightness temperature observations, which provide higher sensitivity to soil moisture compared to vertically polarized observations, according to Principal Investigators Rajat Bindlish and Thomas Jackson, US Department of Agriculture. Click on the images (below) for a closer view. Original images are available here.

In these maps, reds show more arid conditions and blues show wetter soil conditions. Color coding reflects volumetric fraction of soil moisture, a measure of the amount of water per unit of soil. Those interested in obtaining or using single orbit, daily, weekly, monthly, seasonal or annual data should visit the National Snow and Ice Data Center's Aquarius Soil Moisture Data page.

Soil moisture, June 2015
June 2015
Soil moisture, May 2015
May 2015
Soil moisture, April 2015
April 2015
Soil moisture, March 2015
March 2015
Soil moisture, February 2015
February 2015
Soil moisture, January 2015
January 2015
Soil moisture, December 2014
December 2014
Soil moisture, November 2014
November 2014
Soil moisture, October 2014
October 2014
Soil moisture, September 2014
September 2014
Soil moisture, August 2014
August 2014
Soil moisture, July 2014
July 2014
Soil moisture, June 2014
June 2014
Soil moisture, May 2014
May 2014
Soil moisture, April 2014
April 2014
Soil moisture, March 2014
March 2014
Soil moisture, February 2014
February 2014
Soil moisture, January 2014
January 2014
Soil moisture, December 2013
December 2013
Soil moisture, November 2013
November 2013
Soil moisture, October 2013
October 2013
Soil moisture, September 2013
September 2013
Soil moisture, August 2013
August 2013
Soil moisture, July 2013
July 2013
Soil moisture, June 2013
June 2013
Soil moisture, May 2013
May 2013
Soil moisture, April 2013
April 2013
Soil moisture, March 2013
March 2013
Soil moisture, February 2013
February 2013
Soil moisture, January 2013
January 2013
Soil moisture, December 2012
December 2012
Soil moisture, November 2012
November 2012
Soil moisture, October 2012
October 2012
Soil moisture, September 2012
September 2012
Soil moisture, August 2012
August 2012
Soil moisture, July 2012
July 2012
Soil moisture, June 2012
June 2012
Soil moisture, May 2012
May 2012
Soil moisture, April 2012
April 2012
Soil moisture, March 2012
March 2012
Soil moisture, February 2012
February 2012
Soil moisture, January 2012
January 2012
Soil moisture, December 2011
December 2011
Soil moisture, November 2011
November 2011
Soil moisture, October 2011
October 2011
Soil moisture, September 2011
September 2011
Soil moisture, August 2011
August 2011
Colorbar
Publications
Bindlish, R. and T. Jackson. 2013. Aquarius Level-3 Gridded 1-Degree Monthly Soil Moisture, Version 2, Boulder, Colorado USA: NASA DAAC at the National Snow and Ice Data Center.