

- HOME
- SCIENCE
- HIGHLIGHTS
- DATA & MAPS
- DATA FOR YOU
- MEETINGS
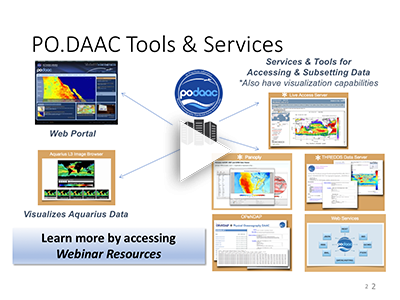
The videos and resources below offer guidance for accessing and visualizing salinity data from the Physical Oceanography Distributed Active Archive Center (PO.DAAC). Datasets for SMAP and Aquarius are available for download on the PO.DAAC website.
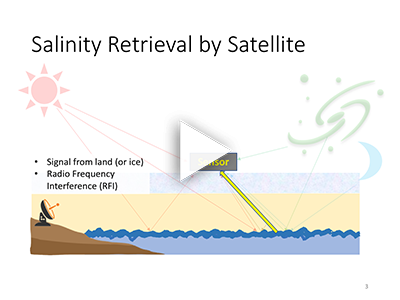
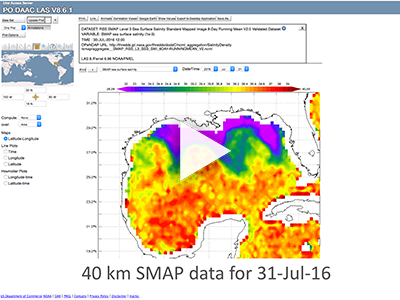
The pioneering Aquarius instrument on the SAC-D satellite was specifically designed to detect global ocean salinity, which is extremely challenging to measure accurately from space. NASA's salinity measurements have continued, thanks to the Soil Moisture Active Passive (SMAP) Mission. SMAP collects data at the same frequency (L-band) used by Aquarius but employs different technology.
This webinar provides an overview of the similarities and differences between salinity data collected by Aquarius and SMAP. It also includes demonstrations of Physical Oceanography Distributed Active Archive Center (PO.DAAC) tools that can be used to visualize various salinity datasets. You can view the full webinar on YouTube or click on one of the individual presentations below.
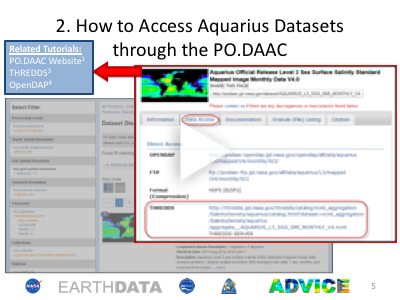
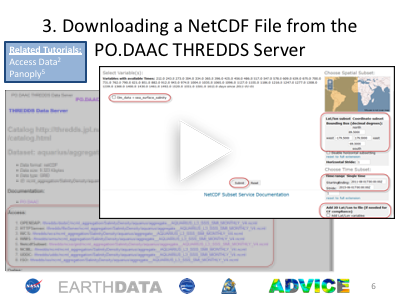
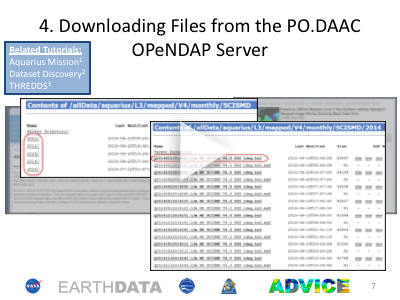
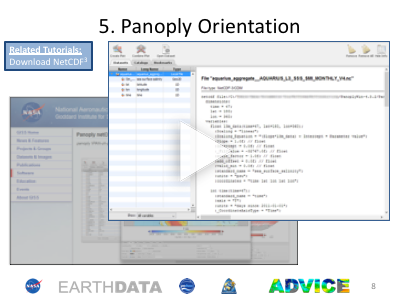
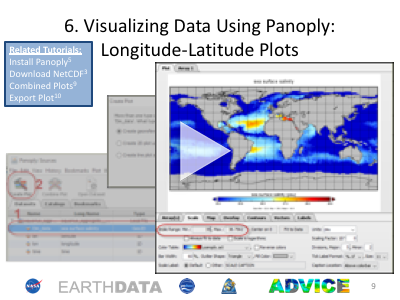
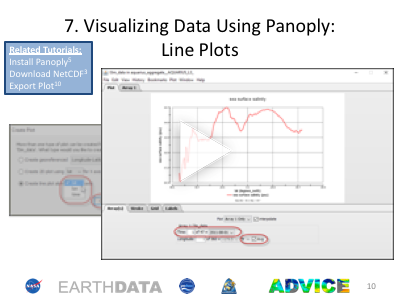
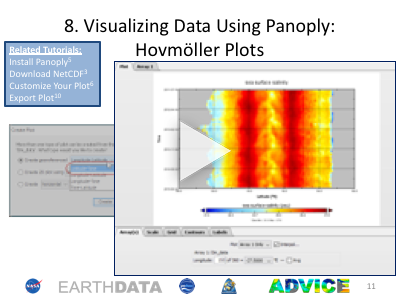
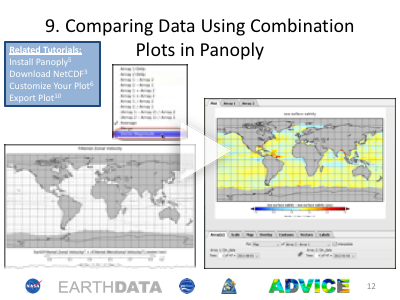
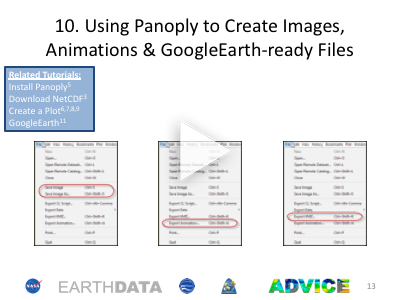
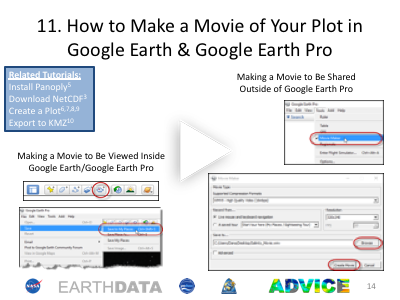
The following videos demonstrate the process of finding, accessing, and downloading salinity data from PO.DAAC and plotting the data in a visualization tool (Panoply). The tutorials also cover exporting images, animations and files that can be uploaded to Google Earth.
Note: There have been some changes to the datasets since these videos were created (e.g., the inclusion of data from SMAP and the release of additional Aquarius datasets). The pathway and process outlined below for accessing the files to visualize the data are the same – but please note that the referenced website(s) may differ slightly in appearance from the recording. Tutorials were developed by Dr. Leslie Smith (Your Ocean Consulting).
The PO.DAAC Forum includes a collection of additional documentation and tutorials for users who have questions about datasets in the PO.DAAC archive. The clips below provide an overview of additional tools (including the NASA Live Access Server) for visualizing salinity data.
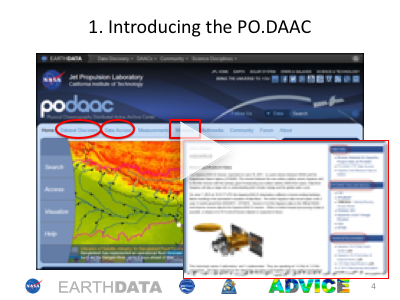
The Aquarius Communication team partnered with NASA's Physical Oceanography Distributed Active Archive Center (PO.DAAC) and Earth Observing System Data and Information System (EOSDIS) in April 2016 to pilot a four-part webinar series. The Aquarius Data Visualization, Interpretation, Communication & Engagement (ADVICE) webinar videos and resources created for the series include instructions on accessing, downloading and plotting salinity data, as well as examples of the types of scenes and "stories" that can be told with salinity data.
Session 1 featured Dr. Tony Lee (JPL) and provided an overview of Aquarius/SAC-D and an orientation to Aquarius salinity data resources.