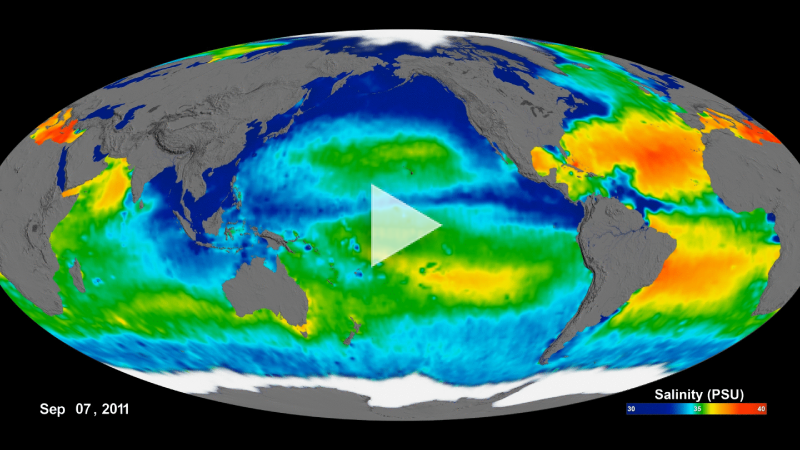
Observations of sea surface salinity (SSS) taken during the life span of the Aquarius spacecraft. SSS is shown ranging from 30 to 40 PSU (from blue to green to red) on a flat map using extended Molleide projection.
Download this movie.
Aquarius Sea Surface Salinity, 2011-2015 (Mollweide)
[14-Sep-2015] This visualization shows the complete observations of sea surface salinity (SSS) taken during the life span (September 2011 through May 2015) of the Aquarius spacecraft. SSS is shown ranging from 30 to 40 Practical Salinity Units (PSU) (from blue to green to red) on a flat map using extended
and
Version 4.0 of the Aquarius data products. White colors shown in the animation are annual polar ice formation and melting.

