This visualization shows ocean currents in the Northern Atlantic from Jan 01, 2010 to Dec 31, 2012. Compare the sea surface currents (0 meters) with the deep ocean curents (2000 meters).
Download this movie.
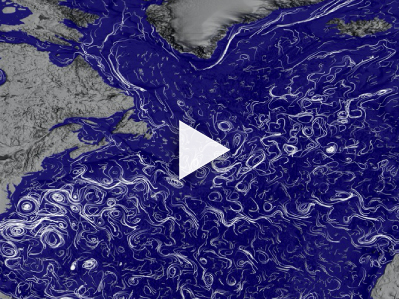
Ocean Flows at Surface and 2000 Meters Below Sea Level
[16-Nov-2017] This visualization shows ocean currents in the Northern Atlantic from Jan 01, 2010 to Dec 31, 2012. Compare the sea surface currents (0 meters) with the deep ocean curents (2000 meters). Notice some of the differences in speed and direction of the currents between sea level and 2000 meters below sea level. For example, the Gulf Stream off the coast of Eastern North America flows strongly towards the northeast, while at 2000 meters below sea level, the flow is weaker and in the opposite direction.

