


- HOME
- SCIENCE
- HIGHLIGHTS
- DATA & MAPS
- DATA FOR YOU
- MEETINGS
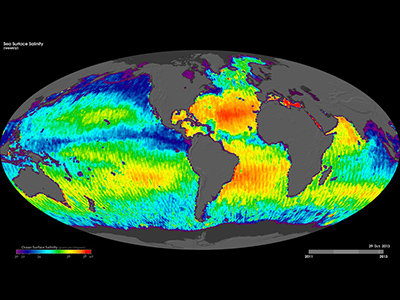
The ocean's salinity is key to studying the water cycle and ocean circulation, both of which are important to Earth's climate. These maps show weekly sea-surface salinity from August 2011 to the present, as derived from Aquarius data. The colors of these data indicate the areas of low (dark purple) to high (light yellow) salinity in practical salinity units (psu). The Practical Salinity Scale (of which psu is a component) is used to describe the concentration of dissolved salts in water and defines salinity in terms of a conductivity ratio, so it is dimensionless. Black areas show where data were not available. Several well-known ocean salinity features such as higher salinity in the subtropics; higher average salinity in the Atlantic Ocean compared to the Pacific and Indian oceans; and lower salinity in rainy belts near the equator, in the northernmost Pacific Ocean and elsewhere are visible. These features are related to large-scale patterns of rainfall and evaporation over the ocean, river outflow and ocean circulation.
View visualization on the NASA SVS website.
(00:00:38) Credit: NASA/Goddard Space Flight Center.
👋 Hello, Explorer!
I'm the NASA Salinity Assistant. Ask me anything about ocean salinity, missions, and data!
👋 Welcome to NASA Salinity AI Assistant!
I know everything about this website — missions, data, science, publications and more. What would you like to know?
Powered by · NASA Salinity