


- HOME
- SCIENCE
- HIGHLIGHTS
- DATA & MAPS
- DATA FOR YOU
- MEETINGS
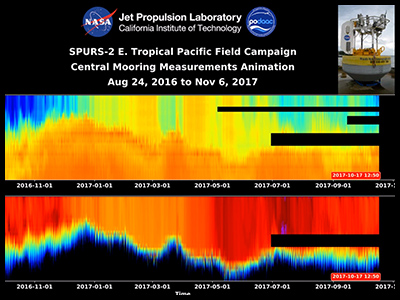
Animation of the ocean temperature (bottom plot) and salinity (top plot) profiles from central mooring CTD measurements during the SPURS-2 campaign over the period August 2016 to November 2017.
The dataset can be accessed from the PO.DAAC Portal.
doi: 10.5067/SPUR2-MOOR1
The original movie can be found on the PO.DAAC website.
(00:01:09) Credit: NASA PO.DAAC.
👋 Hello, Explorer!
I'm the NASA Salinity Assistant. Ask me anything about ocean salinity, missions, and data!
👋 Welcome to NASA Salinity AI Assistant!
I know everything about this website — missions, data, science, publications and more. What would you like to know?
Powered by · NASA Salinity