Soil Moisture, Salinity and Precipitation
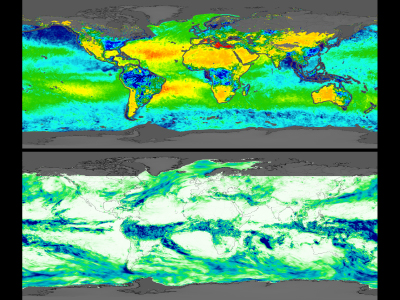
[15-Jul-2019] This visualization compares weekly soil moisture and sea surface salinity data (over land and water, respectively) from NASA's Soil Moisture Active Passive Satellite (SMAP) mission [top map] with a precipitation product called Integrated Multi-satellite Retrievals for GPM (IMERG) [bottom map], from March 31, 2015 to March 24, 2019. These maps reveal how precipitation amounts influence soil moisture conditions and sea surface salinity. For example, high amounts of precipitation along the equator coincide with relatively moist soil conditions on land (blue shades) and low salinity values in the ocean (green and blue shades). Conversely, areas that receive little or no precipitation, such as the Sahara Desert in northern Africa, coincide with dry soils (dark yellow shades).
Scientists can use data from SMAP and IMERG to develop improved flood prediction and drought monitoring capabilities. Societal benefits include improved water-resource management, agricultural productivity, and wildfire and landslide predictions. Data from SMAP also allow us to extend the data record of the highly successful 3-year Aquarius sea surface salinity mission into the future. The images shown here are 8-day averages. (00:00:49) Credit: NASA.
Watch Movie »
NASA Hyperwall »