Credit: NASA’s Scientific Visualization Studio.
Download this movie.
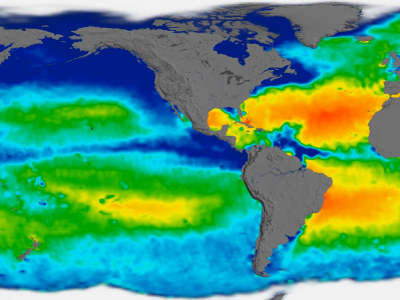
Aquarius Sea Surface Salinity, 2011-2015 (Flat Map)
[10-Sep-2015] This visualization shows the complete observations of sea surface salinity taken during the life span (2011 through May 2015) of the Aquarius spacecraft. Sea surface salinity is shown ranging from 30 to 40 PSU (from blue to green to red) on a flat map using simple cartesian (rectangular) projection. The visualization was generated based on version 4.0 of the Aquarius data products. (00:00:53) Credit: NASA’s Scientific Visualization Studio.
Watch Movie »
NASA SVS »

