


- HOME
- SCIENCE
- HIGHLIGHTS
- DATA & MAPS
- DATA FOR YOU
- MEETINGS
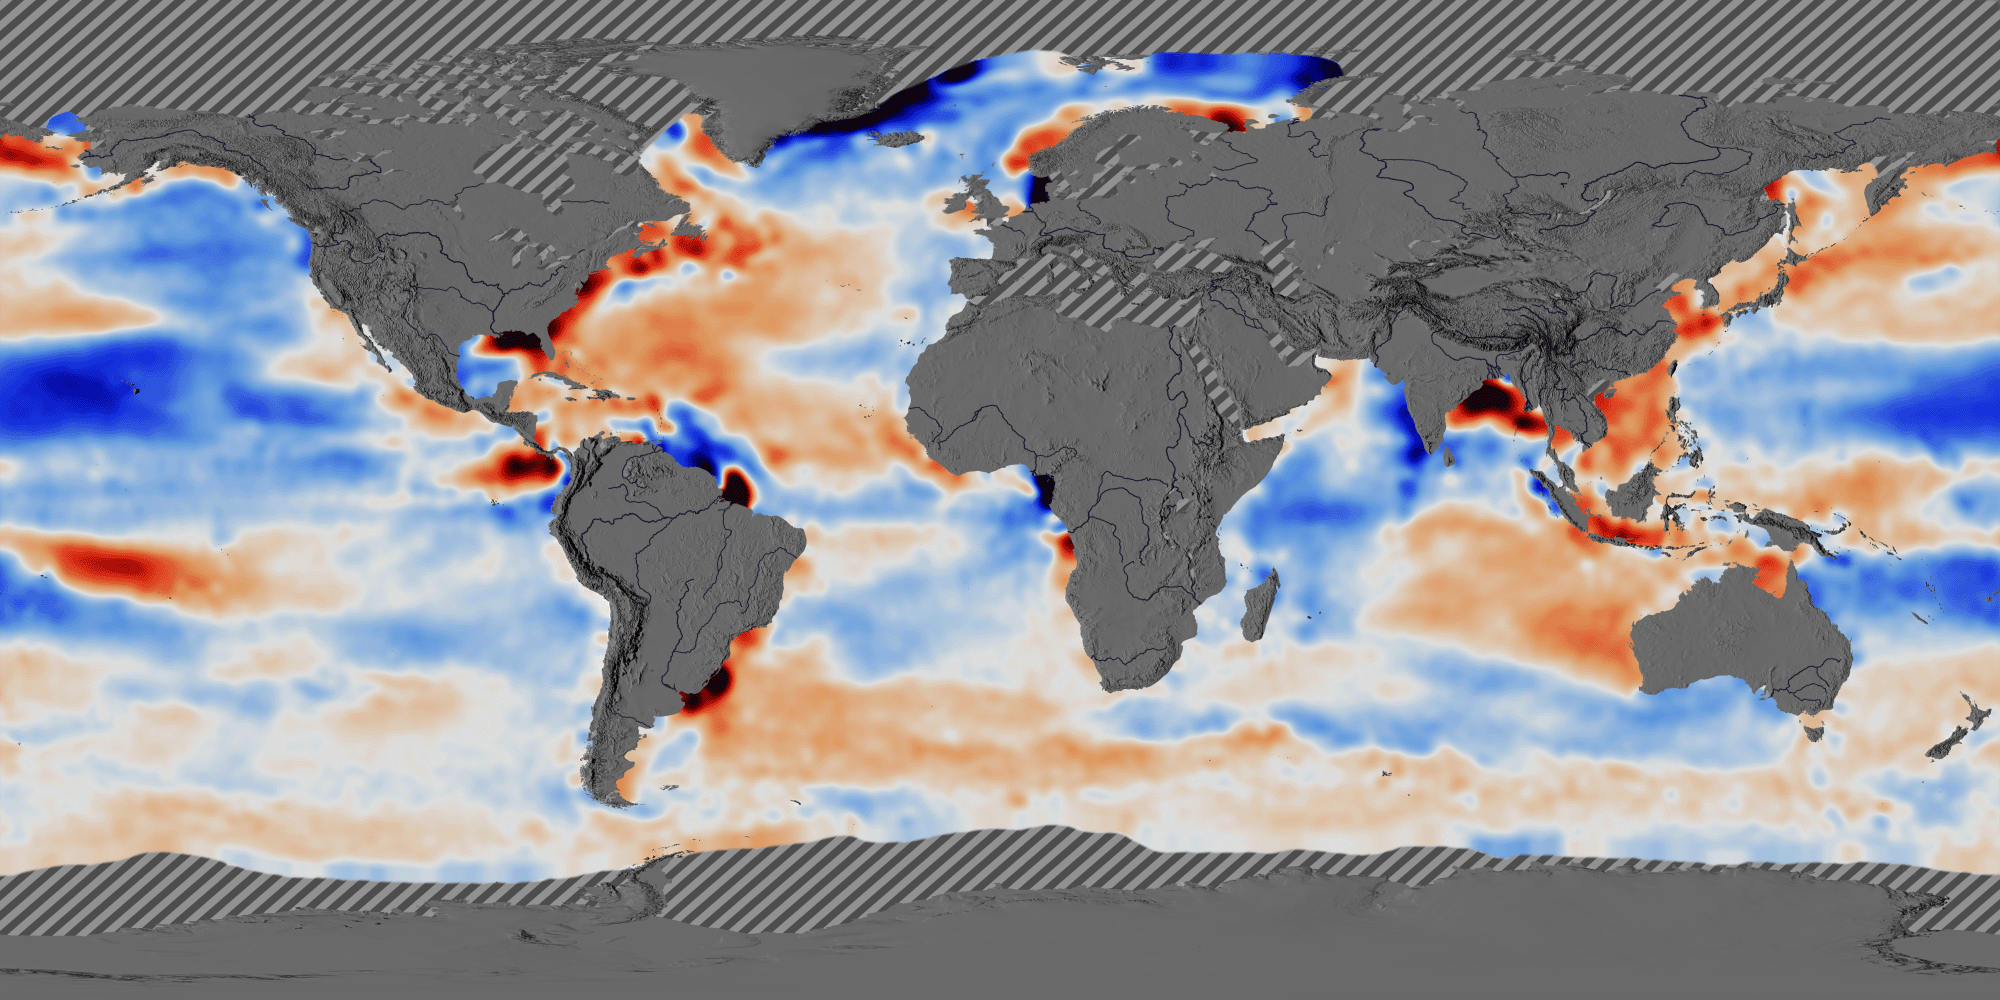
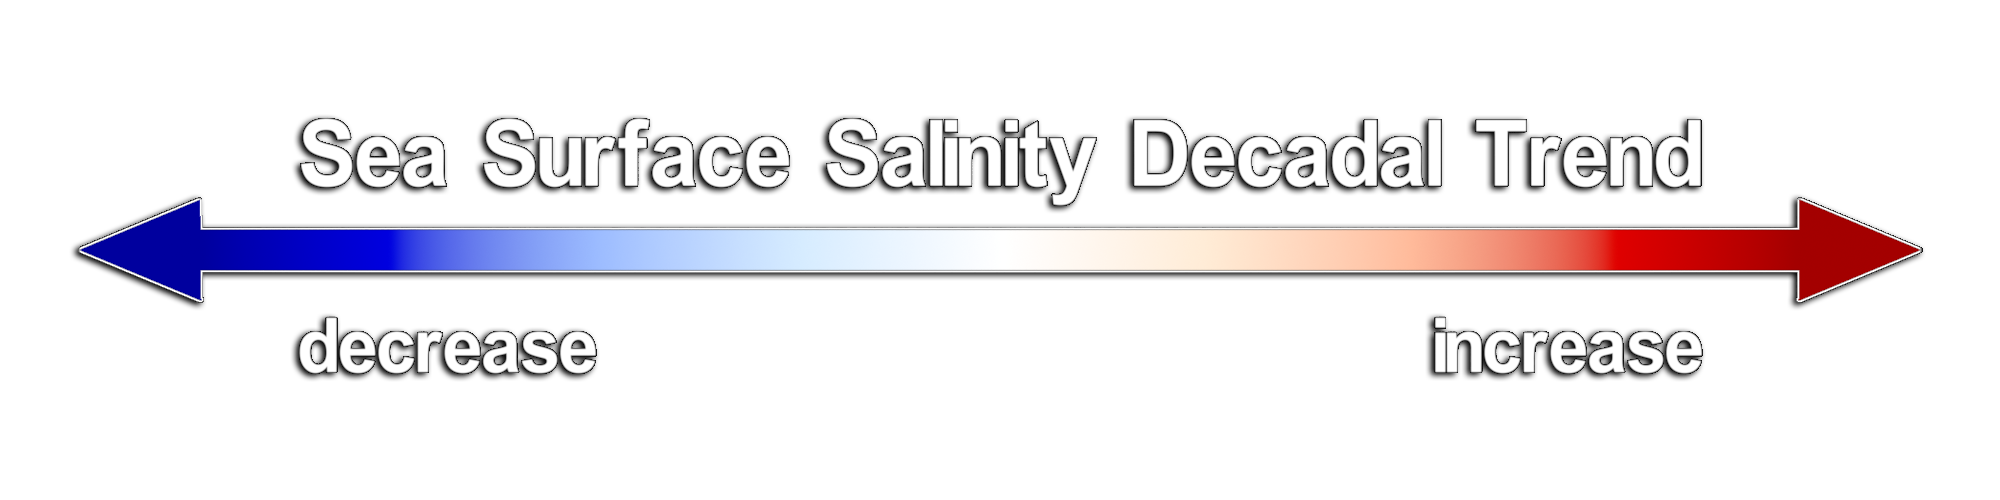
This data visualization shows the areas where sea surface salinity has increased (depicted in red) and decreased (depicted in blue) over ten years (2011 to 2021).
The heat of the sun forces evaporation at the ocean's surface, which puts water vapor into the atmosphere but leaves minerals and salts behind, keeping the ocean salty. The salinity of the ocean also varies from place to place, because evaporation varies based on the sea surface temperature and wind, rivers and rain storms inject fresh water into the ocean, and melting or freezing sea ice affects the salinity of polar waters.
View visualization on the NASA SVS website.
View: Click on the image to enlarge. Click on the Escape key or anywhere outside the shadowbox to close.
Download: To download a copy, right click on the image and select Save Image As (on a Mac keyboard, click the touchpad while holding down the Control key). To download the highest resolution in our database, first click on the image to enlarge and then save that version.

👋 Hello, Explorer!
I'm the NASA Salinity Assistant. Ask me anything about ocean salinity, missions, and data!
👋 Welcome to NASA Salinity AI Assistant!
I know everything about this website — missions, data, science, publications and more. What would you like to know?
Powered by · NASA Salinity