
Collection of Data Swaths Using the Aquarius Instrument
Alt Tag: Data swaths made by the Aquarius instrument.
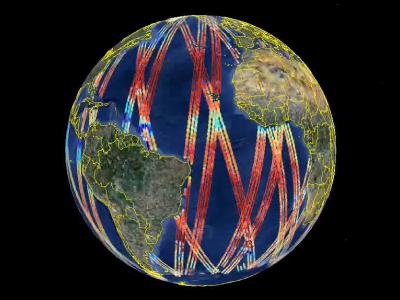
Movie Description: This composite map demonstrates Aquarius' ability to detect large-scale salinity distribution features clearly and with sharp contrast. The map shows several well-known ocean salinity features such as higher salinity (reds and yellows) in the subtropics; higher average salinity in the Atlantic Ocean as compared to the Pacific and Indian Oceans; and lower salinity (blues and purples) in rainy belts near the equator, in the northernmost Pacific Ocean and elsewhere. These features are related to large-scale patterns of rainfall and evaporation over the ocean, river outflow and ocean circulation. Aquarius will monitor how these features change and study their link to climate and weather variations. Credit: NASA Jet Propulsion Laboratory.