
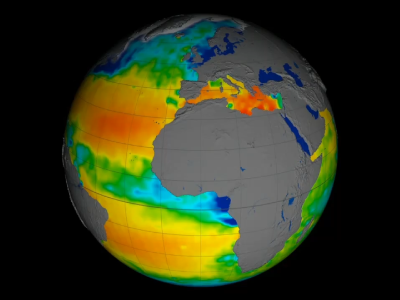
Changes in Global Sea Surface Salinity
Alt Tag: Global view of sea surface salinity.
Movie Description: This visualization shows changes in global sea surface salinity, as measured by NASA's Aquarius instrument, from December 2011 through December 2012. Red represents areas of high salinity, while blue represents areas of low salinity. Credit: NASA.