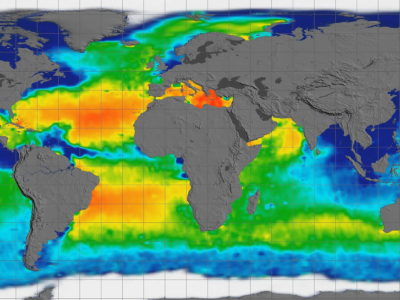
Aquarius Sea Surface Salinity, 2011-2014 (Flat Map)
Alt Tag: Global sea surface salinity.
Movie Description: This visualization celebrates over three years of successful Aquarius observations, from September 2011 through September 2014. Sea surface salinity is shown on a flat map using simple Cartesian and extended Mollweide projections. Versions are included with and without grid lines, and in both Atlantic- and Pacific-centered projections. This visualization was generated based on version 3.0 of the Aquarius data products. Credit: NASA's Goddard Space Flight Center Scientific Visualization Studio.