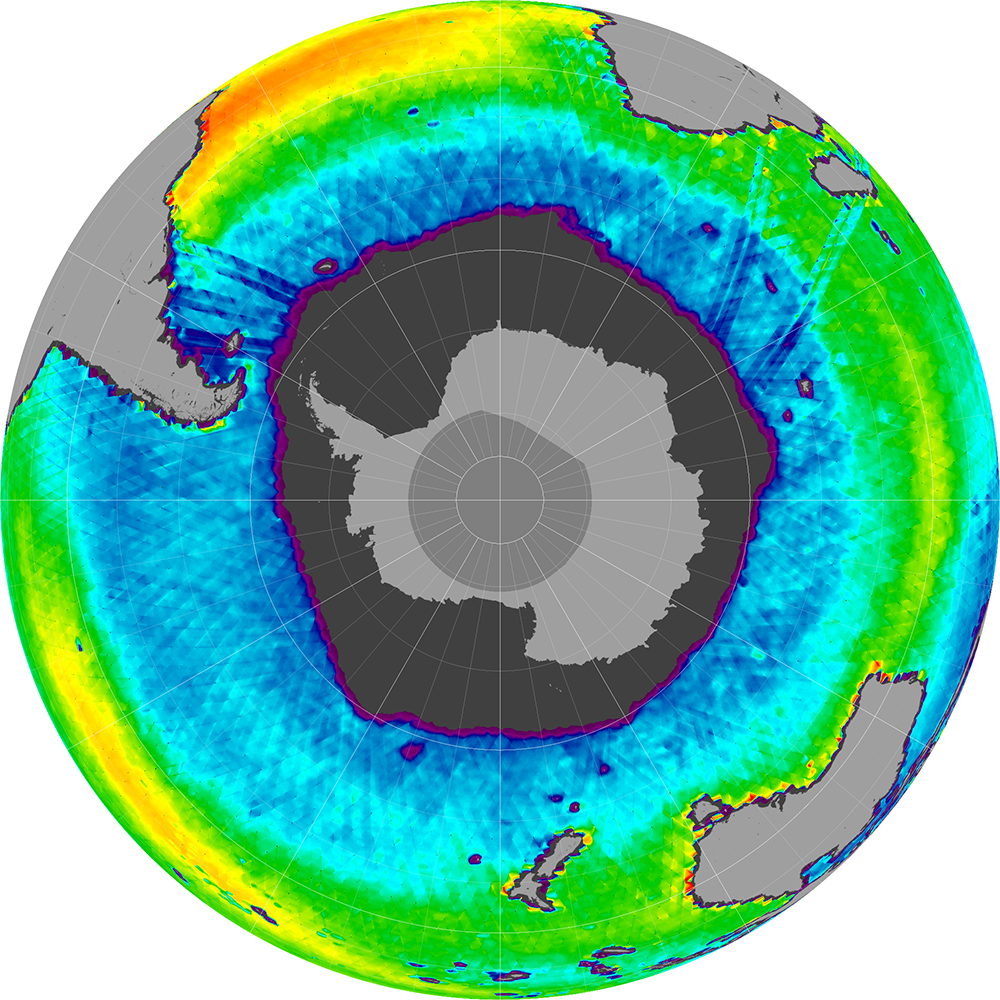
September 2011
Alt Tag: Sea surface salinity in the Southern Hemisphere, September 2011.
Map Description: Sea surface salinity in the Southern Hemisphere for September 2011. This monthly composite map was produced by Norman Kuring (NASA Goddard Space Flight Center) and is based on the latest algorithms developed by the Aquarius Calibration/Validation working group. Red colors indicate higher salinity (40 grams per kilogram); purple indicates relatively low salinity (30 grams per kilogram). Credit: Norman Kuring, NASA Goddard Space Flight Center.