
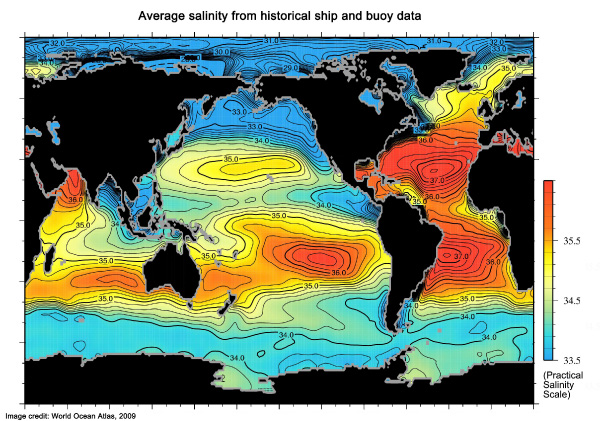
Average Salinity From Historical Ship and Buoy Data
Alt Tag: Average salinity from historical ship and buoy data.
Description: This map shows interpolated global ocean salinity at the surface based on all historical observations: red areas have high salinity (i.e., 36 Practical Salinity Scale, PSS, or higher) and blue areas have low salinity (i.e., 34 PSS or lower). Credit: World Ocean Atlas 2009.