

- HOME
- SCIENCE
- HIGHLIGHTS
- DATA & MAPS
- DATA FOR YOU
- MEETINGS
Remote Sensing Systems (RSS) Version 5 (V5) sea surface salinity processing is based on an updated version of SMAP antenna temperatures. RSS SMAP V5 data now include formal uncertainty estimates for all retrievals and, in gridded Level-3 (L3) products, ancillary wind speeds and integrated rain-filtered fields. V5 directly ingests higher-resolution (0.25°) ancillary atmospheric data. It also uses new sea-ice flags, sea-ice corrections, and an updated land correction threshold. As before, the standard product of the SMAP V5 release is the smoothed product with a spatial resolution of approximately 70 km. In terms of open ocean scenes, there are little to no changes with respect to Version 4 (V4) processing.
Note: The content of this page covers SMAP data processing by RSS as opposed to SMAP data processing by JPL.
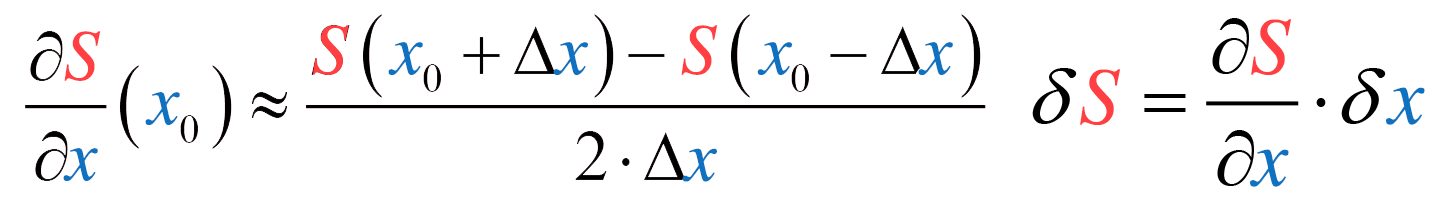
SMAP V5 provides formal uncertainty estimates in its 40-km resolution and 70-km resolution smoothed products. This includes both L3 gridded and Level-2 (L2) swath data files. Formal uncertainties are derived by running perturbed retrievals and determining the sensitivity to various error sources, x.
Included error sources:
As opposed to previous versions that used information from ancillary sea-ice products, V5 sea-ice flags and sea-ice corrections are based on direct ingestion of brightness temperature (TB) data from the Advanced Microwave Scanning Radiometer 2 (AMSR-2). V5 also includes a new ice mask that defines sea-ice zones and detects large drifting icebergs. Learn more from Meissner & Manaster, 2021. Check out our story on this topic, Sensing Salinity Near the Edge.

Basic flow of SMAP Sea-Ice Detection and Correction Algorithm. The blue pathway depicts SMAP processing from the antenna temperature to L3 gridded sea surface salinity data. Green pathway depicts the flow of AMSR-2 data into SMAP’s V5 ice-flagging. Red arrows show the introduction of ancillary data from Cross-Calibrated Multi-Platform (CCMP), National Centers for Environmental Prediction (NCEP), Canadian Meteorological Center (CMC), and Integrated Multi-satellitE Retrievals (IMERG).
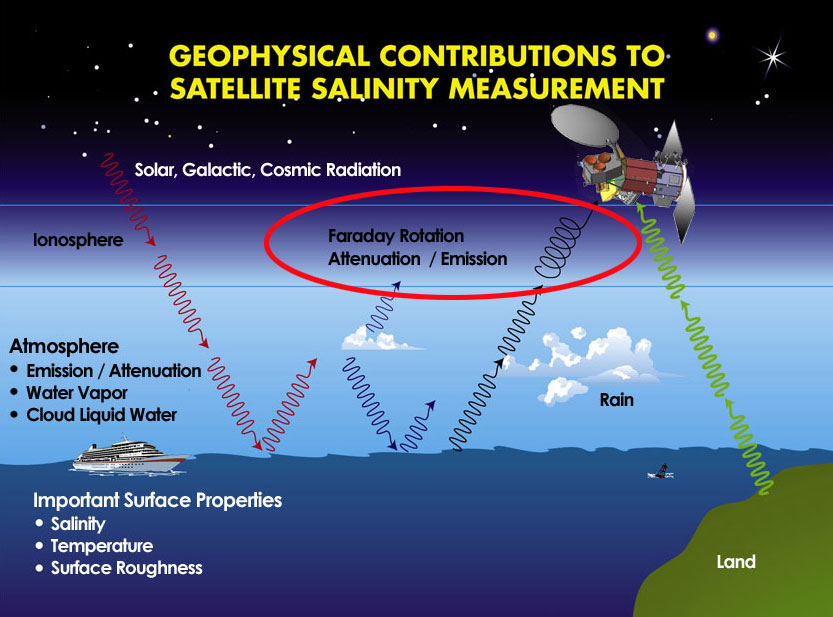
The RSS SMAP salinity retrieval algorithm needs to correct for the atmosphere between the satellite and earth’s surface.
V5 uses ancillary 0.25° atmospheric data products provided by NCEP. These fields include temperature, pressure, and relative humidity. V4 and earlier had used NCEP 1° products for this purpose.
For V5 cloud liquid water calculations, NCEP’s 0.25° cloud water mixing ratio profiles and L-band (i.e., SMAP radiometer frequency) liquid water absorption data are used. V4 and earlier used the IMERG rain rate, transformed into cloud liquid water.
For V5, 8-day and monthly L3 data files contain some information that was distributed as separate data files in earlier processing versions. V5 continues to use the same wind model as before, CCMP gridded surface vector winds. However, the aggregate wind speed average has been integrated into L3 files. Likewise, rain filtered 70-km sea surface salinity fields are now included as additional fields in L3 files. For V4 and earlier, they had been provided as separate ‘rain-filtered’ (RF) files.
Two key values related to land correction are fland, defined as the land fraction within the SMAP footprint and gland, defined as the gain-weighted land fraction. In the V5 smoothed 70-km product, the “moderate land contamination” threshold for fland has been increased to 0.005 (from 0.001 in V4). This change impacts land-contaminated observations such as those related to small islands.
Note that the land correction is not applied if the values of either gland or fland exceeds 0.1, which is defined as “strong” land contamination. Also, the threshold value of gland, remains the same as V4 (i.e., >0.04). Learn more about SMAP Land Correction
Dinnat, E. and Brucker, L. (2016). Improved Sea Ice Fraction Characterization for L-Band Observations by the Aquarius Radiometers, IEEE Transactions on Geoscience and Remote Sensing, doi: 10.1109/TGRS.2016.2622011.
Meissner, T., and Manaster, A. (2021). SMAP Salinity Retrievals near the Sea-Ice Edge Using Multi-Channel AMSR2 Brightness Temperatures, Remote Sensing 13(24), 5120, doi: 10.3390/rs13245120
Meissner, T., Wentz, F.J., and Le Vine, D.M. (2017). Aquarius Salinity Retrieval Algorithm Theoretical Basis Document (ATBD), End of Mission Version; RSS Technical Report 120117; 1 December 1 2017. Available online.
Meissner, T., Wentz, F.J., and Le Vine, D.M. (2018). The Salinity Retrieval Algorithms for the NASA Aquarius Version 5 and SMAP Version 3 Releases, Remote Sensing 10, 1121, doi: 10.3390/rs10071121.
Wentz et al. (2014). Remote Sensing Systems GCOM-W1 AMSR2 Daily Environmental Suite on 0.25 Deg Grid, Version 8. Available online.
